warwick.ac.uk/lib-publications
Original citation:Amel, Hoda, Rongong, Jem, Moztarzadeh, Hadi and Hopkinson, Neil. (2016) Effect of section
thickness on fatigue performance of laser sintered Nylon 12. Polymer Testing, 53 . pp.
204-210.
Permanent WRAP URL:
http://wrap.warwick.ac.uk/86928
Copyright and reuse:
The Warwick Research Archive Portal (WRAP) makes this work by researchers of the University of Warwick available open access under the following conditions. Copyright © and all moral rights to the version of the paper presented here belong to the individual author(s) and/or other copyright owners. To the extent reasonable and practicable the material made available in WRAP has been checked for eligibility before being made available.
Copies of full items can be used for personal research or study, educational, or not-for-profit purposes without prior permission or charge. Provided that the authors, title and full bibliographic details are credited, a hyperlink and/or URL is given for the original metadata page and the content is not changed in any way.
Publisher’s statement:
© 2016, Elsevier. Licensed under the Creative Commons
Attribution-NonCommercial-NoDerivatives 4.0 International http://creativecommons.org/licenses/by-nc-nd/4.0/
A note on versions:
The version presented here may differ from the published version or, version of record, if you wish to cite this item you are advised to consult the publisher’s version. Please see the ‘permanent WRAP url’ above for details on accessing the published version and note that access may require a subscription.
Effect of Section Thickness on Fatigue Performance of Laser
Sintered Nylon 12
Hoda Amel
1,a, Jem Rongong
1, Hadi Moztarzadeh
2, Neil Hopkinson
1*1. Department of Mechanical Engineering, Faculty of Engineering, Mappin St, Sheffield, UK
2. Warwick Manufacturing Group, University of Warwick, Coventry, United Kingdom
* Present Address: Xaar plc, 316 Cambridge Science Park, Milton Rd, Cambridge, United Kingdom
a. Corresponding author, [email protected], 07908479413
Abstract
Laser Sintering offers manufacturers freedom of design, which enables creating parts
with complex geometries. However, very little investigation has been made into the
effects of geometry on mechanical properties of the parts. In the present study, Laser
Sintered Nylon 12 parts with different section-thickness are subjected to
displacement-controlled tension-tension and force-controlled fully-reversed fatigue
loading to investigate the effect of geometry on their fatigue behaviour.
Section-thickness of the parts is shown to have no significant influence on the fatigue
behaviour under tension-only loading. However, fatigue life of parts under
fully-reversed loading is shown to increase with section thickness.
Keywords: Laser Sintering, Polymer, Additive Manufacturing, Fatigue, Cyclic
1.
Introduction
Additive Manufacturing (AM) technologies have long been renowned for producing
parts with poor and/or unrepeatable mechanical properties. As AM of end-use
components becomes increasingly viable, the ability to produce parts with repeatable
and predictable mechanical properties has become progressively more important.
Laser sintering (LS) is an AM process which generates complex 3D parts by sintering
powder particles in a layer by layer basis using a CO2 laser. Parts produced by LS
have been shown in several studies [1]–[4] to demonstrate mechanical properties that
are very close to the material properties obtained by conventional manufacturing
processes, like injection moulded plastic components.
Fatigue behaviour of polymer LS parts has been scarcely studied previously and no
fatigue information can be found in manufacturers’ data sheets. In a study by
Blattmeier et al [5] laser sintered specimens made of a polyamide powder (with 60%
used and 40% virgin powder) with treated (with surface finishing) and non-treated
surfaces were employed to examine surface influence on their fatigue behaviour in a
load increase method. Van Hooreweder et al [6] subjected Nylon 12 laser sintered
specimens to stress-controlled tension-compression fatigue loading with zero mean
stress to investigate their thermal and microstructural response. Amel et al. [7]
investigated fatigue behaviour of LS Nylon 12 parts subject to
displacement-controlled tension only fatigue loading. In a recent study, Van Hooreweder et al [8]
have explored the difference in fatigue behaviour of LS and injection moulded Nylon
Several factors, both internal and external, have been identified as parameters that
could influence cyclic performance and fatigue life of polymers[9]–[11]. Therefore,
any parameter that is considered likely to affect the internal structure of the polymer
parts might influence the cyclic performance as well. Also, Structural properties of
the polymers such as molecular weight and degree of crystallinity, are influenced by
the manufacturing process and parameters associated with it [12].
One of the distinctive advantages of LS is the freedom of design offered by this
technique, which enables optimisation and design options leading to creating parts
with complex geometries. However, very little investigation has been made into the
effects of geometry on the mechanical properties of the parts [13]. Datasheet values
reported by manufacturers for many commonly required properties are only for
standard specimen sizes. It has been suggested that properties of parts with varying
section-thicknesses might be different due to different thermal conditions they
experience during manufacturing, which may ultimately lead to different molecular
parameters.
The aim of the present study was to investigate the effect of section thickness on
fatigue performance of LS Nylon 12 parts subject to tension-tension and tension
compression cyclic loading.
2. Method and Materials
Three sets of tensile test specimens with section thicknesses of 2mm, 4mm and 6mm,
were designed. As different specimen thicknesses were chosen, standard specimen
geometries had to be altered so that the same geometry could be employed for both
analysis combined with machine loading capabilities resulted in the sample geometry
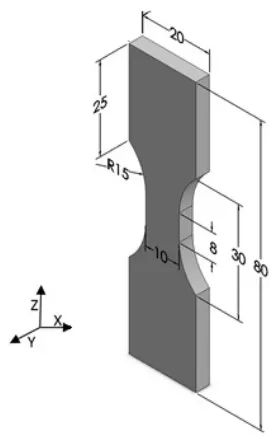
[image:5.595.220.355.134.352.2]shown in Figure 1.
Figure 1- Dimensions of the test specimens (all dimensions in mm)
All specimens were manufactured in “one-build” of a CO2-laser EOS P100 laser
sintering machine to eliminate the possible difference in build conditions of different
runs. Mixed EOS PA2200 (50% virgin, 50% used) as used by industry, otherwise
known as Nylon-12 was used to manufacture the parts. Parts were built along the (z)
direction with their long axis perpendicular to the build platform as shown in Figure
1, so that they would be loaded in their most critical direction and were all
manufactured in one horizontal plane. Standard machine parameters, as shown in
Table 1, were used for manufacturing of the parts.
Table 1- Standard machine parameters
Process Chamber Temperature 170°C
Laser Power 21W
Speed 2500mm/s
Layer Thickness 0.1mm
Physical properties of the samples were measured prior to testing. Samples were
weighed using a laboratory scale. Height, Width, and Cross sectional dimensions of
the gauge area of the samples were measured using Vernier Callipers. Surface
roughness of the samples was measured using a Surftest column type apparatus. A
measuring probe with radius of 1µm was used to scan a straight track of 30mm in the
longitudinal direction at 0.5mm/s and average surface roughness (Ra) was recorded.
Special care was taken to limit the measurement force.
All mechanical tests were performed using an MTS 858 Table Top System, capable
of applying both static and dynamic loads. Specimens were fixed in the machine
using wedge grips. 6 samples of each section thickness were employed for
tension-tension and 5 samples for tension-tension-compression tests. Tests were carried out at room
temperature (26°C). The surface temperature of the specimens was measured using a
Micro-epsilon ThermoIMAGER infrared camera.
2.1.
Tension-Tension Excitation
For tension-tension tests, displacement-controlled cyclic loading was applied to the
specimens; the maximum peaks of which were selected as 80% of deflection at break
for the parts (1.8mm) and the minimum peak was selected in order to avoid inducing
compression in the specimens (1mm), and the required force was recorded. The
frequency of loading was set as 2Hz to prevent hysteresis heating of the samples.
2.2.
Tension-Compression Excitation
For tension-compression tests, a force-controlled tension-compression cyclic load was
applied to the 4mm and 6mm samples at room temperature with a frequency of 2Hz.
because the drop in modulus caused by the rapid temperature rise reduced the critical
buckling load. Force-controlled loading was chosen as all parts buckled under
displacement-control. This load was applied in a fully reversed form (R=-1), so zero
mean stress was incurred. Samples were tested at two stress levels of 20MPa and
30MPa to provide a reasonable time to failure (Ultimate Tensile Strength of the
samples was measured as ~48MPa).
3.
Results and Discussion
3.1.
Tension-Tension Excitation
In order to investigate the effect of section thickness of the samples on their
tension-tension fatigue life, number of cycles to failure of each sample was plotted against
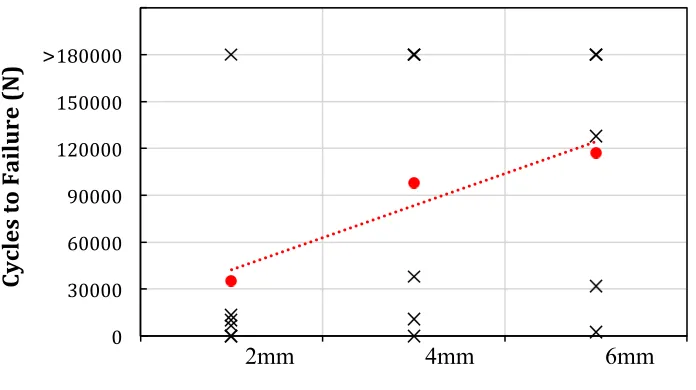
[image:7.595.123.471.440.635.2]their section thickness for the examined displacement level as shown in Figure 2.
Figure 2- Fatigue life of samples with different section thicknesses under displacement-controlled tension-tension loading (max displacement=1.8mm, amplitude=0.4mm)
In order to examine the statistical significance of the differences observed between
the three groups of section-thicknesses, non-parametric Kruskal-Wallis test was
0" 30000" 60000" 90000" 120000" 150000" 180000" 210000" Cy cl es' to 'F ai lu re '( N )' Section'Thickness' >"
performed on the obtained values of fatigue life in all the samples in SPSS,
considering the maximum life time of unbroken samples to be 180000. The result
suggests that the distribution of fatigue life data is the same across the three section
thicknesses. In other words no statistical significance exists between the fatigue lives
of different section thicknesses.
In a previous study by the authors [7], it was shown that applying the same test
conditions on specimens with the same section-thickness that were built with the
same machine parameters can result in very different values for fatigue life, which
shows the variable nature of this material under tension-tension cyclic loading.
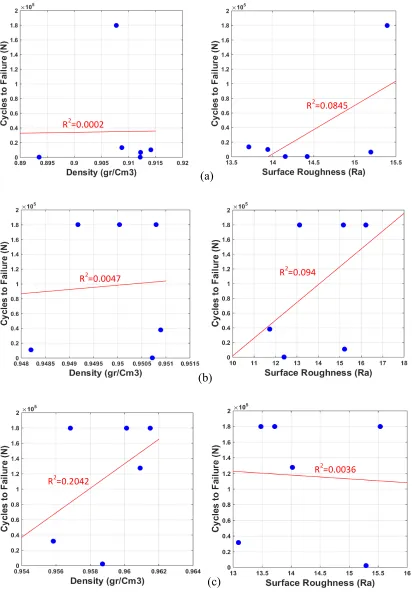
Fatigue life for all three section-thicknesses is plotted against density and surface
roughness in Figure 3 to investigate possible correlations. It should be noted that in
order to find a trend line for the results, the maximum fatigue life has been considered
as 180000 cycles. As can be observed from the graphs, most of the R-squared values
are smaller than 0.1, which confirms that fatigue life of 2mm and 4mm samples is
independent of their densities and surface roughness and fatigue life of 6mm samples
is independent of their surface roughness.
However, a closer fit seems to exist between fatigue life of the 6mm samples and their
densities. It can be presumed from the results that although fatigue life of samples
with different section thicknesses is not significantly different, its dependence leans
Figure 3-Density and surface roughness of a)2mm, b)4mm and c)6mm versus their fatigue
life
(a)
(b)
(c)
R2=0.2042' R
2=0.0036'
R2=0.0047 R2=0.094
R2=0.0845
3.2.
Tension-Compression Excitation
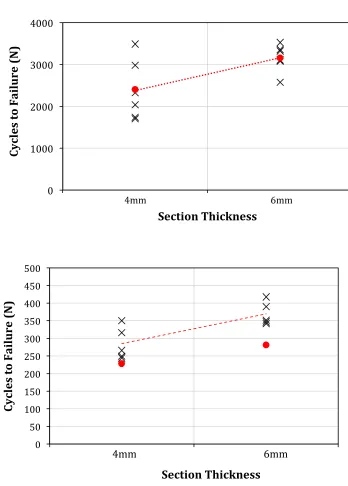
[image:10.595.118.466.220.706.2]Fatigue life of samples was also plotted for tension-compression tests, as shown in
Figure 4, to investigate the effect of section thickness of the samples on their fatigue
[image:10.595.127.474.241.439.2]life at the two examined stress levels.
Figure 4 - Number of cycles vs. section thickness for stress levels of 20 MPa and 30 MPa 0" 1000" 2000" 3000" 4000" Cy cl es' to 'F ai lu re '( N )' Section'Thickness'
4mm " ""6mm"
0" 50" 100" 150" 200" 250" 300" 350" 400" 450" 500" Cy cl es' to 'F ai lu re '( N )' Section'Thickness'
4mm " """"6mm
As can be observed from the figures, the number of cycles to failure of samples at the same stress level is in a similar range. However, it is clear that the number of cycles increases with section thickness in both stress levels.
Statistical analysis was performed on the results from both stress levels to evaluate the
significance in the difference between the results for each stress level. The results
from the Mann-Whitney U test revealed significant difference between fatigue life of
samples of the two groups of section thickness (4mm section thickness; U=6, p=0.032
and 6mm section thickness; U=2, p=0.028). This means that fatigue life of LS Nylon
12 samples under tension-compression loading increases with section-thickness.
3.3.
Hysteresis Loops
Hysteresis loops of the samples were produced for the both tension only and fully
reversed loading conditions to study the energy and stiffness changes in parts with
different section thicknesses.
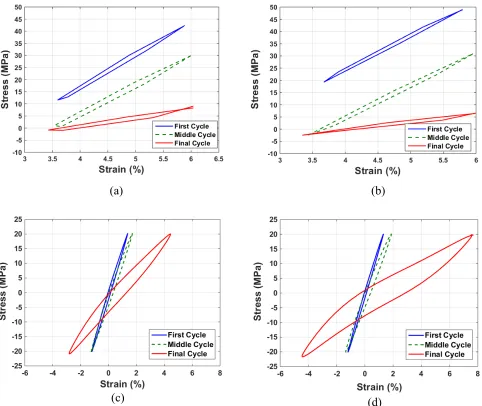
Figure 5 shows hysteresis loops of 4mm and 6mm samples under tension-tension and
tension-compression with maximum stress levels of 20MPa. Loops presented in these
figures only show the first, middle and final cycles of each sample. The first cycle is
the cycle after the sine-tapered period where the cyclic load grows to its peak values,
and final cycle is the cycle where load levels drop and failure begins.
No significant change in the area inside the hysteresis loops, which represents the
dissipated energy within the samples, can be observed in the tension only samples.
However, the amount of dissipated energy increases substantially towards the final
cycles within the tension-compression samples. The tension-compression hysteresis
graphs also show that while both samples have similar amounts of dissipated energy
The thicker sample shows a visibly larger amount of dissipated energy towards the
[image:12.595.75.557.158.564.2]final cycles.
Figure 5-Hysteresis loops for 4mm and 6mm samples subject to a,b) tension-tension and c,d)tension-compression with 20MPa stress level loading respectively
Apart from dissipated energy, the slope of the hysteresis loops shows the stiffness of
the material in each cycle. The slope of the loops in the tension only samples does not
change up to the final cycles, which indicates brittle fracture of the samples. This
shows that in specimens subject to tension-tension loading, failure of the specimen is
controlled by the tensile strength, therefore the failure can start anywhere in the cross
section. As a results section thickness of samples do not affect their fatigue life. (b)
(c) (d)
However, it is clearly visible that the slope of the hysteresis loops in both section
thicknesses of the tension-compression samples decreases as the number of cycles
increase, showing that the material is changing to a less stiff state. This can be
associated with the fact that the dissipated energy causes the sample to heat up. As the
temperature of the material increases to its glass transition region and possibly past
that, the amorphous polymer chains soften, leading to lower stiffness and larger
deformations at the same stress level.
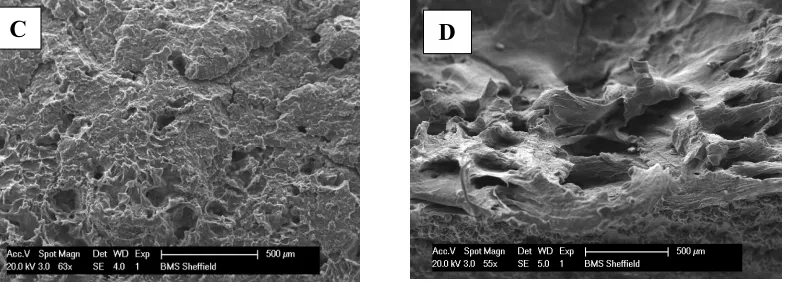
The difference in fracture behaviour of parts under tension and
tension-compression loading can also be observed in the images from the fracture surface of
broken samples in Figure 6. No sign of necking, which is a clear indication of ductile
fracture or deformation in the loading direction, can be seen on fracture surface of the
tension only sample (A and C). It is clear, however, that the tension-compression
sample have experienced a ductile fracture dominated by shear stresses. Signs of
plastic deformation and necking can be observed in images B and D.
Figure 6-Fracture surface of samples broken under A,C)tension-tension and B,D)tension-compression cyclic loading
3.4.
Thermal Analysis
As mentioned in section 2, surface temperature of the samples was measured during
testing using an infrared camera. While temperature of tension only samples stayed
stable throughout testing, temperature of the tension-compression samples increased
rapidly up to the point of their fracture. Figure 7 shows the thermal history of a
number of 4mm and 6mm samples subject to 20MPa and 30MPa stress level
tension-compression loading.
Figure 7-Thermal history of 4mm and 6mm samples under 20MPa and 30MPa stress levels
One of the inconsistencies observed in the results from the hysteresis loops and the
temperature histories of the samples, is that while the thicker samples were shown to
samples. This could be associated to that fact that in compression, failure is instigated
by buckling. Buckling load is proportional to the second moment of area (I) value,
meaning that the thinner specimens experience larger amounts of buckling compared
to the thicker ones which leads to faster increase in their surface temperature. Even a
small amount of buckling, which does not have to be particularly visible, will
generate additional strains causing the surface temperature to increase and the
material to soften. However, the thicker samples would have larger heat transferred to
their core at the failure point hence larger hysteresis loops, due to their longer fatigue
life.
It can also be observed that in all of the plots, temperature rises linearly at first, up to
around 35°C. After this temperature, thermal behaviour of the samples changes under
different stress levels, while it is similar for different section thicknesses with the
same stress level. Once the maximum temperature in a sample hits the Tg range
(~53°C), all samples in the same stress level fail within similar number of cycles. This
is more certain in the higher stress level.
The reason for this behaviour of the samples can be explained as follows. At the start
of testing, amorphous chain segments of the polymer are frozen in fixed positions
with their segments vibrating around these fixed positions. Thermal energy at this
temperature is not large enough to overcome the potential barriers for larger motions
of these segments of the polymer. As the temperature starts to increase, and reaches
the glass transition temperature, the amplitude of vibrational motion increases, and
eventually the thermal energy becomes large enough to overcome the potential energy
barriers to segment rotation and translation. This leads to softening of the amorphous
the sample under the same load. Larger deformations cause more friction between the
chains; therefore larger temperature rise in the sample. This phenomenon continues
and accelerates itself until rupture of the sample occurs.
Although samples showed different behaviours under different stress levels and
besides their different number of cycles to failure, it is clear from Figures 7 that all of
the samples have broken in the same temperature range. Thermal history plots in
these figures indicate that once the sample got to a temperature range of 120-125°C
all samples have failed no matter their size and stress level.
4.
Conclusion
In this study, laser sintered nylon 12 parts with different section-thicknesses were
subjected to tension-tension and tension-compression loading to investigate the effect
of section-thickness on their fatigue behaviour. Tension-tension tests were performed
as displacement controlled and tension-compression tests were performed as
force-controlled to avoid the buckling caused by cyclic creep of samples under
displacement-controlled loading.
It can be concluded from the results presented that section-thickness of the parts has
no apparent influence on their displacement-controlled tension-only fatigue life.
Although a slight increase was visible in their fatigue life with increase of section
thickness, statistical analysis showed that the amount of increase was negligible.
Results for parts subjected to force-controlled fully-reversed loading showed an
increase in their fatigue life with their section-thickness. The increase was also shown
of LS Nylon 12 parts subject to tension-compression loading increase with their
section-thickness.
It was concluded from the thermal history plots of the samples that in
tension-compression because of the small amount of buckling samples experience in each
cycle, their surface temperature increase. As thinner samples have larger buckling
under the same loading, a more rapid increase is visible in their surface temperature
and as they have a smaller fatigue life compared to thicker samples. It was also shown
that regardless of their thickness, parts experience brittle mechanical failure under
tension-only loading due to their UTS dominant behaviour and ductile thermal failure
under fully reversed loading due to their buckling-thermal dominant behaviour.
References
[1] B. Caulfield, P. E. McHugh, and S. Lohfeld, “Dependence of mechanical properties of polyamide components on build parameters in the SLS process,”
J. Mater. Process. Technol., vol. 182, no. 1–3, pp. 477–488, Feb. 2007.
[2] H. C. . Ho, I. Gibson, and W. . Cheung, “Effects of energy density on morphology and properties of selective laser sintered polycarbonate,” J. Mater. Process. Technol., vol. 89–90, pp. 204–210, May 1999.
[3] U. Ajoku, N. Hopkinson, and M. Caine, “Experimental measurement and finite element modelling of the compressive properties of laser sintered Nylon-12,”
Mater. Sci. Eng. A, vol. 428, no. 1–2, pp. 211–216, Jul. 2006.
mechanical properties of laser-sintered nylon,” Rapid Prototyp. J., vol. 17, no. 6, pp. 418–423, 2011.
[5] M. Blattmeier, G. Witt, J. Wortberg, J. Eggert, and J. Toepker, “Influence of surface characteristics on fatigue behaviour of laser sintered plastics,” Rapid Prototyp. J., vol. 18, no. 2, pp. 161–171, 2012.
[6] B. Van Hooreweder, F. De Coninck, D. Moens, R. Boonen, and P. Sas, “Microstructural characterization of SLS-PA12 specimens under dynamic tension/compression excitation,” Polym. Test., vol. 29, no. 3, pp. 319–326, May 2010.
[7] H. Amel, H. Moztarzadeh, J. Rongong, and N. Hopkinson, “Investigating the behavior of laser-sintered Nylon 12 parts subject to dynamic loading,” J. Mater. Res., vol. 29, no. 17, pp. 1852–1858, 2014.
[8] B. Van Hooreweder, D. Moens, R. Boonen, J.-P. Kruth, and P. Sas, “On the difference in material structure and fatigue properties of nylon specimens produced by injection molding and selective laser sintering,” Polym. Test., vol. 32, no. 5, pp. 972–981, Aug. 2013.
[9] J. a. Sauer, E. Foden, and D. R. Morrow, “Influence of molecular weight on fatigue behavior of polyethylene and polystyrene,” Polym. Eng. Sci., vol. 17, no. 4, pp. 246–250, 1977.
[10] J. Sauer and M. Hara, “Effect of molecular variables on crazing and fatigue of polymers,” Crazing Polym. Vol. 2, 1990.
[12] H. Zarringhalam, N. Hopkinson, N. F. Kamperman, and J. J. de Vlieger, “Effects of processing on microstructure and properties of SLS Nylon 12,”
Mater. Sci. Eng. A, vol. 435–436, pp. 172–180, Nov. 2006.