Original citation:
Perry, Amelia R., Peruffo, Massimo and Unwin, Patrick R.. (2013) Quantitative plane-resolved crystal growth and dissolution kinetics by coupling in situ optical microscopy and diffusion models : the case of salicylic acid in aqueous solution. Crystal Growth & Design, Volume 13 (Number 2). pp. 614-622. ISSN 1528-7483
Permanent WRAP url:
http://wrap.warwick.ac.uk/54300/
Copyright and reuse:
The Warwick Research Archive Portal (WRAP) makes the work of researchers of the University of Warwick available open access under the following conditions. Copyright © and all moral rights to the version of the paper presented here belong to the individual author(s) and/or other copyright owners. To the extent reasonable and practicable the material made available in WRAP has been checked for eligibility before being made available.
Copies of full items can be used for personal research or study, educational, or not-for-profit purposes without prior permission or charge. Provided that the authors, title and full bibliographic details are credited, a hyperlink and/or URL is given for the original metadata page and the content is not changed in any way.
Publisher’s statement:
This document is the unedited Author’s version of a Submitted Work that was
subsequently accepted for publication in Crystal Growth & Design, © American Chemical Society after peer review. To access the final edited and published work see
http://dx.doi.org/10.1021/cg301282q
A note on versions:
The version presented here may differ from the published version or, version of record, if you wish to cite this item you are advised to consult the publisher’s version. Please see the ‘permanent WRAP url’ above for details on accessing the published version and note that access may require a subscription.
Quantitative Plane-Resolved Crystal Growth and
Dissolution Kinetics by Coupling
In Situ
Optical
Microscopy and Diffusion Models: the Case of
Salicylic Acid in Aqueous Solution
Amelia R. Perry, Massimo Peruffo, and Patrick R. Unwin
∗Department of Chemistry, University of Warwick, Gibbet Hill Road, Coventry, CV4 7AL, UK
E-mail: [email protected]
Abstract
The growth and dissolution kinetics of salicylic acid crystals are investigatedin situby
fo-cusing on individual microscale crystals. From a combination of optical microscopy and finite
element method (FEM) modeling, it was possible to obtain a detailed quantitative picture of
dissolution and growth dynamics for individual crystal faces. The approach uses real-timein
situgrowth and dissolution data (crystal size and shape as a function of time) to parameterize
a FEM model incorporating surface kinetics and bulk to surface diffusion, from which
concen-tration distributions and fluxes are obtained directly. It was found that the (001) face showed
strong mass transport (diffusion) controlled behavior with an average surface concentration
close to the solubility value during growth and dissolution over a wide range of bulk saturation
levels. The (¯110) and (110) faces exhibited mixed mass transport/surface controlled behavior,
but with a strong diffusive component. As crystals became relatively large, they tended to
ex-hibit peculiar hollow structures in the end (001) face, observed by interferometry and optical
microscopy. Such features have been reported in a number of crystals but there has not been a
satisfactory explanation for their origin. The mass transport simulations indicate that there is
a large difference in flux across the crystal surface, with high values at the edge of the (001)
face compared to the center, and this flux has to be redistributed across the (001) surface. As
the crystal grows, the redistribution process evidently can not be maintained so that the edges
grow at the expense of the center, ultimately creating high index internal structures. At later
times, we postulate that these high energy faces - starved of material from solution - dissolve
Introduction
There is currently much interest in crystal growth and dissolution of both inorganic1,2and organic
crystals.3–5 Organic crystals are of particular interest in the pharmaceutical and food industries,
where crystal structure, morphology and size impacts on usage. The study herein concerns
sal-icylic acid (2-hydroxybenzoic acid or o-hydroxybenzoic acid), which has been used throughout
history as a painkiller and anti-inflammatory, originally extracted from willow bark.6,7 In modern
medicine it is much more commonly seen in its esterified form, aspirin, although salicylic acid
itself is used to treat various skin ailments. Despite these important uses, the crystallization and
dissolution kinetics of salicylic acid have not been investigated extensively. The investigations we
report herein are aimed at providing considerable new information on the growth and dissolution
of individual crystals of salicylic acid at a level where the behavior of each exposed crystal face
can be determined. Furthermore, the methodology described should be of widespread utility and
general interest.
A range of imaging methods have been proposed to address crystal growth and dissolution
at the level of an individual crystal face.8 Phase shift interferometry (PSI),9,10 atomic force
mi-croscopy (AFM)11–13 and confocal microscopy14 have all been used to investigate the kinetics
of crystal growth.15 However, for salicylic acid, only dissolution kinetics have been investigated
usingin situ AFM.16–18 In water, the (110) and (¯110) faces were studied16 and dissolution rates
determined.
The most common type of investigation of crystal growth and dissolution involves batch
stir-ring systems where bulk rates are measured over time.19–21 While such systems provide some
insights into crystal growth kinetics, data are averaged over a range of different crystal sizes, and
exposed crystal faces. Furthermore, although mass transport correlations are available for such
suspensions,24 they are rather crude which makes it difficult to precisely separate mass transport
and surface kinetic effects. Salicylic acid crystal growth has been studied and modeled using such
approaches.20–23 Blandin et al.20 proposed that the growth of salicylic acid crystals is diffusion
The mechanism of crystal growth and dissolution can be understood in terms of two processes:
the diffusion of species between the bulk solution and the surface of the crystal; and movement
of species at the crystal surface including surface diffusion, integration, and the adsorption and
desorption of crystal growth units. Herein, the situation where the former process is slow compared
to any surface phenomena is described as mass transport (diffusion) controlled, whereas a surface
kinetic limitation is described as surface controlled.
Quantitative methods which examine micro-crystals are valuable because of the many and
var-ied applications of crystals on this scale, as highlighted briefly above. Furthermore, as we show
herein, micro-crystals are easier to fully characterize (i.e. to determine the reactivity of
individ-ual exposed crystal planes). Moreover, if isolated, micro-crystals are subject to a well-defined
mass transport (diffusion) regime, as exemplified by electrochemical studies of
ultramicroelec-trodes (UMEs).25,26 Put simply, just as reducing the size of a voltammetric/amperometric UME
enhances the diffusion rate (magnitude proportional to the inverse of the characteristic electrode
dimension25), so does shrinking the size of an isolated crystal. Thus, as we show in this paper,
one can promote well-defined (and high) diffusion rates by studying microscale crystals. This
en-hances the opportunity to observe the influence of surface kinetics in heterogeneous
physicochem-ical processes. Herein, we visualize the growth and dissolution of micro-crystalsin situand use the
experimental data obtained as parameters for a finite element model that then reveals the kinetic
regime. The importance of diffusion compared to surface reactions in determining the reactivity
is revealed, and the approach allows concentration distributions around growing and dissolving
crystals to be predicted.
A further consideration in the growth and dissolution of salicylic acid is polymorphism.27–29
Nordströmet al.30 have shown that for salicylic acid crystals formed from aqueous solution, there
is only one polymorph, but that the crystals often produced ‘peculiar, hollow tubes with square
cross sectional areas’ as well as simple needle structures. Blandin et al.20 describe the crystals
as ‘prismatic needle or rod shaped’. Xu et al.31 have described four different morphologies of
There is a fairly limited body of work on hollow crystals32,33 and the mechanism of their
formation has not clearly been established, although it has been postulated that the presence of
hollow features is due to dislocations.34 In the present study, hollow features in salicylic acid
crystals were sometimes observed, and the mass transport simulations that are an integral part of
our studies provide key insights into the conditions under which hollow features appear. Trapped
bubbles which result may be a concern for producing crystalline drug forms, and studies such as
those described herein could be used to set conditions under which these undesirable features could
be avoided.
Experimental
Solutions and Samples All solutions were prepared using ultrapure water (Milli-Q Reagent,
Millipore) with a typical resistivity of 18.2 MΩcm at 25◦C.
Seed micro-crystals were produced on 47 mm diameter circular glass microscope slides (Thermo
Scientific), that had been cleaned with acetone (Sigma,>99.5%) and then blown dry using
nitro-gen gas (BOC). They were then assembled into petri dishes (Willco Wells) equipped with a perspex
rim and lid. The surface of the slides was functionalized with a thin film of poly-L-lysine (PLL)
which provided a surface for the nucleation of well-defined micro-crystals. The PLL film was
prepared using 1 mg ml−1 PLL (Sigma) solution that was pipetted into the petri dishes to cover
the slide and left to develop for 30 minutes. The slides were then washed with ultrapure water and
blown dry using nitrogen.
Micro-crystals were produced using 3 ml each of 37.5 mM sodium salicylate (Sigma,>99.5%)
and 90 mM sulfuric acid (Sigma,>95%) pipetted into the PLL-functionalized petri dishes, mixed
and left stationary for 45 minutes in order to nucleate micro-crystals on the surface. The petri dish
containing the micro-crystals was rinsed with water and dried using nitrogen.
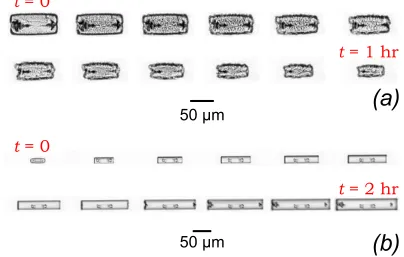
This method successfully produced a surface with crystals with a typical largest dimension of
the glass surface, as shown in Figure 1. The salicylic acid crystals had a tabular morphology, as
shown. The unit cell, as described by Cochran,35 and further refined by Sundarlinghamet al.36 is
monoclinic, but almost tabular.
Crystal Growth Investigations 3 ml of sodium salicylate (of a defined concentration in the
range 14-30 mM) and 3 ml of 60 mM ‘sulphuric acid were pipetted and mixed in a petri dish
containing the micro-crystals. A 40×dipping lens on a Leica DM4000 M compound microscope
was lowered into the solution and a suitably isolated micro-crystal was located such that the nearest
crystal on the surface of the slide was at a distance of at least 30× the largest dimension of the
crystal. The lateral resolution was ca. 0.5 µm. This ensured that the micro-crystal investigated
was essentially diffusionally isolated for the purpose of crystal growth rate analysis.
A time sequence of images was taken for a particular crystal, typically every 30 s for a duration
of one to two hours. Examples of time sequences for dissolution and growth are shown in Figure 2,
which highlight how the crystal dimensions change over time. From the time lapse sequence, the
expansion or contraction of the (001) and (110) faces of the crystal (see Figure 1) were measured
directly with the aid of ImageJ (Version 1.45, NIH).
Simulations and Modeling
Salicylic acid solution in the presence of the solid (crystal) phase is characterized mainly by the
following equilibria:
Sal−(aq)+H+(aq)
kf
* )
kb
HSal(aq) (1)
HSal(aq)*)HSal(s) (2)
where Sal−represents the salicylate ion and HSal is salicylic acid.
version 4.6), which also allowed the ionic strength and pH of the solution to be calculated. The
program uses the Davies equation37 to estimate activity coefficients. The temperature was set to
the experimental value of 22◦C. The pKaof salicylic acid was taken from literature as 2.98.38
Finite element modeling was performed using Comsol Multiphysics 4.2a (Comsol AB,
Swe-den) using a Dell Intel core 7i Quad 2.93 GHz computer equipped with 16 GB of RAM running
Windows 7 Professional ×64 bit. The basic geometry for the model is shown in Figure 3.
Sim-ulations were carried out with > 12,000 tetrahedral mesh elements. The mesh resolution was
defined to be finest near the surface of the crystal (close to boundaries 1, 2 and 3). Simulations of
varying mesh density were performed to ensure that a fine enough mesh was used for the model
calculations reported herein. Boundaries 4 and 5 are planes of symmetry, as defined earlier.
The three inter-dependent species Sal−, H+ and HSal (Equation 1) were considered in the
model. For the experimental length scale, mass transport is predominantly controlled by diffusion,
for which the following equation was solved:
Dj∇2cj+Rj=0 (3)
whereDjis the diffusion coefficient,cjis the concentration and jis the species of interest. Rjis
a kinetic term representing the the loss and/or formation of species jaccording to Equation 1 which
is always at equilibrium. The diffusion coefficients of the individual species can be considered
to be constant over the spatial domain investigated: DSal− = DHSal=8.4×10⁻¹⁰ m2 s−1 39 and
DH+=7.6×10⁻⁹m2s−1.40
The boundary conditions applied to the model can be understood with reference to Figure 3.
Boundaries labeled 1, 2 and 3, representing the growing or dissolving crystal faces, had
experimen-tally determined fluxes of salicylic acid imposed. Thus, the equations satisfied on these boundaries
are as follows:
boundary 2:n.(DHSal∇cHSal) =−J(¯110) (5)
boundary 3:n.(DHSal∇cHSal) =−J(110) (6)
where J(001), J(¯110) and J(110) define the flux of HSal incorporated into the (001), (¯110) and
(110) face, respectively, and n is the inward unit vector normal to the boundary. Note that we
only needed to consider HSal and not the individual ions at the boundary itself because a rapid
equilibrium between H+, Sal− and HSal is reasonably assumed (on the timescale of the diffusion
process). For computational efficiency we made use of symmetry planes denoted by boundaries 4
and 5, which have no-flux boundary conditions, so that just one quarter of a crystal is simulated.
Boundary 6 is constrained by a no-flux condition, to represent the unreactive glass slide on which
the crystal grows. Hence:
boundary 4-6:n.(Dj∇cj) =0 (7)
Boundaries 7-9 are set by a bulk concentration condition, because they are a considerable
distance away from the crystal to be considered as bulk solution (typically at least 40 times the
largest dimension of the crystal in the simulation). We may reasonably write:
boundary 7-9:cj=cbulk,j (8)
where cbulk,j is the bulk concentration of j=Sal−, HSal and H+. The pH values calculated
from MINEQL+, which were consistent with those measured experimentally, were used to
cal-culatecbulk,HSal. The concentration of the protonated and unprotonated salicylate were calculated
from the acid dissociation constantKa(see above; corrected for ionic strength) and the total
con-centration of the two species HSaltot (known from the dissolved quantity of sodium salicylate).
the ratio fixed by the acid dissociation constant:
Ka=
kf
kb (9)
and rate constants sufficiently high to maintain equilibrium at all points in solution.
Results and discussion
Characterization of Salicylic Acid Micro-crystals The orientation of crystals, typically
represented by that in Figure 1, was determined by powder X-ray diffraction (XRD, not reported),
to elucidate that the (110) face of the micro-crystal was usually parallel with the glass surface. The
other two faces were determined from this result, guided by literature,17,18 and the known crystal
structure.35,36
The 2-dimensionalin situdata from optical microscopy, which determined growth/dissolution
of the (001) and (¯110) faces, were combined with information from vertical scanning
interferome-try (VSI) to determine the height, in order to provide 3-D growth rates of crystals, needed for FEM
simulations. For this purpose, samples were produced as described previously and then sputtered
with a layer of gold of approximately 10 nm. Interferometry images were obtained for a range
of crystals with dimensions of 50-250 µm. It was deduced that the height, h, of the crystals was
related to the width,w, byh=0.76(+−0.3)w.
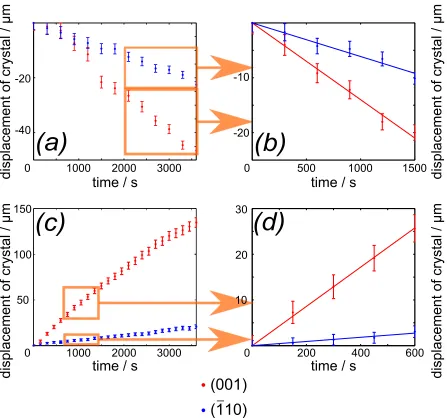
Determination ofIn SituCrystal Growth Rates and Interfacial Concentrations Plots of
the displacement of the (001) and (¯110) faces over time were produced from in situoptical
mi-croscopy for crystal growth and dissolution. Typical example plots in Figure 4 show the expected
features of a shrinking crystal for dissolution and expanding planes for crystal growth. It is evident
that the (001) plane is much more active than the (¯110) face for both dissolution and growth. It
is also clear from the long time plots (4a and c) that although the growth and dissolution rate of
where the apparent growth rate evidently decreases at longer times for growth (corresponding to
increased crystal size) and increases at longer times for dissolution (decreased crystal size). This
can be attributed to the influence of mass transport, because diffusion rates alter as the
micro-crystal dimension changes with time. In brief, diffusion rates to micro-scale interfaces scale with
the inverse of the characteristic dimension.25 This effect does not seem to be as evident in the
growth and dissolution behavior of the (¯110) face.
For quantitative analysis, we focused on growth over relatively short times (as indicated, for
example, to the right of Figure 4). For shorter periods of time, where the overall crystal dimensions
change less, a close to linear relationship between crystal dimensions and time is evident. A static
FEM model, relevant to the crystal size for the time period of interest, could be used to analyze
mass transport and crystal reactivity, because the characteristic diffusion time of the experimental
micro-crystal system was much faster than that for changes in crystal dimensions by growth and
dissolution. This resulted in considerable computational efficiency compared to an equivalent
time-dependent moving boundary model.
The fluxJ(xyz)of salicylic acid was determined for each face(xyz)of the crystal from:
J(xyz)=v(xyz)ρHSal (10)
where v(xyz) is the experimentally determined growth or dissolution velocity of face (xyz)
and ρHSal is the molar volume of salicylic acid, calculated from the density of salicylic acid
(1.443 g cm3 41).
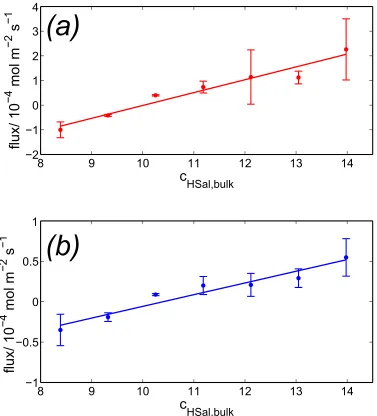
Figure 5 shows the relationship between flux into or out of the two characteristic crystal faces
as a function of the bulk solution concentration. The saturation ratio of the solution is given by:
S= cbulk,HSal
c∗bulk,HSal (11)
wherec∗bulk,HSal is the concentration in bulk when there is neither dissolution or growth. This
meaning that crystal growth occurs, and whenS<1 the crystal will dissolve. In equilibrium, the
bulk solution concentration (of fully protonated salicylic acid) atS=1 are as follows for the (001)
face and the (¯110) faces,c∗(001),bulk,HSalandc∗
(¯110),bulk,HSal, respectively:
c∗(001),bulk,HSal=10.0+−0.5 mM (12)
c∗(¯110),
bulk,HSal=10.3
+
−0.6 mM (13)
We notice that these values are similar, but slightly lower than the solubility of salicylic acid
previously reported in literature. Nordströmet al.30 found that the solubility of salicylic acid was
11.6 mM at 20◦C in water. Comptonet al.17report a solubility of 14.9 mM for total salicylic acid
and salicylate, which is equal to a value of 11.2 mM for just the salicylic acid species.
It is important to comment on the noticeable range in measured flux at each bulk concentration
in Figure 5. This is largely due to the range of crystal sizes studied and the fact that the crystals
grow and dissolve with a significant contribution of diffusion, which then has a major influence
on the flux. Thus, while the composite plot in Figure 5 identifies general trends, the growth and
dissolution behavior of individual crystals was examined to extract kinetics using FEM simulations
to mimic the precise crystal dimensions.
Typical example outputs of the FEM simulations for dissolution and growth are shown in
Fig-ure 6. For the case of growth the bulk concentration was 11.2 mM and for dissolution it was
8.4 mM and the crystal dimensions are indicated in the caption. During dissolution (Figure 6a)
the salicylic acid concentration close to the crystal surface is higher than in the bulk solution, and
there is evidently a concentration boundary layer (or diffusion layer) from the crystal to the bulk.
This is particularly pronounced for the (001) face.
For the case of growth (Figure 6b), the simulations show broadly similar trends for the
con-centration on the faces, but with the crystal acting as a sink for salicylic acid. The concon-centration
from the crystal to the bulk is less pronounced.
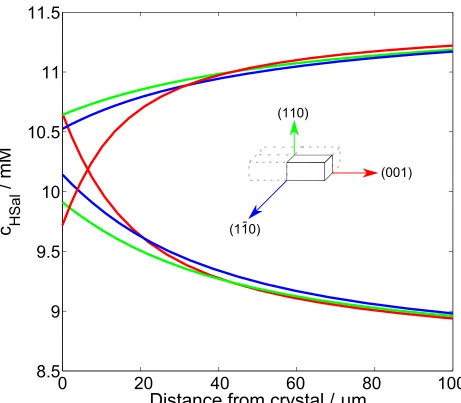
Figure 7 shows the concentration profiles perpendicular to the center of the three crystal faces,
for the cases of dissolution and growth shown in figure 6. This clearly shows that the crystal faces
act as sinks and sources of salicylic acid to different degrees. Close to the crystal the gradient is
steeper for the (001) surface (for dissolution and growth), as expected based on the optical
mi-croscopy data. The difference between the surface concentrations of salicylic acid on the (110)
and (¯110) faces for dissolution and growth indicates that although there is a significant mass
trans-port component during dissolution and growth of these faces, there is some surface kinetic control.
For the (001) face the surface concentrations are closer to those for a purely transport-controlled
system. In fact, these surface concentrations cross over so that the value for growth is lower than
for dissolution. This is not expected to be a real effect, but rather associated with the difficulty of
precisely determining crystal dimensions and particularly measuring the morphology of dissolving
crystals due to pitting. The fuzzy crystal outlines (see Figure 2a, for example) introduced a small
systematic error defining the crystal surface, which tended to cause a slight underestimation of the
crystal dimensions.
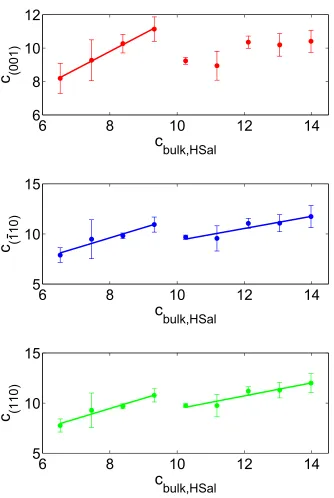
For the (001) face in the growth regime (cbulk,HSal>10 mM), the concentration does not change
appreciably with bulk concentration, and attains values close to the saturated value. This indicates
clearly that growth of this face is dominated by diffusion. In contrast, the (¯110) and (110) faces both
show a small, systematic increase in the surface concentration with increased bulk concentration.
However, concentration values are much lower than the bulk concentration, indicative of small,
but detectable, contribution of surface kinetics to the overall rate, consistent with the arguments
presented above. In the dissolution regime, all faces appear to show a small amount of surface
kinetic control, but there is still a strong diffusion component. We note that there is a perhaps a
slight overestimate of the dissolution rate, reflected in higher surface concentrations, due to pitting
of the crystal during dissolution, which makes it difficult to define the crystal size, as discussed
above in relation to Figure 2a. However, this does not prevent us from semiquantitavely identifying
As highlighted earlier, there has been little investigation into the growth and dissolution of
salicylic acid, but it is informative to compare our results to prior work, where quantitative
com-parisons can be made. Compton et al.16,17 investigated the dissolution kinetics of large, exposed
(110) and (¯110) faces of salicylic acid (typically 3×3×30 mm), using a hydrodynamic AFM flow
cell to measure the dissolution rate. For the (¯110) face with bulk concentrations of total dissolved
salicylic acid of 0 mM, 3 mM and 10 mM they concluded that the dissolution process was
surface-controlled with a surface flux of the order 10−5mol cm−2s−1,16 while we observed for the same
faces a dominant mass transport component with comparable or higher fluxes for similar
satura-tion levels. They measured the overall retreat of the surfaces as small changes in the mean height;
such measurements are extremely sensitive to drift of the piezoelectric controller,42 and requires
very careful surface control if the accuracy of AFM dissolution studies is to be compromised.43
Moreover, in Figure 10,17 the data for 7 mM and water could arguably just as easily be linearly
fitted to the mass transport rate. We also note that a significant dissolution rate was reported for a
saturated solution in these studies, whereas no net dissolution would be expected.
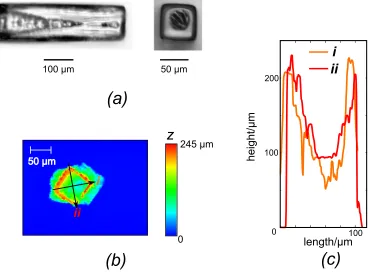
Hollow Features in Crystals When larger dimensions (50-100 µm width) were achieved,
the crystals were often found to exhibit hollow features in the (001) face. Example bright field
microscopy images of such crystals are illustrated in Figure 9a. Confirmation of holes in the crystal
was achieved by VSI measurements, such as the data shown in Figure 9b and c. It is evident that
the hollow features extend in these cases about 100µm into the body of the crystals.
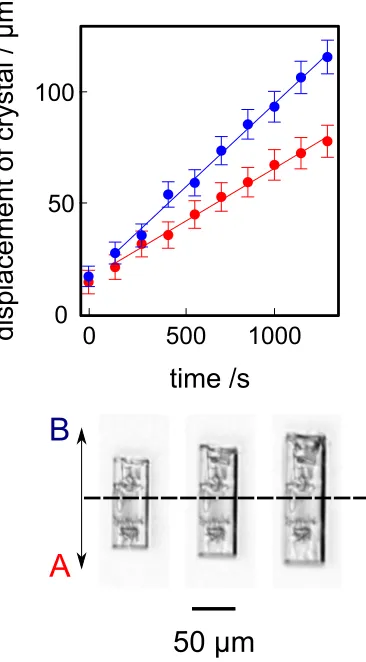
We can explain and rationalize the formation of these hollow features in terms of mass transport
control which dominates the large micro-crystals (vide supra). Figure 10 compares the growth of
the two (001) end planes of salicylic acid micro-crystals, labeled A and B (below the plot), with
respect to a common reference plane shown by the dashed line across the center of the crystal
images. In the B direction, considerable hollow features are observed in the crystal during the time
period shown, whereas in the A direction, the (001) face is flat and does not appear to show any of
rates observed in the A and B directions. The crystal grows more quickly in the B direction with
an average growth rate of 0.075(+−0.006) µm s−1 compared to 0.047(+−0.006) µm s−1 in the A
direction. This is because the active area at the end of the B face is smaller and so recieves a high
diffusive flux of material.
We see from simulations (e.g. Figure 6b) that during growth on the (001) face, the flux is
higher at the edge of the face (steeper concentration gradient) than in the center of the face. In
contrast, growth of the (110) and (¯110) faces is under mixed diffusion/surface kinetic control. This
picture of mass transport is shown schematically in Figure 11a. Because the (001) face is flat, but
grows at a diffusion limited rate, the near interface concentration of salicylic acid has to be at the
saturated level and to maintain a uniform growth rate of the surface, material has to be redistributed
across the face (e.g. by surface diffusion). The larger the crystal, the greater the distance which the
material has to diffuse from the edge to the center, and it is evident that a point is reached where
this cannot be sustained so that HSal is incorporated at the edges faster than at the center. At this
stage (Figure 11b) the edges of the (001) face start to grow preferentially, depleting material and
slowing growth at the center. Moreover, the availability of HSal in solution at the edges compared
to the center causes the edge to overgrow (Figure 11c). This process continues for a significant
time, but an interesting aspect is that the hollows eventually close over. We postulate that the inner
leading edge created inside the hollow feature (Figure 11d) would be expected to be of higher
energy (higher solubility) and as this region is recessed it is starved of growth material. Thus,
the leading edge could start to dissolve, with diffusion from the inner leading edge toward the
edges, therefore closing the hollow. Interestingly, and supporting this hypothesis, the higher mass
transport on the edges of the (001) face leads to a slightly convex morphology during dissolution
(Figure 2a).
In previous literature, hollow features have been observed when crystals are produced by vapor
deposition,32 but little work on hollow crystals in solution has been carried to date. There has
been some attempt at explaining the emergence of this phenomenon. It has been suggested that
being responsible for a pyramidal hollow like those observed in the present study for salicylic acid
crystals.44,45The that data from FEM simulations show that the characteristic patterns of diffusive
mass transport also appear to play a role in the emergence, growth and closure of hollow features.
Conclusions
This study has shown that time lapse optical microscopy combined with FEM modeling is an
effective approach for probing micro-crystal growth and dissolution kinetics. In particular,
us-ing data from optical microscopy to parameterize a FEM model of a growus-ing/dissolvus-ing crystal
reveals direct information about concentration distribution around a crystal and the interfacial
con-centrations. This, in turn, allows the importance of diffusion compared to surface kinetics to be
elucidated for each crystal face. For salicylic acid, the (001) face has been shown to be dominated
by mass transport for both dissolution and growth, whereas the (110) and (¯110) faces show more
surface kinetic control, although diffusion remains a significant component of the overall kinetics.
Knowledge of the importance of mass transport for this system has allowed a convincing
ex-planation for the presence of hollow features seen when the crystals become large. These features
are a direct consequence of differential flux across the (001) face with the edges experiencing a
much higher diffusive flux than the center position. Ultimately this leads to preferred growth at
the edges compared to the center, causing the formation of a hollow feature in this face.
Interest-ingly, as time proceeds, these features become enclosed, with a roof structure. This suggests that
the internal walls of the hollow feature (high index faces) become shielded from the growth flux
that they dissolve so that the feature becomes enclosed. Hollow features have been seen in other
micro-crystal systems and differential diffusive fluxes appear to provide a satisfactory analysis of
Acknowledgement
We thank the European Research Council (ERC-2009-AdG247143-QUANTIF) for support of M.
P. and P. R. U.; A. R. P. was supported by the UK Engineering and Physical Sciences Research
Council.
References
(1) Gower, L. B.Chem. Rev.2008,108, 4551-4627
(2) De Yoreo, J. J.; Vekilov, P. G.Rev. Min. Geochem.2003, 54, 57-93
(3) Shekunov, B.Y.; York, P.J. Pharm. Sci.2000, 211, 122-136
(4) Shekunov, B. Y.; Chattopadhyay, P.; Tong, H. H. Y.; Chow, A. H. L.Pharm. Res.200724,
203-227
(5) Chen, J.; Sarma, B.; Evans, J. M. B.; Myerson, A. S.Cryst. Growth Des.201111, 887-895
(6) Chrubasik, S.; Eisenberg, E.; Balan, E.; Weinberger, T.; Luzzati, R.; Conradt, C.Am. Journ.
of Med.2000, 109, 9-14
(7) Chrubasik, S.; Künzel, O.; Black, A.; Conradt, C.; Kerschbaumer, F.Phytomed.2001, 8,
241-251
(8) Unwin, P. R.; Macpherson, J. V.Chem. Soc. Rev.1995, 24, 109-119
(9) Onuma, K.; Kameyama, T.; Tsukamoto, K.Cryst. Growth1994, 137, 610-622
(10) Vekilov, P. G.; Kuznetsov, Y. G.; Chernov, A. A.Cryst. Growth1992, 121, 643-655
(11) Danesh, A.; Connell, S. D.; Davies, M. C.; Roberts, C. J.; Tendler, S. J. B.; Williams, P. M.;
Wilkins, M. J.Pharm. Res.2001, 18, 3, 299-303
(12) Dobson, P. S.; Bindley, L. A.; Macpherson, J. V.; Unwin, P. R.Langmuir2005, 21,
(13) Vavouraki, A. I.; Putnis, C. V.; Koutsoukos, P. G.Cryst. Growth Des.2010, 10, 1, 60-69
(14) Shenoy, D. B.; Sukhorukov, G. B.Euro. Pharma. Biopharma2004, 58, 521-527
(15) Van Driessche, A. E. S.; Otalora, F.; Sazaki, G.; Sleutel, M.; Tsukamoto, K.; Gavira, J. A.
Cryst. Growth Des.2008, 8, 12, 4316-4323
(16) Coles, B. A.; Compton, R. G.; Suárez, M.; Booth, J.; Hong, Q.; Sanders, G. H. W.Langmuir
1998, 14, 218-225
(17) Wilkins, S. J.; Coles, B. A.; Compton, R. G.; Cowley, A.J. Phys. Chem. B2002, 106,
4763-4774
(18) Wilkins, S. J.; Suárez, M. F.; Hong, Q.; Coles, B. A.; Compton, R. G.; Tranter, G. E.;
Firmin, D.;J. Phys. Chem. B2000, 104, 1539-1545
(19) De Anda, J. C.; Wang, X. Z.; Roberts, K. J.Chem. Eng. Sci.2005, 60, 1053-1065
(20) Blandin, A. F.; Mangin, D.; Nallet, V.; Klein, J. P.; Bossoutrot, J. M.Chem. Eng. Journ.
2001, 81, 91-100
(21) Nallet, V.; Mangin, D.; Klein, J. P.Chem. Eng.1998, 22, 649-652
(22) Franck, R.; David, R.; Villermaux, J.; Klein, J. P.Chem. Eng. Sci.1988, 43, 1, 69-77
(23) Tavare, N. S.; Gaikar, V. G.Ind. Eng. Chem. Res.1991, 30, 722-728
(24) Briançon, S.; Colson, D.; Klein, J. P.Chem. Eng.1998, 70, 55-64
(25) Bard, A. J.; Faulkner, L. RElectrochemical Methods, Fundamentals and ApplicationsJohn
Wiley & Sons, New York2001
(26) Subero-Couroyer, C.; Mangin, D.; Rivoire, A.; Blandin, A. F.; Klein, J. P.Powder Tech.
(28) Land, T. A.; Martin, T. L.; Potapenko, S.; Tayhas Plamore, G.; De Yoreo, J. J.Nature1999,
399, 442-445
(29) Mukata, T.; Lee, A. Y.; Kawakami, T.; Myerson, A. S.Cryst. Growth Des.2005, 5, 4,
1429-1436
(30) Nordström, F. L.; Rasmuson, A. C.J. Chem. Eng. Data2006, 51, 1668-1671
(31) Xu, Y.; Yin, H.; Lu, Y.; Yin, S.; Wu, H.; Jiang, T.; Wada, Y.Mat. Let.2006, 60, 2873-2876
(32) Simov, S.Journ. Mat. Sci.1976, 11, 2319-2332
(33) Natarajan, V.; Subramanian, C.; Ramasamy, P.Journ. Mat. Sci. Letters1988, 7, 511-512
(34) Chandrasekharaiah, M. N.; Krishna, P.J. Cryst. Growth1969, 5, 213-215
(35) Cochran, W.Acta Cryst.1953, 6, 260-268
(36) Sundarlingham, M.; Jensen, L. H.Acta Cryst.1965, 18, 1053-1058
(37) Davies, C.W.Ion AssociationLondon, Butterworths.1962, 3753.
(38) Christensen, J. C.; Hansen, A. N. D.; Izatt, R. M.titleWiley-Interscience, New York1976
(39) Polakovic, M.; Gorner, T.; Villiéras, F.; de Donato, P.; Bersillon, J. L.Langmuir2005, 21, 7,
2988-2996
(40) Compton, R. G.; Unwin, P. R.Phil. Trans. R. Soc. Lond.1990, A330, 1-45.
(41) Lide, D.R.CRC Handbook of Chemistry and Physics 86thEd., CRC Press,2005-2006,
3-288
(42) Kim, J.; Shen, M.; Nioradze, N.; Amemiya, S.Anal. Chem.2012, 84, 3489-3492
(43) Clifford, C. A.; Seah, M. P.Meas. Sci. Technol.2009, 20
glass
surface
(110)
(110)
(001)
50 μm
(110)
(001)
[image:21.612.72.544.219.522.2](110)
50 μm
50 μm
(a)
(b)
t
= 0
t
= 0
t
= 1 hr
[image:22.612.104.508.244.501.2]t
= 2 hr
[001]
[110] [110] 3
4
5
9
l
w h
7
6 8
[image:23.612.85.529.231.467.2]2 1
(001)
di
spl
ace
m
en
t of
cr
ystal
/
μm
time / s
time / s
time / s
time / s
0 0
10 20 30
200 400 600
0 500 1000 1500
-20 -10
1000 2000 3000 -20
-40
0 1000 2000 3000
50 100 150
(110)
di
spl
ace
m
en
t of
cr
ystal
/
μm
d
isp
la
cem
e
nt
of crystal / μm
[image:24.612.84.531.129.547.2]di
spl
ace
m
en
t of
cr
ystal
/
μm
(a)
(d)
(c)
(b)
Figure 4: Plots showing the change in size of the two crystals in Figure 2 over time. Dissolution of a salicylic acid crystal (top) with average dimensions 56.5×23µm in a solution of sodium
sali-cylate concentration 8.4 mM. Growth of a salicylic acid crystal (bottom) with average dimensions 166.5×32 µm in a solution of salicylic acid concentration 13.0 mM. The plots on the left hand
(a)
(b)
8 9 10 11 12 13 14
−2 −1 0 1 2 3
c
HSal,bulkflux/ 10
−4mol m
−2s
−18 9 10 11 12 13 14
[image:25.612.120.497.73.489.2]−1 −0.5 0 0.5
c
HSal,bulkflux/ 10
−4mol m
−2s
−1 1 4Figure 5: Plots showing how the flux per unit area into the crystal faces varies for change in bulk concentration. Data for the (001) face (a) and the (¯110) face (b).
(001) (11 0) (11 0)
(b)
Co
nce
ntr
atio
n/m
M
9.8 10 10.2 10.4 10.6 10.8 11 11.2 11.4 (001) (11 0) (11 0)(a)
Co
nce
ntr
atio
n/m
M
9.5 10 10.5 9Figure 6: Examples of results of FEM simulations for dissolution in a bulk solution of 8.4 mM HSal with a crystal of largest dimension 39µm (a) and growth in a bulk solution of 11.2 mM with
[image:25.612.89.534.545.666.2](001)
(110)
(110)
0
20
40
60
80
8.5
9
9.5
10
10.5
11
11.5
Distance from crystal / µm
c
HSal
/ mM
[image:26.612.75.536.161.564.2]100
6
8
10
12
14
6
8
10
12
c
bulk,HSalc
(001)6
8
10
12
14
5
10
15
c
bulk,HSalc
(110)
6
8
10
12
14
5
10
15
c
bulk,HSal [image:27.612.141.475.103.601.2]c
(110)100 μm
(a)
(c)
(b)
z
245 μm
0
50 μm
i
ii
length/µm
heig
ht/
µ
m
100 200
0 100
50 μm
i
ii
[image:28.612.126.495.221.493.2]500 1000
B
50 1000
time /s
50 μm
A
0