http://wrap.warwick.ac.uk/
Original citation:
P. García-Plaza, Alberto, Zubiaga, Arkaitz, Fresno, Víctor and Martínez, Raquel. (2012)
Reorganizing clouds : a study on tag clustering and evaluation. Expert Systems with
Applications, Volume 39 (Number 10). pp. 9483-9493.
Permanent WRAP url:
http://wrap.warwick.ac.uk/66854
Copyright and reuse:
The Warwick Research Archive Portal (WRAP) makes this work of researchers of the
University of Warwick available open access under the following conditions. Copyright ©
and all moral rights to the version of the paper presented here belong to the individual
author(s) and/or other copyright owners. To the extent reasonable and practicable the
material made available in WRAP has been checked for eligibility before being made
available.
Copies of full items can be used for personal research or study, educational, or
not-for-profit purposes without prior permission or charge. Provided that the authors, title and
full bibliographic details are credited, a hyperlink and/or URL is given for the original
metadata page and the content is not changed in any way.
Publisher statement:
“NOTICE: this is the author’s version of a work that was accepted for publication in
Expert Systems with Applications. Changes resulting from the publishing process, such
as peer review, editing, corrections, structural formatting, and other quality control
mechanisms may not be reflected in this document. Changes may have been made to
this work since it was submitted for publication. A definitive version was subsequently
published in Expert Systems with Applications, Volume 39 (Number 10). pp. 9483-9493.
http://dx.doi.org/10.1016/j.eswa.2012.02.108
A note on versions:
The version presented here may differ from the published version or, version of record, if
you wish to cite this item you are advised to consult the publisher’s version. Please see
the ‘permanent WRAP url’ above for details on accessing the published version and note
that access may require a subscription.
Reorganizing Clouds: a Study on Tag Clustering and Evaluation
Alberto P. Garc´ıa-Plazaa,∗, Arkaitz Zubiagab, V´ıctor Fresnoa, Raquel Mart´ıneza
aNLP&IR Group
UNED Madrid, Spain
bQueens College&Graduate Center
City University of New York New York, NY, USA
Abstract
Finding and visualizing semantic relations among tags within a tag cloud enhances user experience, particularly regarding access to and retrieval of web pages on social tagging systems. Several approaches have been proposed to visualize tag relations in these systems. However, results of previous research rely on qualitative evaluation methods, and do not provide robust and sound comparison criteria. In order to allow quantitative evaluation we present a benchmark social tagging dataset, where a subset of 140 tags from a well-known social bookmarking site,Delicious, have been manually categorized according to the Open Directory Project (ODP). The manual categorization is utilized as a ground truth that enables quantitative evaluation providing a way of inferring the best of different clustering approaches. With this dataset we also explore different tag representation approaches to present a reorganized tag cloud by using Self Organizing Maps. In addition, we present an approach to enrich the resultant tag cloud with the most characteristic terms for each tag and group of tags, making possible a further filtered navigation, both by tag and document content, and easing a deeper qualitative evaluation of the clusters.
Keywords: social tagging, folksonomies, clustering, som, resource, evaluation
1. Introduction
Social bookmarking is an application of social media that has succeeded as a means to ease information search and sharing. Social bookmarking sites allow users to collaboratively annotate with tags the web pages they like. Thanks to this collaborative philosophy, vast amounts of tags provided by large communities of users are aggregated on web pages, producing enormous collections of annotations that have shown to be helpful for improving information management tasks (Heymann et al., 2008; Zheng and Li, 2011; Sun et al., 2011).
Different from classical taxonomies, where there are predefined categories, tags from social bookmarking systems rely on an uncontrolled vocabulary, producing a tag set that is not finite. The great flexibility offered by this feature also makes information organization and access more challenging for the research community. In these systems, the tag set annotated on a web page becomes more and more representative as the number of annotations grows (Zubiaga et al., 2009b). In addition, while an information need can be defined as a query in an information retrieval approach, on social bookmarking sites the information need is a tag provided by users to obtain an ordered list of resources related to that tag. After this, the systems provide a list of related tags, allowing to navigate through the collection. But this is not the only way to access to information in these systems.
In order to enable visual browsing, social bookmarking systems typically provide an interface model known as tag cloud. These clouds are one of the main ways of browsing and discovering web documents on social bookmarking systems, as a structure that provides a visual summary of the most popular topics in the collection. Tag clouds
∗Corresponding author, tel.+34 91 398 79 57, fax+34 91 398 65 35
Email addresses:[email protected](Alberto P. Garc´ıa-Plaza),[email protected](Arkaitz Zubiaga),
comprise between 50 and 200 of the most popular tags on the site, where the more popular is a tag, the bigger is its font size. Sometimes, tags are sorted alphabetically, randomly, or using other non-semantic orderings. Therefore, an open issue is to identify inter-related tags within tag clouds and relations among their contents in order to enhance the browsing phase in social tagging systems. This is one of the main aims of this paper.
Recent research has focused on getting further organizations of tags in a tag cloud by considering semantic re-lations among tags. In this work, we focus on the semantic reorganization of a tag cloud based on the identification of groups of inter-related tags by using clustering techniques. Despite the increasing interest on the task, no effort has been invested on comparing the performance of different tag representations, and the analysis and evaluation of experiments has limited to qualitative criteria.
As far as we know, there is not a Gold Standard to evaluate semantic tag clustering, and the datasets used in the evaluation of different approaches differ from each other. Even though some of them become from the same social tagging system, the crawling criteria (time frame, size, etc.) and subsequent filtering or reduction criteria (frequency, unification of morphological variations, number of tagging users, etc.) vary. In this paper, we present a benchmark collection for a quantitative tag clustering evaluation in social bookmarking sites. We have manually grouped this tagged document collection, enabling the external evaluation and comparison of different tag clustering approaches, and it is available for the research community.
Moreover, we propose the enrichment of our grouped tag cloud with lists of the most relevant terms associated both to individual tags and to tag groups, so that it makes easier to establish and analyze semantic relations among tags and their associated web pages content. Relevant terms are extracted by means of language modeling techniques applied to document contents. Thus, the enhanced tag cloud turns into a richer one that provides a more versatile way to visualize and navigate through tags and terms. So, the aim of this enhanced tag cloud is to improve information access in social tagging sites in a wide sense.
Besides, the proposed tag cloud enrichment methodology allows us to carry out a qualitative analysis of the coherence between tags and their associated textual content. It also allows social tagging sites to suggest related tags, as well as to improve tasks like feed subscription services for tag sets, among others.
The remainder of this document is organized as follows. Next, in Section 2 we provide background related to social bookmarking systems. In Section 3 we summarize and contextualize the earlier research in the field. We continue with the description and analysis of the social tagging dataset, as well as presenting the process to create the ground truth for evaluation in Section 4. We present the different approaches for the reorganization of a tag cloud in Section 5, and continue by describing the quantitative evaluation measures, and presenting and analyzing the results in Section 6. We show an additional qualitative evaluation that relies on underlying terminology in Section 7. We conclude the paper in Section 8.
2. Social Bookmarking
In social bookmarking, tagging is an open way to assign tags to web pages in order to facilitate future retrieval. In practice, users annotating a resource tend to provide different tags from each other, so that aggregating their annota-tions makes the result even more representative. For instance, a user could tag this paper associal-tagging,clustering,
evaluationanddeliciouswhereas another user could usepaper,researchandtaggingtags to annotate it. As a result
of a community annotating web pages, the whole set of tags used in the site creates a tag-based organization, so-called folksonomy. A folksonomy is also known as a community-based taxonomy, where the classification scheme is non-hierarchical, and the vocabulary of tags is open insofar as users can freely define their own tags.
On social bookmarking systems, there is a set of users (U), who are posting bookmarks (B) for resources (R) annotated by tags (T). Each user ui ∈ U can post a bookmarkbi j ∈ B of a resourcerj ∈ Rwith a set of tags
Ti j ={t1, ...,tp}, with a variable numberpof tags. Afterkusers postedrj, it is described with a weighted set of tags
Tj ={w1t1, ...,wntn}, wherew1, ...,wn ≤krepresent the number of assignments of a specific tag. Accordingly, each
bookmark is a triple of a user, a resource, and a set of tags: bi j : ui×rj×Ti j. Thus, each user saves bookmarks
of different resources, and a resource has bookmarks made by different users. The result of aggregating tags within bookmarks by a user is known as the personomy of the user:Ti={wi1ti1, ...,wimtim}, wheremis the number of different
The nature of social bookmarking sites offers multiple positive aspects, like for instance: (i) since different users tag the same resource, a weighted list of tags can be inferred by general consent, and (ii) the openness of the vocabulary allows users to create non-existing tags that emerge with current affairs or personal needs.
On the other hand, however, the openness of the vocabulary presents several issues, such as: (i) different tags can be synonymous or related (e.g.,photoandphotography), (ii) tags with different levels of specificity can be hy-pernyms/hyponyms (e.g.,programmingandjava), (iii) tags can also be polysemous (e.g.,library, which could mean both a place containing books and a collection of sub-programs), and (iv) the purpose of a tag can be any of a factual tag (e.g.,design), a subjective tag (e.g.,interesting), or a personal tag (e.g., toread) (Sen et al., 2006). The issues arose from the open vocabulary of social bookmarking systems makes the management of tags more challenging, reinforcing the need of an approach to better handle tags.
Even though this work does not deal specifically with the above issues, the analysis of the experiments provides further insight on why and when they happen.
3. Related Work
With the emergence and popularity of social tagging systems, there has been an increasing interest in discovering semantic relations among social tags (Garcia-Silva et al., 2011), arising different approaches.
Recently, Dattolo et al. (2011) present an approach for detecting groups of similar tags and relationships among them. The authors apply clustering processes to find different categories of related tags, presenting three ways of cal-culating tag weights within a graph: intersection (co-occurrence between tags), Jaccard (normalized co-occurrences), and a more complex approach that considers additional distributional measures of tags in a vector space represen-tation. They only perform a qualitative evaluation over a reduced set of top 20 tags, a group of tags known to be ambiguous, and a set of subjective tags. Their results show that using a normalized co-occurrence weighted (Jaccard) returns much better results than intersection (absolute co-occurrences): tags which are less popular but still shared within sub-communities tend to be ranked higher exposing the vocabularies typical of their domains of interest.
In Vandic et al. (2011), the authors propose a method to improve search on social tagging systems by clustering syntactic variations of tags with the same meaning. They use the cosine similarity based on co-occurrence vectors for measuring semantic relatedness. Their syntactic clustering approach has a lower error rate than an earlier approach introduced by Specia and Motta (2007), by using a combination of shallow pre-processing strategies and statistical techniques together with knowledge provided by ontologies available on the semantic web. More specifically, other authors have shown their concern about improving the navigation through tag clouds. Deutsch et al. (2011) propose clustering tags in a tag cloud to help enhance user experience. They present a study on the strengths and weaknesses of using tag clouds in common Web-based contexts. They also analyze different methods for semantic clustering to visualize tag clouds, but they do not provide any comparative evaluation among them. Venetis et al. (2011) present an analysis of algorithms to select the tags that will be shown in the tag cloud. They evaluate tag clouds produced by different algorithms by assuming an ideal user model. However, they do not present any clustering approach that shows related tags nearby.
Regarding tag representation approaches, many of the works consider co-occurrences among tags, whereas a few rely on the textual content of the tagged documents.
Tag co-occurrence has been also used to generate subtrees of related tags. In Schmitz (2006), the author proposes a subsumption based model derived from the co-occurrence of tags by inducing faceted ontology from Flickr.com tag usage. In this case, tag co-occurrence model is used to define when tag X potentially subsumes tag Y. In Wu et al. (2006), the authors use information from the co-occurrence of tags, resources and users in a probabilistic generative model to automatically derive the emergent semantic of tags. They define a multidimensional conceptual space, where each dimension represents a special category of knowledge included in social annotation data. Such conceptual space helps disambiguate tags, and it groups synonymous tags together in concepts. They use this model in a semantic search and discovery system. Mika (2007) discovers sets of clusters of semantically related tags using co-occurrence information. In his Concept-Instance graph links between tags are weighted by the number of instances that are tagged with both tags. He uses a tripartite graph model involving users (actors), tags (concepts) and resources (instances of
concepts or objects) and builds graphs relating both tags with users and tags with resources. Then, he applies network
analysis techniques to discover sets of tag clusters. In Specia and Motta (2007), the clustering process is based on the similarity among tags given by their co-occurrence, where a tag is represented using the intersection with each other tag in the whole tag set. In this work, the authors envisaged tag space enrichment with semantic relations by exploring online ontologies. The work of Angeletou et al. (2007) is based on Specia and Motta (2007), and also rely on online ontologies to obtain semantic enrichment of folksonomy tags, taking as input clusters of implicitly related tags.
Textual content has also been considered to represent and find inter-related tags. In Brooks and Montanez (2006) the authors analyzed document similarity based on weighted word frequency using the TF-IDF term weighting func-tion. They grouped documents sharing tags into clusters, and then compared the similarity of all documents within a cluster, by means of the average pairwise cosine similarity and an agglomerative algorithm. In Zubiaga et al. (2009a) we present a methodology to obtain and visualize a cloud of related tags based on the use of Self-Organizing Maps, where relations among tags are established taking into account the textual content of the tagged documents. Although the resultant tag cloud was promising, we did not compare the content based representation with other co-occurrence based representations, and no quantitative evaluation was done. These issues are treated in present work.
Regarding tag visualization, the most common ways of creating visually oriented representations of tagging data consist in using tags as search facets and tag clouds. Visualization is often an important way to elucidate semantic heterogeneity in information space navigations. The lack of meaningful spatial interpretations in tag clouds has already been addressed by several authors. For instance, in Hassan-Montero and Herrero-Solana (2006) a bisecting K-Means algorithm is used to organize similar tags close to each other. An alternative solution is to add interactivity to tag clouds, e.g., when hovering over a tag will highlight similar tags from the rest to support understanding of associations between different tags.
In this context, in addition to other clustering algorithms, Self-Organizing Maps have been used to cluster related tags. An advantage of SOMs over other methods is that the clustering step itself produces a graphical map of the folksonomy. Other visualization approaches like graph-based clustering methods, such as that by Simpson (2008), have also been used to produce a visual graph of tags, but these graphs are often more complex, with many edges, and require more expensive layout algorithms. The visualization capabilities of SOMs provide an intuitive way of representing the distribution of data as well as the object similarities. In Sbodio and Simpson (2009) tags are clustered by means of a SOM, using a tag representation based on co-occurrence among tags. Once the map is trained, the authors use it to classify new tagged documents, but no quantitative evaluation is carried out.
Risi et al. (2008) use a SOM and U-Map techniques to visualize and cluster tagged music data from Last.fm1. This work relies on tagging patterns to discover relations among them, e.g., they group tags containing the string ’rock’. A similar work is presented by Chen et al. (2009). Both of them calculate semantic similarities between tags by means of co-occurrences and other measures like the TF-IDF weighting function, euclidean distance and cosine similarity. Nonetheless, their approaches are not automated but manual, and they manually define similar words to be clustered, so their systems do not allow to easily update the clustered tag cloud. Other works that use Self Organizing Maps to find related tags are Li and Zhu (2008) and Gabrielsson and Gabrielsson (2006).
Regarding evaluation processes, Markines et al. (2009) relied on Wordnet as the semantic grounding to compute tag similarity measures. In particular they rank tag pairs by their Jiang-Conrath distance Jiang and Conrath (1997), which combines taxonomic and information-theoretic knowledge. However, the authors themselves showed a limited
coverage of Wordnet on Bibsonomy, with an overlap of about 29% of the tags. Likewise, Cattuto et al. (2008) showed a limited coverage of about 61% by Wordnet on tags from Delicious. Different from Markines et al. (2009), our benchmark presents a categorization of all the tags in the tag cloud, considering also tags that have no entry in Wordnet.
Our work is the first to present and analyze a quantitative evaluation method that allows further comparison of different clustering and tag representation approaches. We introduce a benchmark social tagging dataset along with a manual classification of the top tags, and apply external evaluation measures to a set of experiments on the dataset. We also perform a qualitative evaluation of our results relying on language models techniques to extract terminology associated to each tag and group of tags. These techniques not only allow a deeper and thorougher analysis of the resulting cloud, but also provide useful information to extend user possibilities to access the information represented by the cloud.
4. The DeliciousT140 Dataset
Evaluating tag clustering is an open problem because there is no benchmark dataset with an ideal solution to com-pare with the clustering system answer. This work provides a benchmark dataset, allowing its use as Gold Standard in tag clustering tasks. Along with the documents and tagging data, we present a manual tag classification, where each tag was classified in a taxonomy with 24 categories. While other works evaluate results in a qualitative manner, the proposed benchmark also enables to perform a quantitative evaluation.
4.1. Collecting Annotated Web Pages
We collected a set of web documents with their corresponding tag annotations from Delicious during June 2008. We started from the 140 most popular tags of the site, that is, the whole tag cloud (in the following T140). Then, we monitored new posts for each tag in T140, obtaining 379,931 unique URLs. Relying on this list of URLs, we queried Delicious for getting the number of users who posted each URL, as well as their weighted lists of top tags. Thus, each URL is attached to an amountkof annotators, and a list of weighted tagsT ={w1t1, ...,wntn}, wherenis at most 25,
limited by the social bookmarking site at the time of the dataset generation. Along with the social tags from Delicious, we crawled all those URLs to get their HTML content.
Once we downloaded the content and tagging data, we filtered the collection to the English-written documents. This led to 144,574 documents, with 67,104 different tags annotated. This dataset is available2as a benchmark for tag clustering evaluation.
4.2. Creating a Benchmark for Tag Cloud Clustering
In order to perform the manual grouping, we relied on the Open Directory Project3(ODP) as a well-known and consolidated taxonomy. Two assessors independently grouped the tags in T140 according to their relatedness to one of the categories of ODP. The manual grouping was carried out in a procedure of two iterations. In the first iteration, the top level categories of ODP were taken into account. Each of the two assessors manually assigned one of the 16 top level categories of ODP to each tag in T140 following these steps: (1) they entered each tag as a term query in the search box on ODP; (2) if the assessor agreed with the first level category with the most matches for the tag, then the tag was assigned to that category; otherwise, the assessor suggested another category of the same level for the tag; (3) after both assessors annotated the 140 tags, they met, discussed their decisions, and finally produced a single manual grouping of the tags.
The assessors utilized 12 of the top level categories, and also added a miscellanea category,Others, resulting:Arts,
Business,Computers,Games,Health,Home,Science,News,Recreation,Reference,Society,Shopping, andOthers.
The result of this manual grouping showed an imbalancement of theComputerscategory as compared to the rest, since
Computerscontained 64 of the 140 tags. This fact clearly showed the bias of the collection towards computational
topics. This was the main reason why the assessors decided to use subcategories in the second level instead of the
2http://nlp.uned.es/social-tagging/delicioust140/
3http://www.dmoz.org/- The ODP is a human-edited directory of web pages, constructed and maintained by a global community of volunteer
Category Tags
Arts (17) architecture art au culture design english fic illustration inspiration movies photo photography photos portfolio tv typography writing Business (11) advertising business economics fashion finance jobs marketing productivity resources socialmedia work
Operating linux ubuntu windows osx
Systems (4)
Multimedia (8) audio video videos images mp3 music youtube flickr
Programming (16) ajax .net css database java javascript jquery language library php programming python rails ruby tool tools Internet blog blogging blogs email firefox flash flex google internet socialnetworking twitter web web2.0 webdesign webdev wiki
(22) collaboration development search seo wordpress online Graphics (4) 3d graphics photoshop visualization
Systems (4) apple computer iphone mac
Software (7) download free freeware howto software tutorial tutorials
Hardware (1) hardware
Mobile Computing (1) mobile
Open Source (1) opensource
Performance performance
and Capacity (1)
Security (1) security
Games (2) game games
Health (1) health
Home (8) cooking diy food home lifehacks recipe recipes tips
News (4) article articles media news
Recreation (4) fun funny humor travel
Reference (7) book books education learning reference research teaching Science (5) environment math science technology tech
Shopping (2) shop shopping
Society (5) community green history politics social
[image:7.595.68.529.110.345.2]Others (4) 2008 cool toread interesting
Table 1: Final manual categorization of the 140 tags
Computerstop level category. Thus, in the second iteration of the manual grouping,Computerswas divided into finer
granularity categories. The procedure followed by the assessors in order to assign a computer subcategory to a tag was the same as in the first iteration.
Some tags were grouped in a different category to that with the highest number of matches in ODP. For instance, the tagproductivity, according to ODP would belong toComputers, whereas the assessors agreed in that it should belong toBusinesscategory. Another example is the tagpolitics, which had the most matches in theRegionalODP category, and the assessors finally decided to group it inSociety. This happened with 19 tags: .net,2008,article,
articles,book, books, cool, environment, design, diy, food, green, images, politics, productivity, social, teaching,
visualization, andwork. In addition, to take into account the computer topics bias of the collection the following
changes of assignments were made:library,toolandtoolstags were considered of theProgrammingcategory;audio,
music,videoandvideoswere moved toMultimediacategory; andtechwas moved toSciencecategory. Table 1 shows
final grouping made up by 24 different categories.
Notice that most of the times the assessors agreed about the most frequent category proposed by ODP. Therefore, we think this manual categorization provide, in general, a good benchmark when the tags are monosemous or when they are used with its more frequent meaning. However, when tags are polysemous and are used with a specific domain meaning, this manual categorization could lead a good grouping to count like a mistake.
5. Tag Cloud Reorganization
In this Section, we describe the tag representation approaches we study in the experiments and the Self-Organizing Map we use as a clustering algorithm.
5.1. Tag Representation
explicit way (co-occurrence based) and the other in an implicit way (content based), since the content of a document can take part in the representation of more than one tag we take into account co-occurrence information in an implicit way.
In this paper, we tried these two approaches described above to represent tags in order to reorganize a tag cloud: representation by tag co-occurrence, and by textual document content. In both cases we use the Vector Space Model (VSM). Our study compares these two approaches using our benchmark to evaluate tag clustering results.
5.1.1. Representation by Tag Co-occurrence
User posts present interesting features to represent tags. When a user tags a document, the implicit semantics of the tag is assigned to document content. Since we considered only popular tags (only the 140 tags in the tag cloud are taken into account) we can expect the user posts converged, and these tags will fit the documents they represent quite well. So, we are taking into account information provided by user classification, in such a way that we could say we are building a tag representation based on human knowledge. Moreover, this classification was performed by a large number of users. Therefore, if we find two highly posted tags labeling the same document, we can assume the document content is related to both of them. Thus, if this tag co-occurrence is found in several documents, being the number of documents large enough to be representative in our dataset, we can conclude that a relation between those tags exists, due to the fact that system users posted the same documents with both of them. From this assumption we formulate our main hypothesis for co-occurrence based tag representation: the greater the number of documents
tagged by the same tags, the greater the similarity among these tags is.
Based on these ideas, we propose four different tag weighting functions. In addition to tag co-occurrences, another variable in our scheme that should be pointed out is user post count. We used it to choose relevant tags in order to be sure about tag convergence. For each tag we build a vector representing its degree of co-occurrence with every tag within T140. Therefore, we obtained 140 vectors with 140 dimensions each, one per tag. Hence, each vector component corresponds to a different T140 tag, and the value set for this component, hereafter tag weight, measures the degree of co-occurrence between the tag corresponding to that component and the tag represented by the vector. Equation 1 shows how a tag vector is organized:
T agi=(Wtagi,tag1, . . . ,Wtagi,tagj, . . . ,Wtagi,tag140)∀tagi∈T140 (1)
beingT agithe vector representation of tagi, andWtagi,tagjthe weight between tagiand tagj.
Thus, the tag vectors corresponding to the whole collection (140 vectors) make up the following matrix:
Wtag1,tag1 Wtag1,tag2 . . . Wtag1,tag140
Wtag2,tag1 Wtag2,tag2 . . . Wtag2,tag140
... ... ... ...
Wtag140,tag1 Wtag140,tag2 . . . Wtag140,tag140
(2)
So far, we have defined the vector space used to represent tags. We have also talked about the weighting functions used to build the vectors and the main ideas we took into account to choose them. Now, we will define in detail each of the weighting functions. We consider three main features to be combined with “the number of documents tagged with both tags”: (i) the minimum document frequency between tags, (ii) the maximum tag document frequency between tags, and (iii) the number of documents tagged with at least one of the tags. We combine these 3 weights to define 4 different weighting functions:
• Document frequency of the intersection of two tags(Equation 3): the absolute number of documents in the dataset tagged with both tags.
In this case, we make use directly of the main hypothesis previously formulated. This function is not normalized to the dataset dimension and so, its values will not be relative but absolute within the dataset.
• Document frequency of the intersection of two tags over document frequency of the union of those tags
(Equation 4): this function represents the Jaccard similarity coefficient. If two tags have a high Jaccard score, then they almost always occur in the dataset as a pair, and one will almost never occur in the absence of the other. This function also assumes the main hypothesis, but in this case, the values are scaled-down by the number of documents tagged with one of the tags.
Wtagunioni,tagj = d f(tagi∩tagj) d f(tagi∪tagj)
(4)
The Jaccard similarity coefficient has been assumed by several tag clustering studies like Simpson (2008) and Sbodio and Simpson (2009), reason why we consider this tag weighting function within our baseline. However, its appropriateness as compared to other measures has not yet been shown. In this work, we also aim to show whether or not Jaccard is suitable for the task.
• Document frequency of the intersection of two tags over the minimum tag document frequency between them(Equation 5): in this case we adjust the value using the minimum tag document frequency of both tags in the dataset, in such a way that the greater the number of documents tagged with the least common tag in connection with the intersection value, the lower the weight is. This function also assumes the previous hypothesis, but in this case, the values are scaled-down by the number of documents tagged with the least common tag.
Wtagmini,tagj =
d f(tagi∩tagj)
minnd f(tagi),d f(tagj)
o (5)
• Document frequency of the intersection of two tags over the maximum tag document frequency between them(Equation 6): the weight is adjusted with the maximum tag document frequency of both tags in the dataset. In this weighting function we assume again the initial hypothesis, but unlike the preceding one, the values are scaled-down by the number of documents tagged with the most common tag.
Wtagmaxi,tagj = d f(tagi∩tagj) maxnd f(tagi),d f(tagj)
o (6)
We would also like to remark that each of the four resulting matrices follows one of the four approaches to calculate weights between tags and represents the whole tag set. Conceptually, the degree of co-occurrence between two tags should grow as the weight does.
5.1.2. Representation by Document Content
In order to represent a tag by content, we consider the documents that were annotated with that tag. Specifically, we limit to the textual content. Since each tag has many documents annotated, we merged the textual content of all those underlying documents. This approach was first introduced in Zubiaga et al. (2009a).
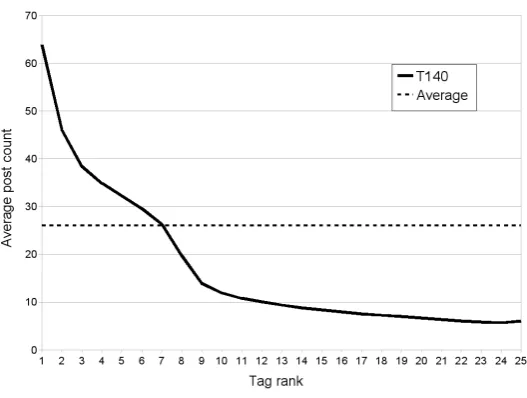
However, we thought we should not include all the tags in the same way in the document representation, as some of them may be hardly important because they have lower post count, and because of the associated computational cost. In order to decide which tags to consider relevant for a document, we needed to set a threshold; in this manner, only tags with a higher post count than the threshold were selected. We considered the average post count (26) extrapolating the average in the collection to each and every single document like our threshold (see Figure 1). Hence, working only with the top ranked tags could be more precise in order to discover document content semantics and to find relations among the tags in T140 set.
Figure 1: X axis represents the rank of a tag in the top list of tags of the annotated resources, whereas Y axis represents the average post count for
each of the positions in the ranking. Note that the tag ranked first could be different from resource to resource. The dashed line means the average
post count for every tag positions from first to 25th. In consequence, only the tags with a higher post count than the average (above dashed line) were selected in representations by document content.
The next step is to represent each super-document into the vector space model. First, we removed HTML tags to extract the plain text. After that, we removed the most common stopwords, using an English stoplist, and accomplished a stemming phase with the algorithm by Porter (1980). After applying theTF-IDFterm weighting function to find the significance of a feature (word) in tag representation (being the IDF factorlogd fN(t), whereNis the collection size andd f(t) is the document frequency of a tagt), a dimensionality reduction stage was carried out to reduce the number of features per vector: we removed the terms with high (0.6) and low (0.02) document frequency values (Dittenbach et al. (2000)).
The final result of this process was composed by 140 term vectors, corresponding to each of the T140 tags; the vector dimension was 17,518.
5.2. The Self-Organizing Map (SOM)
As a state-of-the-art clustering algorithm, we use Self-Organizing Maps (SOM) (Kohonen, 1990, 2001) in this work. SOM has proven to be a effective way not only to organize information, but also to visualize it, and even to allow content addressable searches (Vesanto and Alhoniemi, 2000; Dittenbach et al., 2000; Russell et al., 2002; Perelomov et al., 2002; Roh et al., 2003; Jieh-Haur and Chen, 2012; Barr´on-Adame et al., 2012).
Kohonen’s Self-Organizing Maps are unsupervised neural network architectures that use competitive learning in order to produce a spatial-topological relationship between the reference vectors of each neuron in a Vector Space Model (VSM); after a training process, and depending on high dimensional input vectors. The neurons are arranged as a regular node grid, usually with 2 dimensions. Thus, after the training phase, similar inputs to the map will produce nearby outputs into the node grid.
The SOM size was set to 12x12, in order to obtain a square map with a number of neurons close to the number of tags (144 neurons, and 140 tags). In this way, we have at least one neuron per tag. We do not want to force tag grouping due to map size, that is, if the number of tags is greater than the number of neurons, then multiple tags must share the same neuron because there is no space enough to allocate them in separate ones. As far as the lattice is concerned, we chose the rectangular one.
distance between input vectors and their associated reference vectors in the map. Other issues about the SOM are the same as in the standard implementation SOMlib4Dittenbach et al. (2000).
6. Quantitative Evaluation
This section presents the evaluation method we used during the experimentation process, and show the results of such experiments.
6.1. External Evaluation Measures
There are a number of external evaluation measures to carry out a quantitative evaluation and determine the quality of a clustering solution. These measures allow us to compare the reference solution with an algorithmic approach. Let the classes be the reference solution, and let the clusters be the output of the clustering algorithms. The main differences among the external evaluation measures are the properties they satisfy. In Meila (2003) they study twelve mathematical constrains in a specific metric. In Amig´o et al. (2009) the authors compare five families of metrics according to four constraints. In the present work we have considered these 4 constraints in order to select the final evaluation measures:
• Cluster homogeneity. Two sets of documents belonging to two different classes should be separated into two different clusters.
• Cluster completeness.Documents of the same class should be in the same cluster.
• Rag bag. Introducing disorder into a disordered cluster is less harmful than introducing disorder into a clean cluster.
• Clusters size vs. quantity.A small error in a big cluster would be preferable to a large number of small errors in small clusters.
The BCubed metrics, BCubedPrecisionandRecall (Bagga and Baldwin, 1998), satisfy these four constraints. Although these metrics were initially proposed to deal with scoring co-reference chains, we adapted them to tag clustering. In tag clustering, these metrics look at the presence/absence of tags relative to each of the other tags in the resulting clusters. Given a tagi, Equation 7 defines theBCubedPrecision, and Equation 8 defines theBCubedRecall.
BCPrecisioni=
number o f correct tags in cluster containing i
number o f tags in cluster containing i (7)
BCRecalli=
number o f correct tags in cluster containing i
number o f tags in class containing i (8)
Then, BCPrecisioniis the proportion of correctly related tags in the cluster where tagiis, including itself; and
BCRecalliis the proportion of correctly related tags in the class where tagiis, including itself.
The finalBCPrecisionis given by Equation 9, and the finalBCRecallby Equation 10.
BCPrecision=
N
X
i=1
wi×BCPrecisioni (9)
BCRecall=
N
X
i=1
wi×BCRecalli (10)
whereNis the number of tags. Even though in the original proposal of the metrics each item can have a different weightwi, we assume the same weights for each tag, so thatwican be defined as 1/Nin our formula.
We combine BCubed metrics by means of theF-measure(F1) van Rijsbergen (1974). In our case, F-measure combinesBCubedPrecision andRecallgiving the same weight to both; therefore, the resulting combination is the harmonic mean ofBCPrecisionandBCRecall(see Equation 11).
F= 2×BCRecall×BCPrecision
BCPrecision+BCRecall , (11)
whereF∈[0,1]. The closer is the F-measure to 1, the better is the clustering quality.
6.2. Experiments Settings
To facilitate the visualization of the clustered tag cloud, we rely on Kohonen’s Self-Organizing Maps. However, Self-Organizing Map does not generate proper clusters. To this end, we use a partitive clustering algorithm included in the well-known Cluto package5: Repeated Bisections with global optimization (rbr) (Zhao and Karypis, 2004). This algorithm is used over the output of the Self-Organizing Map in order to structure it into clusters6, allowing to perform a quantitative evaluation.
We also aimed to know whether the results obtained using the SOM are comparable to those achieved by another state-of-the-art algorithm or not. We followed two different approaches in order to cluster the T140 set, regardless of the representation method. In the first approach, we clustered the input vectors directly using Cluto. In the second approach, we group the input vectors using the SOM, and then we cluster the resulting SOM in order to evaluate the results. Next, we detail these methods in more depth:
• Baseline: clustering with Cluto package. In order to cluster tag vectors we used the algorithm described above. We clustered the T140 set once per each representation The number of clusters was set to the number of categories defined by the assessors, i.e., 24.
After this process we obtained 5 different clustering solutions: 4 corresponding to the co-occurrence matrices (see Section 5.1.1) and 1 corresponding to the content matrix (see Section 5.1.2). As we clustered the data ex-actly into the number of groups defined in the manual solution, we can directly evaluate these results comparing them with that solution.
• SOM-based Approach: clustering the Self-organizing map. In this approach we trained several SOMs and then we grouped their neurons to obtain the desired clusters. The first step was performed following the process described in Section 5.2. Due to the random initialization, we created five SOMs for each representation, in such a way that the effect ofstrange results(too bad or too good results) can be alleviated calculating the average. Once the T140 tags were mapped onto the SOM, the next step was to group the neurons using the same algorithm as in the baseline approach. This post-process allows to obtain clusters of neurons so that we can use external evaluation measures. We took each single map unit or neuron as an input vector to Cluto. At this point, we did not take all the SOM units, just those with at least one tag assigned during the first step. The output will be the desired number groups, composed by map neurons. Replacing each neuron by their labels we obtained the final clusters we want to compare with the manual solution. As in the baseline approach, we obtained 5 different clustering solutions: 4 corresponding to the co-occurrence matrices and 1 to the content matrix.
6.3. Results
The experimentation turned into a total of 10 scores: 8 corresponding to combinations of the 2 clustering al-gorithms and the 4 co-occurrences weighting functions, and the 2 clustering alal-gorithms with the representation by document content.
Table 2 shows the results grouped by algorithm approach, SOM+Cluto and Cluto respectively, accompanied by the average and the standard deviation values. From these results, it can be seen that SOM+Cluto yields the
best F-measure performance, but it is comparable to using Cluto on its own. This clarifies the question we set
5http://glaros.dtc.umn.edu/gkhome/cluto/cluto/overview
6Other algorithm parameters, like the similarity function or the criterion function, were used by default, specifying only the number of clusters
forth in Section 6.2 on whether or not the performance of the SOM is comparable to that by another state-of-the-art algorithm. Looking at average values, it can be observed that the SOM performs similarly when compared to the baseline algorithms, further allowing to visualize the clustered result. Thus, the results show that the SOM is able to group tags as accurately as Cluto does.
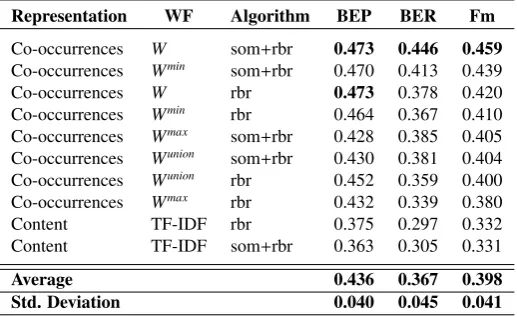
Further, Table 3 shows the results of the 10 scores. It showsBCPrecision,BCRecallandF-measuremetrics, in descending order ofF-measure. The best combination in terms of F-measure is SOM with the Clutorbralgorithm using theWweighting function (Equation 3).
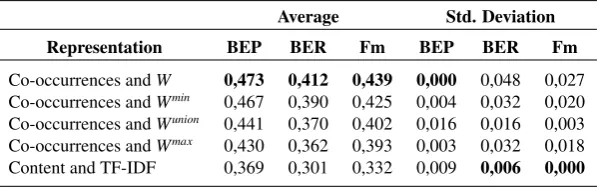
Table 4 shows the results grouped by tag representation approach. The representations with the bestBCPrecision
andBCRecallare those corresponding toW andWminfunctions. This is valid for both algorithm approaches as can
be seen in Table 3, where the 2 best results of each approach are reached respectively withWandWminfunctions. On the other hand, these results show that theWunion, namely the Jaccard similarity coefficient, in this case is not the best way of representing co-occurrences, as it was concluded by earlier works such as Dattolo et al. (2011). So, regarding the type of representation and the averageF-measurevalues (see Table 4), the 4 co-occurrence weighting functions outperform the representation based on document content. Therefore, it can be seen that the representations based on tag co-occurrence deal better than content-based representations with the tag clustering task. Of the four weighting functions based on co-occurrences,W andWminshow the best performance, in this order. We believe that this could
be a consequence of the imbalanced dataset; thus the weighting functions that normalize taking into account the larger document frequencies (WmaxandWunion) affect clustering in a negative way.
Average Std. Deviation
Algorithm BEP BER Fm BEP BER Fm
SOM+Cluto 0.433 0.386 0.408 0.044 0.052 0.049
Cluto 0.439 0.348 0.388 0.039 0.032 0.035
Table 2: Average and standard deviation values by algorithm
Representation WF Algorithm BEP BER Fm
Co-occurrences W som+rbr 0.473 0.446 0.459
Co-occurrences Wmin som+rbr 0.470 0.413 0.439
Co-occurrences W rbr 0.473 0.378 0.420
Co-occurrences Wmin rbr 0.464 0.367 0.410
Co-occurrences Wmax som+rbr 0.428 0.385 0.405
Co-occurrences Wunion som+rbr 0.430 0.381 0.404
Co-occurrences Wunion rbr 0.452 0.359 0.400
Co-occurrences Wmax rbr 0.432 0.339 0.380
Content TF-IDF rbr 0.375 0.297 0.332
Content TF-IDF som+rbr 0.363 0.305 0.331
Average 0.436 0.367 0.398
[image:13.595.169.428.450.608.2]Std. Deviation 0.040 0.045 0.041
Table 3: Global Ranking With the Final Benchmark
7. Tag Cloud Enrichment: a Deeper Qualitative Evaluation
Average Std. Deviation
Representation BEP BER Fm BEP BER Fm
Co-occurrences andW 0,473 0,412 0,439 0,000 0,048 0,027
Co-occurrences andWmin 0,467 0,390 0,425 0,004 0,032 0,020
Co-occurrences andWunion 0,441 0,370 0,402 0,016 0,016 0,003
Co-occurrences andWmax 0,430 0,362 0,393 0,003 0,032 0,018
[image:14.595.149.448.111.205.2]Content and TF-IDF 0,369 0,301 0,332 0,009 0,006 0,000
Table 4: Average and standard deviation values by type of representation for the final benchmark
from the content of the tagged documents, we propose the enrichment of our grouped tag cloud shown in Figure 3, with information of the most relevant terms associated to both individual tags and neurons. This way it would be easier to establish and analyze relations between tags and their associated content, and it also allows a qualitative evaluation to try to disambiguate polysemic tags.
Figure 2: Original Delicious tag cloud
7.1. Terminology Extraction Using Language Models
Once the tags have been grouped, the representative terminology for each neuron can be extracted by analyzing the content of the tagged documents.
First, we group all the documents annotated with the tags of a neuron, and we generate a ranked list of terms. To accomplish this task, we decided to use language modeling techniques, due to their ability to order terms based on their relevance in a neuron in comparison to the whole collection (the whole set of neurons). The more relevant is a term in a neuron, and the less relevant it is in the rest of neurons, the best rank it will get in the list of that neuron. As a result, each neuron will be associated to a ranked list of its relevant terms.
Based on the assumption that the difference between the distribution of terms in a neuron and the distribution of the same terms in the whole set of neurons is an indicator of semantic difference, terms representing semantically a neuron are more likely to appear in such a neuron than in the rest.
Kullback-Leibler divergence (KLD) weighting function is a measure in statistics to quantify how close is a proba-bility distributionPto a model (or candidate) distributionQCover and Thomas (1991). Therefore, the KLD weighting function is suitable for determining terms in a neuron diverging to the rest of neurons (see Equation 12).
KLD score=Pn(t).log
Pn(t)
Pm(t)
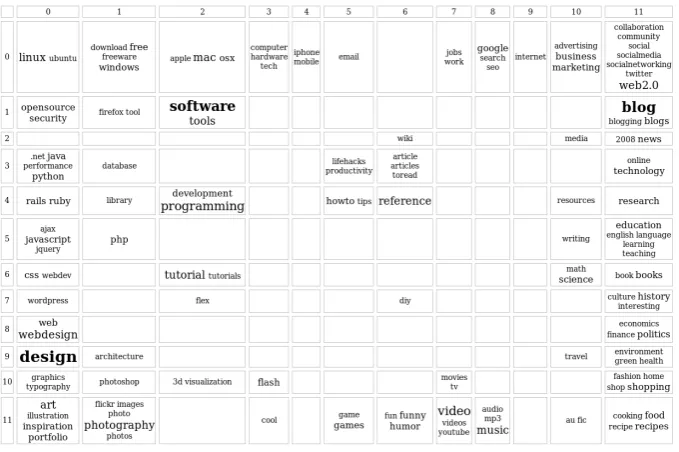
Figure 3: Clustered tag cloud
wherePnis the probability of the termtin the neuron, andPm(t) is the probability oftin the whole set of neurons.
KLD returns a value for each term in each neuron. Thus, we can infer how representative is a term for a neuron as compared to the rest of neurons. KLD scores were introduced to statistically reflect the goodness of the discrimination of a term towards the collection of documents. A smaller KLD score of a term means that the occurrence probability of the term in a neuron is closer to the occurrence probability of the term in the whole set of neurons, that is, the term is not discriminative to distinguish the tags associated to the neuron from the rest of neurons. A larger KLD score for a term means that occurrence probability of the term in that neuron is much higher than that of the term in the rest of neurons, showing that the term is discriminative. A good discriminative term must have a great contribution to the difference between a neuron and the rest.
The same process of terminology extraction for the neurons is also applied to tags, obtaining the relevant terms of each tag. Once we have the KLD scores, we can associate terms to a neuron or to a tag. As a result, we get a clustered tag cloud where every tag and neuron is associated to a list of relevant terms, helping the user understand the meaning of a tag, and providing further navigation possibilities (see Figures 3 and 4).
7.2. Qualitative Evaluation
Quantitative results of each of the algorithms and representations we used in our experiments allowed us to com-pare the scope of each of the methods. Nonetheless, we consider this evaluation approach is mainly useful as a comparative measure, where higher results implies better performance over the manual grouping. On the other hand, it is worthwhile noting that the manual classification process of tags did not consider the specific meaning each tag can represent in our collection, but only the most spread sense of the word; this makes the manual classification not to be collection-sensitive. Because of this, we believe that a qualitative evaluation can help to understand and complete the results beyond the comparison of the different proposed methods. In consequence, we conclude that our quantitative evaluation enables the comparison among clustering approaches, but the provided performance results could not be as good as they really are from a qualitative point of view.
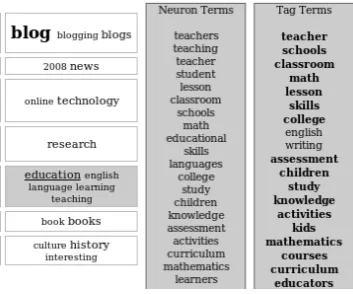
Figure 4: Terminology corresponding toeducationtag, extracted from neuron (11/5). Words in bold represent terminology present both in tag and neuron.
• The resulting tag cloud shows that tags likecommunityandsocial, grouped into the category Societyin the manual classification, are surrounded by tags related to social networking, e.g. twitter,collaborationor
so-cialmedia, and far away from other society-related tags, likehistory,politicsorgreen. It looks like the real
meaning of the tagcommunityin this collection of documents refers to a group of users sharing interests, as used in computer science. In the same manner, the wordsocialis used here in the context of social networking and not in the context ofSociety.
• Every pair of tags with singular and plural forms of the same word are grouped in the same neuron (arti-cle/articles (3, 6), photo/photos (11, 1), tutorial/tutorials (6, 2), game/games (11, 5), video/videos (11, 7), recipe/recipes (11, 11), book/books (6, 11), blog/blogs (1, 11)), excepttoolandtoolsthat are neighbors.
• Tags with the same stem share neurons. This is the case of tag pairs likephotoandphotography(11, 1),blog
andblogging(1, 11),funandfunny(11, 6), andshopandshopping(10, 11).
• We assumed that tags in theOtherscategory would be incorrectly grouped, since apparently they do not share any semantical relatedness. However, specifically in this collection, it seems that tags in the miscellanea cate-gory present a meaningful relation with tags from other categories:
– 2008: it is spatially located withnews, which seems to be a time-sensitive topic, and may be associated to temporal tags.
– cool: although it is alone, its closest neighbors refer to design-related topics, andcoolseems to be a term of common usage in the design community.
– toread: being a tag that refers to resources that may be read in the future, it shares neuron witharticleand
articles.
– interesting: this is another non-factual and subjective tag (likecool), that does not appear to be connected
to any concrete community.
7.3. Applications
Creating lists of terms for each tag and neuron in a tag cloud may be useful for a handful of applications on social bookmarking systems: filtering by the desired topic and terms could be a good way to subscribe to a customized feed; finding collection-specific relations among tags allows to discover user communities, or even temporal trends; the new visualization improves the way in which users can explore the whole document collection; analyzing the evolution of tag relations over time could show interesting characteristics of each tag, e.g., whether a tag is temporarily popular.
term “math”. In the same manner, the user could also subscribe to the feed associated to the entire neuron (including
education,english, language, learningandteaching), but only those pages containing the term “math”. Figure 4
shows the terms ranked by relevance belonging to tageducationand also the terms of the corresponding neuron. Thus, an analysis on tag evolution throughout time could be done based on the progressive map updates, e.g., a tag likenewsmay vary its neighborhood due to the trends of the news in a specific period.
8. Conclusions and Outlook
Throughout this work we have explored the task of clustering tags in a tag cloud in order to improve access to the contents on social bookmarking sites. We have explored different representations for clustering tags finding groups of semantic similarities. Clustering tags by similarity helps users navigate through related contents in an easier way. Previous research relied on either tag co-occurrences or textual content to find relations among tags. To the best of our knowledge, there was neither a comparison of approaches based on co-occurrences and textual content, nor any benchmark dataset allowing to quantitatively evaluate the clustering results. In view of the increasing interest of researchers in finding semantic relations among tags, this work has filled these 2 gaps, comparing approaches based on co-occurrences and content, and presenting a benchmark social tagging dataset that includes a manual categorization that can be used as a ground truth for quantitative evaluation.
In the task of finding relations among tags, we have compared five different representations. We have used four different representations based on tag co-occurrences, and one based on textual content. We have built a set of input vectors, one per tag, containing the similarity values between the vector tag and the rest of the T140 tags. The four functions based on co-occurrences were chosen in order to establish a baseline for tag co-occurrence representation facing the comparison with the content-based representation, which is based on the TF-IDF term weighting function. We have also shown that the SOM is able to organize the tag cloud at least as good as classical clustering algorithms do, while allowing a visualization of the result.
Our results show that representing tags by co-occurrences yields more accurate clusters than representing them by content. In addition, the representations based on co-occurrences significantly reduce the computational cost of the process due to (i) the smaller number of features per vector, and (ii) the easier way to build those vectors. Among the 4 different functions to weight co-occurrences, two of them outperform the Jaccard similarity coefficient, which has been widely used to perform the task without exploring its appropriateness. On the other hand, we have complemented the analysis of the clustered results by resorting to qualitative criteria. The terminology extracted from the documents helped us to determine some cases where tags are used with meanings biased to the concrete dataset. We also proposed several applications of this terminology extraction to improve information access.
We believe that our dataset presents a reliable solution for researchers to build new approaches for finding tag relations while evaluating based on sound quantitative criteria. Likewise, our study provides insight about the appro-priateness of different tag representations for finding relations among tags, paving the way to scientists and developers that deploy social bookmarking systems.
As future work, another level of organization could be reached expanding the clustering with a finer granularity level. Our clustered cloud shows neurons that contain tags, and each tag has a set of associated documents. We could work at the level of neurons, grouping documents corresponding to neuron tags. In this manner we would obtain document groups related to each neuron, providing a deeper level of organization and facilitating user navigation. Likewise, the terminology extraction process could provide a higher abstraction level, offering lists of terms for clusters, in addition to neurons and tags. Finally, considering overlappings of clusters would be interesting to evaluate the solutions.
Acknowledgments
References
Amig´o, E., Gonzalo, J., Artiles, J., Verdejo, F., 2009. A comparison of extrinsic clustering evaluation metrics based on formal constraints. Inf. Retr. 12 (5), 613–613.
Angeletou, S., Sabou, M., Specia, L., Motta, E., 2007. Bridging the gap between folksonomies and the semantic web. In: Proceedings of ESWC 2007: Workshop on Bridging the Gap between Semantic Web and Web 2.0.
Bagga, A., Baldwin, B., 1998. Entity-based cross-document coreferencing using the vector space model. In: Proceedings of the 17th international conference on Computational linguistics. Association for Computational Linguistics, Morristown, NJ, USA, pp. 79–85.
Barr´on-Adame, J., Cortina-Januchs, M., Vega-Corona, A., Andina, D., 2012. Unsupervised system to classify so2 pollutant concentrations in salamanca, mexico. Expert Systems with Applications 39 (1), 107 – 116.
URLhttp://www.sciencedirect.com/science/article/pii/S0957417411008670
Begelman, G., Keller, P., Smadja, F., 2006. Automated tag clustering: Improving search and exploration in the tag space. In: WWW ’06: Collabo-rative Web Tagging Workshop.
Brooks, C. H., Montanez, N., 2006. Improved annotation of the blogosphere via autotagging and hierarchical clustering. In: WWW ’06: Proceed-ings of the 15th international conference on World Wide Web. ACM, New York, NY, USA, pp. 625–632.
Cattuto, C., Benz, D., Hotho, A., Stumme, G., 2008. Semantic grounding of tag relatedness in social bookmarking systems. The Semantic Web-ISWC 2008, 615–631.
Chen, Y.-X., Santa´ıa, R., Butz, A., Ther´on, R., 2009. Tagclusters: Semantic aggregation of collaborative tags beyond tagclouds. In: Butz, A., Fisher, B. D., Christie, M., Kr¨uger, A., Olivier, P., Ther´on, R. (Eds.), Smart Graphics. Vol. 5531 of Lecture Notes in Computer Science. Springer, pp. 56–67.
Cover, T., Thomas, J., 1991. Elements of information theory.
Dattolo, A., Eynard, D., Mazzola, L., 2011. An integrated approach to discover tag semantics. In: Proceedings of the 2011 ACM Symposium on Applied Computing. SAC ’11. ACM, New York, NY, USA, pp. 814–820.
Deutsch, S., Schrammel, J., Tscheligi, M., 2011. Comparing different layouts of tag clouds: Findings on visual perception. In: Proceedings of the
Second IFIP WG 13.7 conference on Human-computer interaction and visualization. HCIV’09. Springer-Verlag, Berlin, Heidelberg, pp. 23–37. Dittenbach, M., Merkl, D., Rauber, A., 2000. The growing hierarchical self-organizing map. IEEE Computer Society, pp. 15–19.
Gabrielsson, S., Gabrielsson, S., August 2006. The Use of Self-Organizing Maps in Recommender Systems. Master’s thesis, Department of Information Technology at the Division of Computer Systems, Uppsala University.
Garcia-Silva, A., Corcho, O., Alani, H., Gomez-Perez, A., December 2011. Review of the state of the art: Discovering and associating semantics to tags in folksonomies. Knowledge Engineering Review 26 (4).
Hassan-Montero, Y., Herrero-Solana, V., October 2006. Improving tag-clouds as visual information retrieval interfaces. I International Conference on Multidisciplinary Information Sciences and Technologies.
Heymann, P., Koutrika, G., Garcia-Molina, H., 2008. Can social bookmarking improve web search? In: WSDM ’08: Proceedings of the interna-tional conference on Web search and web data mining. ACM, New York, NY, USA, pp. 195–206.
Jiang, J., Conrath, D., 1997. Semantic similarity based on corpus statistics and lexical taxonomy. Arxiv preprint cmp-lg/9709008.
Jieh-Haur, Chen, 2012. Developing sfnn models to predict financial distress of construction companies. Expert Systems with Applications 39 (1), 823 – 827.
URLhttp://www.sciencedirect.com/science/article/pii/S0957417411010426
Karydis, I., Nanopoulos, A., Gabriel, H., Spiliopoulou, M., 2009. Tag-aware spectral clustering of music items. In: INTERNATIONAL SYMPO-SIUM ON MUSIC INFORMATION RETRIEVAL. Citeseer.
Kohonen, T., Sep 1990. The self-organizing map. Proceedings of the IEEE 78 (9), 1464–1480.
Kohonen, T., 2001. Self-Organizing Maps. Self-organizing maps. 3rd ed. Berlin: Springer, 2001, xx, 501 p. Springer series in information sciences, ISBN 3540679219.
Li, B., Zhu, Q., 2008. The determination of semantic dimension in social tagging system based on som model. In: Proceedings of the Second International Symposium on Intelligent Information Technology Application, 2008. IITA ’08.
man Au Yeung, C., Gibbins, N., Shadbolt, N., 2007. Tag meaning disambiguation through analysis of tripartite structure of folksonomies. In:
WI-IATW ’07: Proceedings of the 2007 IEEE/WIC/ACM International Conferences on Web Intelligence and Intelligent Agent Technology
-Workshops. IEEE Computer Society, Washington, DC, USA, pp. 3–6.
Markines, B., Cattuto, C., Menczer, F., Benz, D., Hotlo, A., Stumme, G., 2009. Evaluating similarity measures for emergent semantics of social tagging. In: Proccedings of the International World Wide Web Conference, WWW 2009. pp. 641–650.
Meila, M., 2003. Comparing clusterings by the variation of information. In: COLT. pp. 173–187.
Mika, P., 2007. Ontologies are us: A unified model of social networks and semantics. Web Semantics: Science, Services and Agents on the World Wide Web 5 (1), 5–15.
Perelomov, I., Azcarraga, A. P., Tan, J., Chua, T. S., 2002. Using structured self-organizing maps in news integration websites.
Porter, M., 1980. An algorithm for suffix stripping. Program 14 (3), 130–137.
Risi, S., Lehwark, P., Ultsch, A., 2008. Visualization and Clustering of Tagged Music Data. Studies in Classification, Data Analysis, and Knowledge Organization. Data Analysis, Machine Learning and Applications. Springer Berlin Heidelberg.
Roh, T. H., Oh, K. J., Han, I., Oct. 2003. The collaborative filtering recommendation based on SOM cluster-indexing CBR. Expert Systems with Applications 25 (3), 413–423.
Russell, B., Yin, H., Allinson, N. M., 2002. Document clustering using the 1+1 dimensional self-organising map. In: Proceedings of the Third
IDEAL.
Sbodio, M. L., Simpson, E., 2009. Tags clustering with self organizing maps. HP Labs Techincal Reports. Schmitz, P., 2006. Inducing ontology from flickr tags. In: WWW ’06: Collaborative Web Tagging Workshop.
evolution. In: CSCW ’06: Proceedings of the 2006 20th anniversary conference on Computer supported cooperative work. ACM, New York, NY, USA, pp. 181–190.
Simpson, E., 2008. Clustering tags in enterprise and web folksonomies. HP Labs Techincal Reports.
Specia, L., Motta, E., 2007. Integrating folksonomies with the semantic web. The Semantic Web: Research and Applications.
Sun, K., Wang, X., Sun, C., Lin, L., Mar. 2011. A language model approach for tag recommendation. Expert Systems with Applications 38 (3), 1575–1582.
van Rijsbergen, C. J., 1974. Foundations of evaluation. Journal of Documentation 30, 365–373.
Vandic, D., van Dam, J.-W., Hogenboom, F., Frasincar, F., 2011. A semantic clustering-based approach for searching and browsing tag spaces. In: Proceedings of the 2011 ACM Symposium on Applied Computing. SAC ’11. ACM, New York, NY, USA, pp. 1693–1699.
Venetis, P., Koutrika, G., Garcia-Molina, H., 2011. On the selection of tags for tag clouds. In: Proceedings of the fourth ACM international conference on Web search and data mining. WSDM ’11. ACM, New York, NY, USA, pp. 835–844.
Vesanto, J., Alhoniemi, E., 2000. Clustering of the self-organizing map. IEEE-NN.
Wu, X., Zhang, L., Yu, Y., 2006. Exploring social annotations for the semantic web. In: Proceedings of WWW ’06. ACM, New York, NY, USA, pp. 417–426.
Zhao, Y., Karypis, G., 2004. Empirical and theoretical comparisons of selected criterion functions for document clustering. Mach. Learn. 55 (3), 311–331.
Zheng, N., Li, Q., Apr. 2011. A recommender system based on tag and time information for social tagging systems. Expert Systems with Applica-tions 38 (4), 4575–4587.
Zubiaga, A., Garc´ıa-Plaza, A. P., Fresno, V., Mart´ınez, R., 2009a. Content-based clustering for tag cloud visualization. In: ASONAM ’09: Pro-ceedings of the 2009 International Conference on Advances in Social Network Analysis and Mining. IEEE Computer Society, Washington, DC, USA, pp. 316–319.