warwick.ac.uk/lib-publications
A Thesis Submitted for the Degree of PhD at the University of Warwick
Permanent WRAP URL:
http://wrap.warwick.ac.uk/85990
Copyright and reuse:
This thesis is made available online and is protected by original copyright. Please scroll down to view the document itself.
Please refer to the repository record for this item for information to help you to cite it. Our policy information is available from the repository home page.
M A
E
G NS
I T A T MOLEM
U N
IV
ER
SITAS WARWICEN
SIS
Machine learning and Energy Efficient Cognitive
Radio
by
Freeha Azmat
Thesis
Submitted to University of Warwick in partial fulfilment of
the requirements for the degree of
Doctor of Philosophy
School of Engineering
Contents
Acknowledgments vi
Declarations viii
Abstract ix
List of Publications xi
List of Figures i
List of Tables vi
Abbreviations vii
Chapter 1 Introduction 1
1.1 Introduction . . . 1
1.2 Cognitive Radio . . . 4
1.2.1 Overview of cognitive radio networks . . . 5
1.2.2 IEEE Standard: 802.22 . . . 10
1.2.3 Potential applications of cognitive radio . . . 13
1.3 Thesis Outline . . . 16
1.3.1 Research Motivation . . . 16
Chapter 2 Background and Literature Review 22
2.1 Introduction . . . 22
2.2 Perception . . . 23
2.2.1 Energy Detection . . . 25
2.2.2 Coherent Detection . . . 26
2.2.3 Feature detection . . . 27
2.3 Learning and Reasoning . . . 34
2.3.1 Bio-Inspired Intelligence . . . 35
2.3.2 Bio-Inspired Cognitive radio . . . 36
2.3.3 Machine Learning . . . 37
2.3.4 Machine Learning Cognitive Radio . . . 38
2.4 Energy harvesting cognitive radio networks . . . 41
2.4.1 RF Energy harvesting . . . 41
2.4.2 Wireless power transfer methods . . . 44
Chapter 3 Bio-Inspired Cognitive Radios 46 3.1 Introduction . . . 46
3.2 System Model . . . 48
3.3 Proposed Algorithms and Methodology . . . 53
3.3.1 Spectrum Sensing . . . 53
3.3.2 Spectrum Allocation . . . 56
3.4 Numerical Results and Discussion . . . 59
3.4.1 Parameter selection for Bio-Inspired Algorithms . . . 59
3.4.2 Comparison of PSO, FFA and FSS . . . 60
3.4.3 Comparison of Bio-Inspired Algorithms with WLC . . . 61
3.4.4 Effect of SNR . . . 66
3.4.5 Effect of the number of radios . . . 66
3.4.7 Spectrum allocation functions . . . 71
3.5 Conclusion . . . 74
Chapter 4 Machine Learning Cognitive Radios 75 4.1 Introduction . . . 75
4.2 System Model . . . 77
4.2.1 Measurement setup and data . . . 77
4.2.2 SU Model . . . 78
4.2.3 PU Model . . . 81
4.2.4 Machine learning framework for SU and PU Model . . . 82
4.2.5 Blocking Probability . . . 84
4.3 Proposed Algorithms . . . 84
4.3.1 Naive Bayesian Classifier . . . 85
4.3.2 Decision Trees . . . 85
4.3.3 Support Vector Machines . . . 87
4.3.4 SVM with Fire Fly Algorithm . . . 88
4.3.5 Hidden Markov Models . . . 89
4.4 Numerical Results and Discussion . . . 91
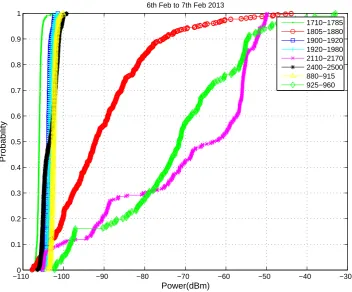
4.4.1 Statistics of Data . . . 92
4.4.2 Classification Criteria . . . 109
4.4.3 Parameter Selection . . . 112
4.4.4 Model Performance Comparison . . . 117
4.5 Conclusion . . . 121
Chapter 5 Predictive Modelling for Energy Harvesting 123 5.1 Introduction . . . 123
5.2 System Model . . . 125
5.2.1 RF Energy Harvesters . . . 125
5.2.3 Amplitude Probability Distribution (APD) . . . 127
5.3 Proposed Methodology . . . 127
5.3.1 Linear Regression . . . 127
5.3.2 Decision Trees . . . 128
5.4 Numerical Results and Discussion . . . 129
5.4.1 Harvested Power . . . 130
5.4.2 Amplitude Probability Distribution . . . 131
5.4.3 Predictive Energy model . . . 135
5.4.4 Performance Comparison of LR and DT . . . 138
5.4.5 Performance Comparison of Moving Average Method and LR 140 5.5 Conclusion . . . 142
Chapter 6 Energy Harvesting Cognitive Radios 143 6.1 Introduction . . . 143
6.2 System Model . . . 145
6.3 Analysis . . . 149
6.3.1 Proposed Strategy . . . 150
6.3.2 Conventional Strategy . . . 152
6.4 Numerical Results and Discussion . . . 154
6.4.1 Effect of changingP0 . . . 155
6.4.2 Effect of changingPs . . . 160
6.4.3 Effect of changingτi . . . 161
6.5 Conclusion . . . 165
Chapter 7 Conclusions and Future Work 170 7.1 Conclusions and Contributions . . . 170
Acknowledgments
First of all, I thank Almighty ALLAH for giving me strength and ability to com-plete this thesis. I would like to express my sincere and greatest gratitude to my supervisor, Dr. Yunfei Chen. This work would not have been possible without his generous guidance, suggestions and support. His endless patience and sharp intel-lect facilitated a highly productive relationship. I have been lucky to have him as my supervisor.
I would also like to sincerely acknowledge my second supervisor, Prof. Nigel Stocks, for providing me constructive advice and feedback related to the research project. It has been a pleasure to work with him and learn from such a kind and experienced individual.
Most importantly, I would like to thank my beloved parents and all family members for their unconditional sacrifices and constant encouragement. Without their boundless love, it would not have been possible for me to complete this journey. I would like to dedicate this thesis to them.
I specially thank Warwick Graduate School for awarding me Chancellors In-ternational Scholarship. My dream to accomplish PhD would not come true without this financial support.
I also would like to acknowledge all the fellows at Communication Networks (CoMNet) Lab for providing me inspirational research environment.
I would also like to thank my friends and my house mates who have encour-aged me during tough times.
Declarations
This thesis is submitted in partial fulfilment for the degree of Doctor of Philosophy under the regulations set out by the Graduate School at the University of Warwick. This thesis is solely composed of research completed by Freeha Azmat, except where stated, under the supervision of Dr. Yunfei Chen and Prof. Nigel Stocks between the dates of January 2013 and October 2016. This thesis has not previously been presented in identical or similar form to any other examination board.
Abstract
wireless networks without the need of battery change. In particular, energy can be harvested from the radio waves in the radio frequency spectrum. For ensuring reliable performance, energy prediction has been proposed as a key component for optimizing the energy harvesting because it equips the harvesting nodes with adap-tation to the energy availability. Two machine learning techniques, linear regression (LR) and decision trees (DT) have been utilized to predict the harvested energy using real-time power measurements in the radio spectrum. Furthermore, the con-ventional energy harvesting cognitive radios do not assume any energy harvesting capability at the primary users (PUs). However, this is not the case when primary users are wirelessly powered. In this thesis, a novel framework has been proposed where PUs possess the energy harvesting capabilities and can get benefit from the presence of the secondary user (SU) without any predetermined agreement. The performances of the wireless powered PUs and the SU has also been analysed.
List of Publications
Published Journals:
1. Freeha Azmat, Yunfei Chen, Nigel Stocks, ”Bio-inspired
collabo-rative spectrum sensing and allocation for cognitive radios”, IET
Commu-nications, vol. 9, no. 16, May 2015.
2. Freeha Azmat, Yunfei Chen, Nigel Stocks, ”Analysis of spectrum
occupancy using machine learning algorithms”, IEEE Transactions on
Ve-hicular Technology, vol. pp, no. 99, Oct 2015.
3. Freeha Azmat, Yunfei Chen, Nigel Stocks, ”Predictive Modelling
of RF energy for Wireless Powered Communications”, IEEE
Communica-tion letters, vol. 20, no. 1, Nov 2015.
To be submitted:
1. Freeha Azmat, Yunfei Chen, Nigel Stocks, ”Performance Analysis of
Wireless Powered energy harvesting cognitive radio networks”.
2. Freeha Azmat, Yunfei Chen, Nigel Stocks, ”Spectrum prediction
List of Figures
1.1 A bar chart illustrating the spectrum occupancy measurements eval-uated between 30 MHz to 3 GHz for seven different locations in the United States. Adapted from [2]. . . 2 1.2 Overall spectrum occupancy measured at seven different locations in
the United States. Adapted from [2]. . . 3 1.3 The relationship between the average power (dBm) and the frequency
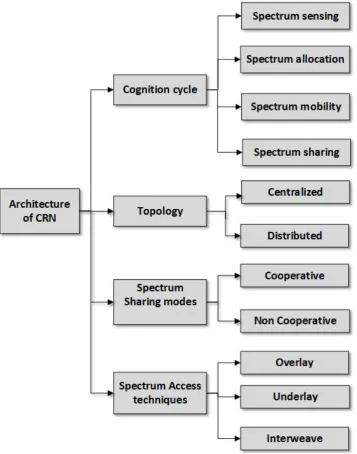
range between 9 kHz - 1 GHz using the spectrum occupancy measure-ments attained at Lawrence, Kansas, USA. Adapted from [5]. . . 4 1.4 Architecture of the cognitive radio networks that comprises of a
cog-nition cycle, network topology, spectrum sharing and spectrum access modes. Adapted from [10] . . . 7 1.5 Dynamic spectrum access in an interweave mode. Adapted from [1]. 9 1.6 Overaly and underlay spectrum sharing modes in cognitive radio.
Adapted from [5] . . . 11 1.7 A Superframe structure having a duration of 160 ms, where each
superframe has 16 frames and every individual frame consumes 10 ms. Adapted from [20]. . . 13
2.2 Cognitive radio engine illustrating the relationship between the soft-ware radio, the knowledge base, the learning and the reasoning engine. Adapted from [46]. . . 34 2.3 Three methods of learning from data in machine learning (a)
super-vised learning (b) unsupersuper-vised learning and (c) reinforcement learn-ing. Adapted from [75]. . . 39 2.4 The relationship of cognition cycle with the components of RF
pow-ered cognitve radio network device. Adapted from [87] . . . 42 2.5 Wireless powered communication. Adapted from [91]. . . 45
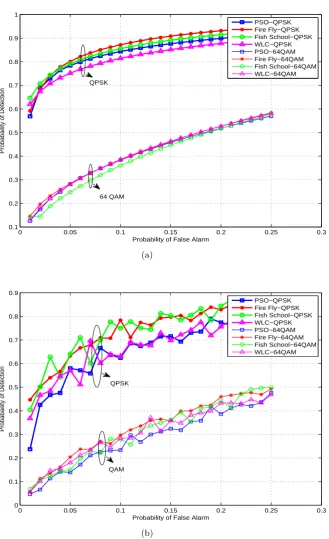
3.1 Comparison of high power amplifier model and memory less polyno-mial model. . . 50 3.2 A cooperative spectrum sensing and allocation framework. . . 59 3.3 Using Pf = 0.1, the convergence rate of (a) rectangular pulse using
model1 (M1) and model2 (M2) (b) cosine pulse using model1 (M1) and model2 (M2). . . 62 3.4 UsingPf = 0.1, the convergence rate of linear rectangular and cosine
pulses. . . 63 3.5 Comparison of bio-inspired algorithms with WLC using model1 by
considering rectangular and cosine pulses for different values ofPf. . 64
3.6 Comparison of bio-inspired algorithms with WLC using model2 by considering rectangular and cosine pulses for different values ofPf. . 65
3.7 (a) Effect of different values of SNR on the value ofPd (b) Effect of
changing the number of radios on the value ofPd. . . 67
3.8 Effect on the value of Pd using (a) different modulation schemes
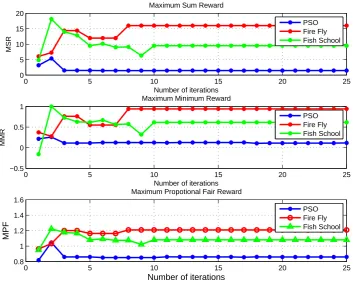
3.9 Average values of non-linear frequency selective faded model modu-lated using QPSK withk= 250 . . . 70 3.10 Spectrum allocation rewards using rectangular pulse and model2. . . 71
4.1 (a) RFeye evaluation system (b) RFeye battery and monitor. . . 79 4.2 Occupancy for different time slots between 880 -890 MHz usingk= 9
and n= 3. . . 82 4.3 The CDFs for the eight bands between 880-2500 MHz. . . 93 4.4 (a) Histogram of 925-960 MHz using n= 172800 and k = 192. (b)
Mean received Power and σi of Band 925-960 MHz over the period of 120 days using n= 1440 andk= 192. . . 95 4.5 (a) Histogram of 1805-1880 MHz usingn= 172800 and k= 448. (b)
Mean received Power andσi of Band 1805-1880 MHz over the period of 120 days using n= 1440 andk= 448. . . 96 4.6 (a) Histogram of 880-915 MHz using n= 172800 and k = 192. (b)
Mean received Power and σi of Band 880-915 MHz over the period
of 120 days using n= 1440 andk= 192. . . 97 4.7 (a) Histogram of 1710-1785 MHz usingn= 172800 and k= 448. (b)
Mean received Power andσi of Band 1710-1785 MHz over the period of 120 days using n= 1440 andk= 448. . . 98 4.8 Occupancy VS spectrum frequency for aperiodic bands (a) 1805-1880
MHz (b) 925-960 MHz. . . 101 4.9 Occupancy VS spectrum frequency for periodic bands (a) 1710-1785
MHz (b) 880-915 MHz . . . 102 4.10 Occupancy VS spectrum frequency for aperiodic bands using -76dBm
(a) 1805-1880 MHz (b) 925-960 MHz. . . 103 4.11 Occupancy VS spectrum frequency for periodic bands using -76dBm
4.12 Effect of different threshold levels on mean occupancy for (a) 880-915 MHz (b) 1805-1880 MHz. . . 105 4.13 Occupany VS time using k= 192 and n= 172800 (a) 880-915 MHz
(b) 925-960 MHz. . . 107 4.14 Selection of optimal threshold (λ) and optimal splitting range ([Uoc, Loc])
for determining the classification criteria of three days data. . . 111 4.15 Selection of optimal number of free frequency slots using optimal
splitting threshold and optimal occupancy range attained using Fig. 4.14. . . 112 4.16 Effect of different kernel functions on classification accuracy using NBC113 4.17 Effect of changing splitting criteria on classification accuracy, when
the number of observations per leaf node[1,50]. . . 114 4.18 Effect of different kernel functions on classification accuracy using SVM115 4.19 Effect of different values of box constraints on classification accuracy. 116 4.20 Performance Comparison using k= 192. . . 118 4.21 (a) Performance comparison of ML algorithms: SVM, DT, NBC,
HMM, ’SVM+FFA’ and statistical model [112] using k = 192 for 30 days. (b) Comparison of expected and evalautedP(SUblocking)
us-ing SVM, DT, NBC, HMM, ’SVM+FFA’ and statistical model [112] using k= 192 for 30 days. . . 120
5.1 Input Power(mW) after normalization usingn= 100 andk= 192 of Band 880-915 MHz. . . 130 5.2 PCE plots of LEH [145] and MEH [146] for Band 880-915 MHz. . . 132 5.3 Harvested power of Band 880-915 MHz using n= 100 and k = 192
for (a) low efficiency harvester (b) medium efficiency harvester. . . . 133 5.4 Amplitude probability distribution of Band 880-915 MHz forn= 100
5.5 The predicted harvested power Hdi,m
test and RMSE using DT and LR
for LEH and MEH between 896- 906 MHz. . . 136
5.6 The predicted harvested power Hdi,m test and RMSE using DT and LR for LEH and MEH between 2140- 2160 MHz . . . 137
5.7 The predicted harvested powerHdi,m testform= 897 MHz andm= 897.2 MHz attained using LEH and MEH. . . 139
5.8 Comparison of LR with MA using (a) 880-915 MHz (b) 2110-2170 MHz. . . 141
6.1 A wireless powered cognitive radio framework havingKprimary users (P Ui, where i= 1,2, .., K), an access point (AP), a secondary user transmitter (SUTR) and a secondary user receiver (SUR). The links in black color represent the communication channels within a pri-mary/ secondary network while the ones in red color represent the communication channels between the primary and the secondary net-work. The primary users P Ui=1 and P Ui=K are represented in the figure, whereican have any value between 1 and K. . . 147
6.2 E[P E] Vs Po. . . 156
6.3 E[RSU R] VsPo for (a)Pi=3.3 dB (b)E[Pi] =E[P E]/τi. . . 158
6.4 E[SE] Vs Po for conventional method when SUTR harvests in both H1 and H2 using (a)Pi=3.3 dB (b)E[Pi] =E[P E]/τi. . . 159
6.5 E[P E] Vs Ps. . . 161
6.6 E[RSU R] VsPs usingE[Pi] =E[P E]/τi. . . 162
6.7 E[RSU R] VsPs considering interference due to AP. . . 163
6.8 E[SE] VsPs forE[Pi] =E[P E]/τi. . . 164
6.9 E[P E] Vs τ1. . . 166
6.10 E[RSU R] Vsτ1 for (a)Pi=3.3 dB (b)E[Pi] =E[P E]/τi. . . 167
List of Tables
1.1 Comparison of underlay, overlay and interweave spectrum access tech-niques in cognitive radio techtech-niques. Adapted from [23]. . . 15 1.2 The comparison of IEEE 802.22 wireless radio access network (WRAN)
to the other popular wireless standards. Adapted from [22]. . . 16
2.1 Comparison between Spectrum Sensing Techniques. Adapted from [62] 33 2.2 Experimental data of RF energy harvesting. Adapted from [87]. . . . 43
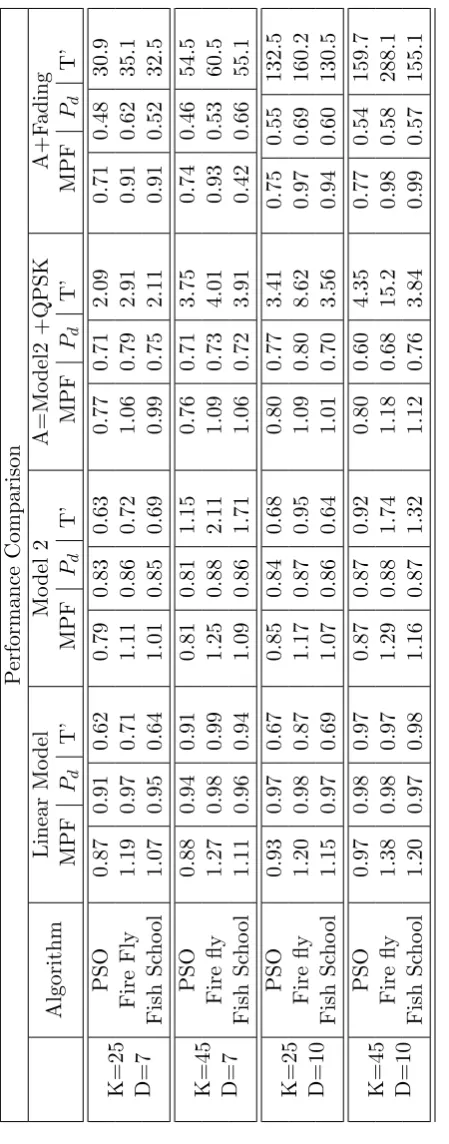
3.1 Analogies between CRN framework and proposed bio-inspired tech-niques. . . 53 3.2 Performance comparison of linear, non-linear, non-linear modulated
and non-linear modulated faded models . . . 73
4.1 UK cellular frequency bands measured at University of Warwick from Feb - June 2013. . . 79 4.2 Statistics of Frequency Bands measured at the University of Warwick
between 880-2500 MHz. . . 108 4.3 Performance Comparison of five ML algorithms for several iterations
using different sizes of Training/Testing data. . . 122
Abbreviations
AP Access point
APD Amplitude probability distribution AI Artificial intelligence
ABC Artificial bee colony
AWGN Additive white Gaussian noise CA Classification Accuracy CR Cognitive radio
CRN Cognitive radio network CAF Cyclic autocorrelation function CSD Cyclic spectral density
CSGC Color-sensitive graph coloring CSS Cooperative spectrum sensing DSA Dynamic spectrum access DT Decision trees
DL Downlink
DFS Dynamic frequency selection EH Energy harvesting
EGC Equal gain combining
EWMA Exponentially weighted moving average FFA Fire Fly algorithm
GA Genetic algorithm
GMM Gaussian mixture model HMM Hidden markov model HPA High Power Amplifier
ICT Information and communication technology KNN K-nearest neighbour
KBL Kernel based learning LEH Low efficiency harvester LR Linear regression
MEH Medium efficiency harvester MA Moving average
MAC Media access control ML Machine learning
MMR Maximum minimum reward MPF Maximum proportional fair reward MSR Maximum Sum Reward
NF Noise figure
NBC Naive Bayesian classifier NRMSE Normalized Root mean square Ofcom Office of communications OC Optimal combining
OSA Opportunistic spectrum access OPEX Operational expenditures PA Power amplifier
PSO Particle swarm optimization PU Primary User
PCE Power conversion efficiency QoS Quality of service
QGA Quantam genetic algorithm
QPSK Quadrature phase shifting key RF Radio frequency
SPTF Spectrum policy task force SNR Signal-to-noise ratio SUR Secondary user receiver SUTR Secondary user transmitter SVM Support vector machine
SWIPT Simultaneous wireless information and transmit power TPC Transmit power control
UL Uplink
UHF Ultra-high frequency VHF Very high frequency WLC Weighted linear combining WPC Wireless powered communication WPT Wireless power transfer
Important Symbols
Boxct Box constraints in SVM
coni Consecutive free frequency bins in the ith time slot
E[P E] Expected harvested energy at the PU
E[P E] Expected harvested energy at the SUTR
E[RSU R] Expected throughput of the SUR
γ Signal to noise ratio of the dthradio
Γ(., .) Incomplete Gamma function
Hi,mtrain−1:m−q Training feature vector for energy harvesting
Htraini,m Target label for energy harvesting
λ Decision threshold
Loc Minimum value of occupancy
OCi Occupancy of the ith time slot
Pevali PU occupancy predicted by the classifier
Pf a Probability of false alarm
Pd Probability of detection
Pi Power of the primary user
P0 Power of an AP signal
Ps Power of the SUTR signal
Q(x) Tail probability of the standard normal distribution
Qu(a, b) The generalized Marcum Q-function
Si(j) Spectrum status of the PU signal
Uoc Maximum value of occupancy
w Optimal weighting vector
xi(j) Input PU signal
Chapter 1
Introduction
1.1
Introduction
With the explosive development of wireless products and mobile internet
ap-plications, the demand of radio frequency (RF) spectrum has been constantly
increasing. The vast majority of the frequency spectrum is restricted to
licensed-only access under the current policies defined by the spectrum
regu-lating government bodies, such as the office of communications (Ofcom) and
the federal communications commission (FCC) in United kingdom and United
States, respectively. The wireless service providers can purchase the license
to exclusively utilize a band of certain frequencies within a large geographic
region. Under the current policies, the license holders have the right to use
the licensed spectrum only and it is forbidden to utilize the other spectrum
frequencies regardless of their occupancy status.
Due to the mentioned government regulations, the spectrum scarcity
is becoming a critical issue. On the contrary, recent spectrum occupancy
measurement studies are illustrating a different story about the spectrum
uti-lization. Interestingly, the spectrum policy task force (SPTF) within the FCC
effi-Figure 1.1: A bar chart illustrating the spectrum occupancy measurements evaluated between 30 MHz to 3 GHz for seven different locations in the United States. Adapted from [2].
ciency ranges between 15% to 85% [1]. Following this, the spectrum occupancy
measurements were done in different counties in order to attain a clear
pic-ture of the actual spectrum utilization in the urban environment. The main
objective of all these studies was to find those spectrum bands that have low
occupancy and have more chances to be reused for other purposes.
A measurement study was done in [2], where the average spectrum
utilization of each frequency band between 30 MHz to 3 GHz is analysed
for seven different locations in the United States as shown in Fig. 1.1. It
was observed in Fig. 1.2 that majority of the cities have attained average
occupancy less than 25%.
In [3], a similar measurement campaign was done in Germany. It was
observed that spectrum is nearly 100 % utilized between 20 MHz - 3 GHz
[image:25.595.142.494.109.338.2]Figure 1.2: Overall spectrum occupancy measured at seven different locations in the United States. Adapted from [2].
the spectrum occupancy for indoor locations is around 32% between 20 MHz
- 3 GHz. Another measurement study took place in Singapore in [4] for the
frequency bands between 80 MHz - 5.85 GHz, where it was found that GSM
900 is the busiest band. It was also noticed that radar bands and ISM bands
have low spectrum occupancy and contain abundant spectrum opportunities.
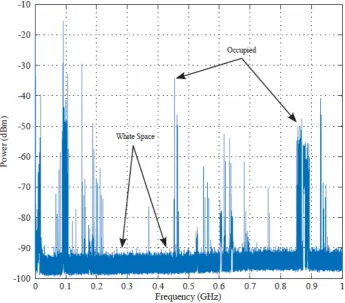
A survey of the spectral usage was also conducted in Kansas, USA [5].
The measurements were done between 9 kHz - 1 GHz as shown in Fig. 1.3.
It was observed that majority of the spectrum is sparsely utilized. The white
spaces in Fig. 1.3 can be reused to increase the spectrum utilization. Another
study was performed in the outdoor environment at Barcelona between 75
MHz - 3 GHz for two days. The average spectrum occupancy was observed
to be 22.57 % between 75 MHz - 3 GHz. It was also observed that cellular
bands: GSM 900 and UMTS have very low utilization of about 2.86 % [6].
In all these studies, it was concluded that spectrum scarcity is caused
due to two reasons (a) static spectrum allocation policies defined by the
regu-latory bodies and (b) the inefficient utilization by the license holders. In order
to bridge the gap between spectrum underutilization and spectrum scarcity, a
Figure 1.3: The relationship between the average power (dBm) and the frequency range between 9 kHz - 1 GHz using the spectrum occupancy measurements attained at Lawrence, Kansas, USA. Adapted from [5].
was proposed by Mitola [7]. A complete overview of the CR technology is
presented in Section 1.2.
1.2
Cognitive Radio
In Mitola’s proposed CR network, there is a primary user (PU) who has license
(permission) to work in a certain spectrum and a secondary user (SU) who
has no spectrum license. CR enables the SU to build transmission links using
vacant PU channels such that there is minimum interference between primary
in a dynamic manner. Cognitive radio (CR) is formally defined in [8] as:
Cognitive radio is an intelligent wireless communication system that is
aware of its surrounding environment (i.e., outside world), learns from the
en-vironment and adapt its internal states according to the statistical variations in
the incoming RF stimuli in real-time, with two primary objectives in mind (a)
highly reliable communications whenever and wherever needed and (b) efficient
utilization of the radio spectrum.
There are two main characteristics of CR that can be derived from this
definition:
• Cognitive capability: refers to the ability of radio technology to attain
information from the radio environment.
• Reconfigurability: refers to the dynamic programming of the radio
ac-cording to the environmental conditions [9].
The cognitive capability and reconfigurability together are responsible for
at-taining self-healing and adaptable cognitive network architecture. It is further
explained in Section 1.2.1.
1.2.1 Overview of cognitive radio networks
In this section a brief overview of the cognition cycle, cognitive radio
net-work (CRN) topologies, spectrum sharing modes and the spectrum access
techniques is presented.
Cognition Cycle
There are four main functionalities of CR that must be performed continuously
in order to ensure the maximum protection to PU activities. The tasks in a
• Spectrum sensing: refers to the detection of unused spectrum spaces
without creating harmful interference to the primary users. Spectrum
sensing classifies the spectrum space either as
– white space, one which is completely empty, except for noise. The
white spaces are also referred as spectrum holes in literature
– gray space, one which is partially occupied by interfering signals
– black space, one which is fully occupied by the communication
sig-nals, interfering signals and the noise.
• Spectrum allocation: refers to the selection of the best available spectrum
channels according to the user communication needs.
• Spectrum mobility: refers to fulfilling the user requirements for providing
seamless communication while switching the spectrum channels.
• Spectrum sharing: refers to those scheduling methods that ensure fair
spectrum allocation among coexisting users.
Network topologies of cognitive radio
Cognitive radio networks can have centralized or distributed topology. The
centralized topology is the one, where a central node coordinates spectrum
sensing, allocation and management among all other nodes. On the contrary
in distributed topology, the nodes communicate with each other in an adhoc
manner. The CRN network topologies can be chosen according to the desired
application as each topology has its own advantages and disadvantages. The
distributed topology has more computational complexity per node but has less
in the case of centralized topology but it incurs more infrastructure costs as
each node shares its sensing results to the central controller [11].
Spectrum Sharing modes
Using either distributed or centralized topology, the results of the spectrum
sensing schemes are severely degraded in reality due to multipath fading and
shadowing. In order to improve the detection performance, cooperative
trum sensing (CSS) is encouraged in literature [12], [13]. In cooperative
spec-trum sensing, the specspec-trum measurements are evaluated by a group of CRs
and the variability of the signal strength rely on various locations. In other
words, the probability that all users experience the same fade is very low which
eventually decreases the interference to PU. It is expected that the sensing
re-sults for a group of CRs would be better than individual sensing. On the other
hand, CSS has its own disadvantages as it is more complex than individual
sensing due to the increased control traffic between the nodes. Also, the delays
incurred due to combining results decreases the time for data transmission in
the case of CSS.
Spectrum access techniques
The main objective of cognitive radio is to utilize the spectrum spaces using
dynamic spectrum access (DSA). DSA refers to the process of locating those
frequency bands and time slots, where CR can send/receive data without
causing any degradation to the performance of the PUs [14]. In order to cause
minimum interference to the PU, CR adopts one of the following spectrum
access techniques given as
• Interweave Access: it is often termed as the interference avoidance mode.
tech-Figure 1.5: Dynamic spectrum access in an interweave mode. Adapted from [1].
niques and uses them for data transmission. The SU should leave the
channel, when the PU reappears. The concurrent data transmission from
both SU and PU is not allowed. This leads to the forced termination of
the SU connection (if there is no other available channel for the SU).
This scheme is often named as opportunistic spectrum access (OSA) as
shown in Fig.1.5.
• Underlay Access: refers to a technique where SU shares the spectrum
with PU, as long as its signal remains below the interference temperature.
The acceptable interference temperature refers to the average power that
can be tolerated as an interference by the PU receiver [15], [16]. This term
was introduced by FCC for ’quantifying and managing interference’ [17]
and is given as
TL=
PL
[image:32.595.149.503.113.357.2]where PL represents the average interfering power in bandwidth W, k
represents the Boltzmann constant and k = 1.38∗10−23J/K. If TL is
set for a specific frequency bandwidth W, then SU should ensure that
average interference power it generates remains belowkW TL.
• Overlay Access: refers to a technique where SU has the knowledge of the
PU’s transmitted data sequence (message) and how the data sequence
is encoded (codebook). The knowledge of the PU’s codebook can be
exploited by SU in various ways to improve the performance of both SU
and PU. This access mode is often termed as CR enabled cooperative
relaying [18]. The difference between underlay and overlay modes is
illustrated in Fig.1.6 and the comparison of three spectrum sharing modes
is presented in Table 1.1.
Using the knowledge of spectrum access techniques, it can be concluded
that white spaces can be used for interweaving that let PUs to operate in
unused regions, black spaces for overlaying where signals are processed in a
manner that makes the quality of transmission unimpaired by the SU and grey
spaces for underlying where SU ensures to keep the interference towards PUs
at a tolerable level.
1.2.2 IEEE Standard: 802.22
Currently, several cognitive radio systems are being finalized by
standardiza-tion bodies around the world. In the United States, the IEEE standardizastandardiza-tion
committee has worked on IEEE 802.22, where CR system is dealt as a wireless
regional area network (WRAN). The WRAN architecture is proposed for very
high frequency (VHF) and ultra-high frequency (UHF) ranges between 54-869
access the unused bands in the TV white spaces, where PUs represent the
analogue digital TV channels and low power wireless microphone signals [19].
The operation of the secondary user in IEEE 802.22 WRAN is divided
into multiple consecutive frames in the time domain, where each
super-frame is further subdivided into multiple MAC super-frames. Each super-super-frame has
16 media access control (MAC) frames, where each MAC frame is of 10 ms
duration which is further subdivided into spectrum estimation and secondary
data transmission slot as shown in Fig. 1.7. The super frame structure is
pro-posed for ensuring PU protection and managing secondary data transmission
effectively [20].
IEEE 802.22 proposes centralized architecture, where each SU in the
WRAN senses the spectrum to analyse the presence of the PU and sends the
sensing results to the fusion centre (802.22 base stations). The fusion centre
accumulates all the sensing results from various secondary users and makes
a final decision regarding the presence/ absence of the PU. The final sensing
result will be sent to the SUs by the base station.
Though IEEE 802.22 has been proposed as the first CR based
interna-tional standard, there are many other IEEE standards such as IEEE 802.11,
IEEE 802.15 and IEEE 802.16 that include some degree of CR technology
for attaining dynamic spectrum access and coexistence. Many of these
stan-dards include dynamic frequency selection (DFS) and transmit power control
(TPC) for the purpose of facilitating spectrum sharing. There are many
fea-tures in IEEE 802.22 that are adopted from IEEE 802.16 and IEEE 802.16e
standards such as physical, MAC and quality of service (QoS) features. The
frame structure of IEEE 802.22 is also an extension of the IEEE 802.16 and
IEEE 802.16e frame structures [21]. A comparison of IEEE 802.22 standard
Figure 1.7: A Superframe structure having a duration of 160 ms, where each super-frame has 16 super-frames and every individual super-frame consumes 10 ms. Adapted from [20].
802.16 is presented in Table 1.2.
1.2.3 Potential applications of cognitive radio
Although the most common application of CR is in the TV white spaces;
where CR enabled SUs opportunistically utilize the unused spectrum without
interfering with PUs of spectrum, namely TV transmitters. Apart from this,
they can be used for the following:
• Cognitive radios can possibly be used to provide ’data boost’ by
oppor-tunistically offloading the traffic of the existing PUs to the white spaces.
In this manner, CRs can help to alleviate high loads on the cellular
net-work and meet the quality of service (QoS) requirements of the delay
sensitive traffic like voice, streaming and video etc [23].
• The usage of wireless technologies like Bluetooth, Infrared and WiFi
has been increasing in every home and it has eliminated the need of
wired communication. The problem associated with majority of these
technologies is that they are not designed to operate in coherence with
each other and causes interference to the receivers, which are not part
of several wireless technologies. A cognitive digital home can operate
on white spaces in the unlicensed bands to carry control information
between devices [24], [25]. A cognitive home can be the solution for all
the interference issues due to multiple competing technologies.
• CR can be used for vehicle to vehicle communication networks, where
each vehicle can have CR and form a peer to peer network with other
vehicles around. This configuration can be used for sending traffic alerts
Network type Industry standards Frequency Max data rate Range PAN IEEE 802.15 2.4 GHz 10 Mb/s 20-50 m
LAN IEEE 802.11 a 5 GHz 54 Mb/s 20 m
LAN IEEE 802.11 b 2.4 GHz 11 Mb/s 33m
MAN IEEE 802.16 ¡ 2.4 GHz 54 Mb/s 1-2 km
RAN IEEE 802.22 54 - 862 MHz 6 - 31 Mb/s 30 km Table 1.2: The comparison of IEEE 802.22 wireless radio access network (WRAN) to the other popular wireless standards. Adapted from [22].
1.3
Thesis Outline
1.3.1 Research Motivation
Although cognitive radio networks have been extensively researched as a
po-tential candidate for mitigating the spectrum scarcity and increasing spectrum
utilization, there are still a lot of problems that need to be addressed.
First of all, in order to utilize the spectrum effectively with minimum
interference to PUs, the SU needs to sense the spectrum efficiently with less
chances of error. The reliable spectrum sensing is only guaranteed using the
conventional spectrum sensing techniques when signal-to-noise ratio (SNR) is
high, however the detection performance degrades, otherwise. For combating
this problem, the cooperative spectrum sensing is encouraged. In CSS, the
local sensing is performed at each SU and the individual results are sent to
the data fusion centre via common control channel [26]. A data fusion
cen-tre combines energy measurements from all cooperating cognitive radios to
make a final detection decision. In order for CSS to be operative, the
lo-cal measurements sensed by each radio should be weighted according to their
reliability during data combining. This is because; the received SNR value
realis-tic scenarios. It was observed in [27] that CSS outperforms the standalone
energy detector. Similarly [28] derived optimal and sub-optimal weights for
a linear combination of measurements in the data fusion centre. A popular
weighted energy combining method using CSS is proposed in literature known
as ’weighted linear combining (WLC)’. This scheme determines the optimal
weighting vector using a heuristic technique proposed in [29] which minimizes
the probability of detection error. However there is still a need for
investi-gating self-managing, self-configuring energy based combining techniques that
can adapt according to the time varying nature of the wireless channels. For
that, the bio-inspired approaches, with appealing features like self-adaptation,
autonomy and collaborative decision making abilities, can be investigated to
address the complexity of the CSS systems. Furthermore, the optimal weights
attained for CSS in literature deals with the linear PU signals, however in
reality, the PU signal may suffer from non-linear distortions. Therefore, there
is a need to consider both linear and non-linear PU signals for CSS
analy-sis. Apart from spectrum sensing, there is a need to investigate spectrum
allocation method based on spectrum sensing results that can ensure conflict
free spectrum allocation. A common method used for spectrum allocation in
literature is color-sensitive graph coloring (CSGC) [30]. Three evolutionary
algorithms are presented in [31] that outperform CSGC by attaining higher
value of the spectrum allocation rewards compared to CSGC. However there
is a still a need to analyse the self-adaptable algorithms that can converge
quickly and can attain higher value of the spectrum allocation rewards at the
same time.
Secondly, many studies have been performed to understand the
spec-trum occupancy statistics. For instance, the statistical and spectral occupation
the traffic density in all frequency bands. In [33], auto-regressive model was
used to predict the radio resource availability using occupancy measurements
in order to achieve uninterrupted transmission of the secondary users.
Sim-ilarly, in [34] - [36], the occupancy statistics were utilized to select the best
channels for control and data transmission purposes so that less time is
re-quired for switching transmission from one channel to the other for the case,
when the PU appears. All of the aforementioned works have evaluated the
spectrum occupancy models by using conventional probabilistic or statistical
tools. These tools are often limited to the assumptions required to derive their
theories. For example, one has to determine whether the value is a random
variable or a random process in order to use the probabilistic and statistical
tools. Therefore, there is a need to investigate spectrum occupancy using those
techniques that do not have prerequisites on data. The correct modelling of
the spectrum occupancy can yield to better spectrum sensing.
Furthermore, the energy consumption due to radio frequency (RF)
de-vices is increasing exponentially with an increase in the usage of wireless
ap-plications. It is reported that the energy consumption of the information
and communications technology (ICT) infrastructure is increasing 16 - 20 %
approximately per annum and generates about 2 % of the worldwide CO2
emissions [37], [38]. Therefore, it is important to optimize the energy
effi-ciency of the wireless networks as it will not only cut the overall cost of the
network but will also decrease the adverse effects on the environment. Energy
harvesting devices could be a potential source of energy. In particular, radio
frequency (RF) energy harvesting is an upcoming technology that allows
am-bient RF signals to be collected by an antenna and converted into DC power
using a rectifier [39]. For making CRN efficient, it was proposed in [40] to allow
mobile devices using harvested energy from ambient sources such as solar,
wind, and kinetic activities makes wireless networks not only environmentally
friendly but also self-sustaining. On the other hand, the amount of RF energy
that could be harvested changes with time and frequency. For example, there
are more mobile signals during the day than during the night time in
commer-cial areas. Thus, it is very important for RF energy harvesters to choose the
right operating time and frequency for harvesting maximum energy.
Last, but not least, energy harvesting in CRN is a hot research topic
and the majority of the literature investigates those energy harvesting CRN,
where the SU harvests energy from the nearby PU or transmits information,
if the PU is far away [41], [42]. There are also few studies that encourages
cooperation between PU and SU [43]- [45]. All these works assumed that
the PU does not have any energy harvesting capability. Therefore, there is a
need to investigate the framework where PU can also have energy harvesting
capability and can get benefit from the presence of SU.
1.3.2 Chapter Outlines
Motivated by the above observations, the performance of the cognitive radio
network is analyticity evaluated in this thesis, while taking several realistic
conditions into account. Numerical results and discussion are presented to
evaluate the performance of the algorithms. The introduction and conclusion
sections are presented in each chapter to provide readers with overall
sum-maries of the chapters. The thesis is organized as follows.
In Chapter 2, a comprehensive overview of the spectrum sensing
al-gorithms is presented. Then, a detailed description of the machine learning
(ML) framework and bio-inspired techniques is presented. Also, the previous
the cognitive radio network is illustrated. Finally, an overview of the energy
harvesting techniques and wireless energy transfer methods are discussed.
In Chapter 3, a collaborative spectrum sensing and allocation
frame-work using bio-inspired techniques is proposed which provides an optimal
weighting vector for the data fusion centre. Three bio-inspired algorithms:
firefly algorithms (FFA), fish school search (FSS) and particle swarm
opti-mization (PSO) are used in this chapter, where FFA and FSS have not been
used for both collaborative spectrum sensing and allocation before. In order to
analyse the practical CSS systems, both linear non- linear primary user signals
with interference and fading losses are considered. Furthermore, a spectrum
allocation approach based on the optimal weighting vector evaluated by the
data fusion centre is proposed that outperforms the conventional method in
literature by attaining higher value of the spectrum allocation awards.
In Chapter 4, the machine learning algorithms are utilized to investigate
and classify the spectrum measurements taken at the University of Warwick
in order to gain an insight of the spectrum occupancy. Machine learning
plays a vital role in the artificial intelligence (AI) field, where algorithms are
implemented to analyse data using past experiences. Machine learning refers
to a paradigm, where an algorithm learns from the inputs in a manner that its
expected future performance improves. The machine learning algorithms are
often heuristic, as they do not have any prerequisites or assumptions on data.
As a result, in many cases, they provide higher accuracy than conventional
probabilistic and statistical tools. Three supervised algorithms, naive Bayesian
classifier (NBC), decision trees (DT), support vector machine (SVM), and one
unsupervised algorithm, hidden markov model (HMM) are used in Chapter 4
to classify the occupancy status of the time slots. The classified occupancy
a new technique that combines SVM with fire fly algorithm (FFA) is also
proposed that outperforms all supervised and unsupervised algorithms.
In Chapter 5, the energy prediction framework is proposed for choosing
the optimal frequency and time for harvesting maximum energy. Most
cur-rent works assume a theoretical framework for analysing energy profile, where
majority of the models can be utilized for the management of energy efficient
networks using the given set of conditions. However none of the previous works
considered the real time measurements from practice to estimate the amount
of energy, that can be harvested using the prior knowledge. Two machine
learning techniques: linear regression (LR) and decision trees (DT), are
em-ployed in Chapter 5 to predict the optimal frequency and time for harvesting
the maximum energy using low and medium-efficiency harvesters.
In Chapter 6, the performance of an energy harvesting CRN is
anal-ysed, where it is assumed that PU is a wireless powered system with energy
harvesting capability. In wireless powered communication (WPC), the power
is sent first to the PU from an access point (AP) and further PU uses the
harvested power for sending the information. It is proposed in Chapter 6 that
SU sends data while PU is harvesting power from the AP. In this manner, PU
gets chance to harvest some energy from the SU data transmission as well.
Using this notion, PU gets benefit from the SU without allocating extra
re-sources. Also, SU coexists with the PU and changes its strategies in a manner
that bring advantages to the PU. The proposed strategy is compared with
the conventional energy harvesting CRN, where PU does not have any energy
harvesting capabilities. It is shown in Chapter 6 that proposed methodology
outperforms the conventional energy harvesting CRN.
Finally in Chapter 7, the research results and analysis are summarised.
Chapter 2
Background and Literature
Review
2.1
Introduction
With an increasing usage of dynamic mobile applications, it is becoming
im-portant for wireless devices to learn from environment. Cognitive radio (CR)
is one of the pioneer technologies that propose to learn from surroundings.
Apart from the environment awareness, CR should have capability to
remem-ber, judge and analyse the given situation. This will help CR to forecast
the network resources by analysing network load, location and user’s
mobil-ity. Learning from previous experiences can make the decision process and
adjustment of transmission/ reception parameters faster in the CR systems.
An intelligent CR architecture has three important stages [46]:
• Perception: refers to the ability of sensing environment and acquiring
data. The fundamental block to attain environmental awareness in CR
detect spectrum holes. An extensive overview of the spectrum sensing
techniques is presented in Section 2.1
• Learning: refer to those steps that help to extract knowledge using the
information acquired from the RF environment For example, the PU
status (presence/ absence) is learnt using the data attained from the
environment.
• Reasoning: that deals with the ability to use the knowledge for taking
actions according to the given policies and conditions. Spectrum
alloca-tion is an example of reasoning, where the frequency channel would be
allocated to SU after evaluating PU status. The machine learning and
bio-inspired intelligent algorithms are utilized in this thesis for learning
and reasoning. They are further explained in Section 2.2.
In order to acquire perception, learning and reasoning, a lot of
compu-tations are required to be done by CR that consumes energy. For making CRs
energy efficient, a novel energy harvesting approach is also presented in this
thesis. The overview of the energy harvesting cognitive radio networks and
the wireless energy transfer methods is presented in Section 2.3.
2.2
Perception
The process of getting awareness about the PU signals in a given geographical
area at a given time is referred as perception. This is a challenging task,
because the detection should be done at SUs independently without causing
any external interference to the PUs [23]. In the simplest form, the received
yi(j) =xi(j) +wi(j) (2.1)
where xi(j) represents the PU signal (x(t)=0, when PU is not transmitting)
andwi(j) represents the additive noise respectively. Specifically, it is assumed
that
wi(j) = gi(j) +fi(j) (2.2)
wheregi(j) andfi(j) represents the white Gaussian noise and additive
interfer-ence, respectively. A single detector must decide between the two hypotheses
(2.3)
yi(j) =
wi(j), H0,
xi(j) +wi(j), H
1,
The spectrum sensing performance is measured using two parameters
• Probability of false alarm: Pf a = Pr(H1|H0), that refers to the
prob-ability when SU mistakenly detects the presence of PU, however it is
absent.
• Probability of detection: Pd = Pr(H1|H1), represents the probability
when SU detects the presence of PU correctly.
These two probabilities are not independent, however they are linked by a
function, which illustrates the detector performance, called as receiver
operat-ing characteristic (ROC). The ROC curve expresses the dependency between
Pf a and Pd for a given detector [47], [48]. Some authors also use, the
proba-bility of missed opportunity, Pmo = Pr(H1|H0) = Pf a and the probability of
mis-detection Pmd = Pr(H0|H1) = 1−Pd, as the performance metric in the
literature. UsingPf a and Pd, three classes of spectrum sensing systems can be
• conservative, if Pf a >0.5 andPmd<0.5
• aggressive, if Pf a <0.5 and Pmd <0.5
• hostile, if Pf a <0.5 and Pmd >0.5.
A conservative system has small probability of interference with PU as it has
high value ofPf a, hence small spectrum utilization rate. An aggressive system
has high spectrum utilization rate and small probability of interference. A
hostile system has low value ofPf a, with a large probability of interference [23].
Depending on the system model and the sensing quality, the sensing algorithms
can be chosen. There are some sophisticated spectrum sensing methods used
in the literature discussed as follows:
2.2.1 Energy Detection
In this method, the energy of the received signal is compared with a decision
threshold (λ), determined by the noise level [49]. Let yi(j) represents the
received signal at the SU, the decision metric Y can be computed using N
received samples, given as
Y = 1
N N−1
X
i=0
|yi(j)|2 (2.4)
where yn represents the received signal and it can be in time-domain or
fre-quency domain. The binary testing hypothesis using energy detection can be
formulated as
(2.5)
status=
Y < λ, H0,
Y > λ, H1,
There is no fading assumed in this model except the additive noise that is
variance E[|wi(j)|2]. The performance of the energy detector is dependent
on the estimation of noise variance in the model. This is because, the test
statistic (Y) is compared with decision threshold, where decision threshold is
dependent on the observed signal model, hence on the noise variance.
Energy detector has low detection performance when the noise
vari-ance is unknown to the receiving node. An error on the estimate of the noise
variance affects the performance of the detector, which becomes vulnerable to
noise power inaccuracies. When the signal-to-noise ration is very low, it would
be hard to distinguish between the radio signal and noise signal, therefore the
prior knowledge of the noise power can be used to improve the detection
per-formance of the energy detector. If the noise power level is perfectly known at
the receiver, the energy detector can work with arbitrary values of probability
of detection and probability of false alarm, even in low SNR regimes, by using
a sufficiently long observation time.
In summary, it can be concluded that energy detection has low
com-putational complexity and works well if two prerequisites are already been
achieved (a) the noise must be statistically stationary and (b) noise variance
is known to the detector [50].
2.2.2 Coherent Detection
This method assumes that PU signal is fully known at the receiver. The prior
knowledge about the features of the primary signals (such as modulation type,
pulse shape, data rate or statistical properties) can be used for increasing
the performance of the spectrum sensing detection. Provided the received
signal is yi(j) = xi(j) + wi(j), the demodulation of the PU signal (xi(j))
can be coherently done once timing and carrier synchronization sequences are
for the case having no interference and having stationary Gaussian noise only.
However the filter consists ofhxi(j), for the case when fading is present in the
model, where h represents the fading coefficient known at the receiver. The
maximum -likelihood of the received signal obtained after sampling is given as
Y = 1
N N−1
X
i=0
yi(j)xi(j)∗ (2.6)
wherexi(j)∗ represents the conjugate of xi(j) andN represents the total
num-ber of samples, where n = 0,1,2, .., N −1. The SNR of the matched filter
output, is γ = σP2
w, where σ
2
w represents the average noise power and P
rep-resents the average signal power under the assumption that primary signal is
stationary and the sensing timeN is long enough given as
P = 1
N N−1
X
i=0
|xi(j)|2 (2.7)
This technique has better detection performance than energy detection and
consumes less time [51], [52]. However, it needs complete knowledge of the
PU signal, which is impractical in reality [53]. Also, the synchronisation
be-tween the PU signal and the detector is a prerequisite for good performance in
this technique because synchronisation errors can severely degrade the
perfor-mance. In order to detect different kinds of the PU signal, the correlation of
the received signal needs to be computed with different signal patterns, which
eventually will increase the implementation complexity and power
consump-tion.
2.2.3 Feature detection
In practical wireless communication systems, the transmitted signals have
be evaluated by exploiting the second order statistics of the received signals,
where in special cases the signals show cyclostationary properties. Two feature
detection schemes are explained as follows:
Cyclostationary-based detection
In reality, coherent detection is difficult to implement because it is cumbersome
to attain the complete knowledge of the PU signal. However, some features of
the PU signal can be used for defining the test static. For example, modulated
signal can be distinguished from the noise because most of the modulated
sig-nals are not stationary, however they are cyclostationary. The cyclostatioarity
refers to the property, where the mean and the autocorrelation function are
the periodic functions of time [54]. In this scenario, the cyclic autocorrelation
function (CAF) of the received signal can be analysed. Generally, the CAF
is periodic for the data signals but aperiodic for the noise signals [55], [56].
Consider a linearly modulated signalxi(j) = P
nang(t−nT0), whereT0
repre-sents the symbol periodg(t) is the modulation pulse and an is assumed to be
independent and identically distributed wide sense stationary data sequence
with zero mean and autocorrelation, rn−m = E[ana∗m]. The autocorrelation
function forx(t) is given as
(2.8)
Ax(t, τ) =
X
n X
m
rn−mg(t+τ −nT0)g∗(t−nT0)
As Ax(t, τ) in (2.8) is a periodic function of t with period T0, so it can be
represented using Fourier series as
Ax(t, τ) =
X
n
Aαx(τ)e+j2παt, α= n
T0
where Fourier co-efficient (Aα
x(τ)) is defined as
Aαx(τ) = 1
T0
Z T20
−T0 2
Ax(t, τ)e−j2παtdt, α =
n
T0
(2.10)
The Fourier coefficient given in (2.10) represents the CAF of xi(j), where
α represents the cyclic frequency and α = 0 represents the autocorrelation
of xi(j). The cyclic spectral density (CSD) of x(t) is defined as the Fourier
transform ofAαx(τ):
Sxα(f) =
Z ∞
−∞
Aαx(τ)e−j2πf τdτ (2.11)
The CAF can be used for detecting the presence of PU usingAα
x(τ), provided
that SU knows theT0 of the PU signal. In contrast to the energy detector, the
CSD detector can differentiate the PU’s signal from the noise and the
interfer-ence signals. The computational complexity of this technique is higher than
energy detector because managing the cyclostationary features of all possible
PUs is a complex task.
Autocorrelation-based detection
Signal autocorrelation is computed in this method in order to differentiate
the signal from the noise. Let the received signal be represented as yi(j) =
xi(j) +wi(j), then the sample autocorrelation matrix of yi(j) is given as
Ay =
1
N N−1
X
n=L−1
yi(j)[yi(j)]∗ (2.12)
When N → ∞, provided that signal is uncorrelated with noise and the noise
sequence is white Gaussian,Ay converges to autocorrelation ofyn given as
whereσ2
w represents the average noise power,Ax is the autocorrelation matrix
of the column vectorxi(j) and IL represents the identity matrix. When there
is no PU signal then Ay = σ2wIL. Different test statistics can be calculated
from the autocorrelation matrix. This technique has several algorithm options
depending on the test statistics choices that include: eigen value-ratio test,
maximum-eigenvalue test and minimum-eigenvalue ratio test. Each of them is
briefly discussed as follows:
• Eigen value-ratio test Assume ρmax and ρmin as the maximum and
minimum eigenvalues value ofAx, andµmax andµmin represent the
max-imum and minmax-imum eigenvalues ofAy, respectively, given as
µmax =ρmax+σ2w (2.14)
µmin =ρmin+σw2 (2.15)
where µmax
µmin = 1, represents the condition when there is no PU signal and
µmax
µmin >1, otherwise [57].
• Maximum-eigenvalue testConsidering (2.14), if there is no PU signal
thenρmax = 0, otherwise PU is present. In other words,µmax > σw2, when
PU is present whileµmax=σw2, otherwise [58].
• Minimum-eigenvalue ratio test This test statistic compares the
en-ergy of the signal (yn) with the minimum eigen value of Ay. If their
ratio exceeds a given threshold, then the primary signal is assumed to be
present [59].
This method is robust to noise uncertainty and needs no synchronization [60].
The advantage of autocorrelation based detectors is that they do not require
maximum eigen value detector can be used when noise variance is known [61].
The performance of the autocorrelation based detector is better than energy
detector when signal is correlated; however it matches energy detection when
the primary user is independent and identically distributed signal. Due to
autocorrelation computation, the complexity of this algorithm is higher than
energy detector.
The comparison of the detection schemes is presented in Table 2.1.
Fol-lowing the discussion, it can be concluded that the spectrum sensing technique
can be chosen according to the given scenario. Due to low computational
com-plexity, energy detection is chosen for the spectrum sensing in this thesis.
The complexity of the spectrum sensing receiver increases when
wide-band sensing is performed. For that case, the radio frequency components like
high resolution analogue to digital converters and high speed digital signal
processors with large operating bandwidth are required. Sensing frequency
that represent the number of times a cognitive radio should perform spectrum
sensing should be carefully adjusted. The optimum value depends on the
ca-pabilities of cognitive radio itself and the temporal characteristics of PUs in
the environment. The three spectrum sensing detectors differ each other in
terms of complexity and accuracy as shown in Figure 2.1 where it is clearly
observed that coherent detector is the most accurate detector with maximum
complexity. This is because coherent detector requires complete knowledge of
Comparison b et w een Sp ectrum Sensing T ec hniques T ec hnique Required Information σ 2 x Distinguish PU from Noise other signals Complexit y Energy Detector Y es No SNR dep endan t NO Relativ ely simple Coheren t Detector No Y es Y es Y es Maximise SNR but require sync hronization Cyclostationary Detector No Y es Y es Y es Complex pro cessing and high sensing time Auto correlation based Detector No No Y es Y es Some test
statistics require kno
Figure 2.2: Cognitive radio engine illustrating the relationship between the software radio, the knowledge base, the learning and the reasoning engine. Adapted from [46].
2.3
Learning and Reasoning
An intelligent CR is composed of a software radio, knowledge base, learning
and reasoning engine as shown Fig. 2.2. The knowledge base of the
cogni-tive radio system stores the basic information like SNR, bit error rate,
trans-mit power, coding rate and symbol constellation. The main objective of the
learning engine is to evaluate the input state that will optimize the objective
function, where the objective function depicts the goal of the application that
could be the maximization of the throughput or the minimisation of the
in-terference. The learning is mandatory in those situations, where the effect of
changing inputs on outputs is not known. The channel statistics can be
esti-mated using a learning engine which can be used for making optimal decisions
using reasoning engine [63]- [64]. A comprehensive overview of the learning
and reasoning engine using machine learning and bio-inspired algorithms is
2.3.1 Bio-Inspired Intelligence
Traditionally, AI has been focussed to imitate the cognitive abilities of the
human brain. However in last few decades, there has been emergence of the
new AI methods inspired from the biological processes such as the immune
system, colonies of ants, bees and swarm of birds, to mention just a few [65].
The bio-inspired approaches, with appealing features such as self-adaptation,
self-organization and collaborative intelligence, have been extensively applied
to complex problems nowadays. The two most dominant classes of bio-inspired
algorithms are evolutionary algorithms and swarm based algorithms, explained
as follows:
• Evolutionary algorithms: These methods take inspiration from the
fun-damental biological principle: survival of the fittest and deletion of the
poor solutions from the population. Each iteration evaluates the
ob-jective function for all individuals in a population and compares them.
The fittest individuals are selected for the next iteration. The popular
example is genetic algorithm and its variants [66]
• Swarm Based Algorithms: These methods exploit the coordination
prciples especially related to the distributed communication between
in-dividuals in nature. Each individual in this domain try to adjust its
position according to the location of the fittest individual in the
pop-ulation. Popular examples include bird flocking, ant colonies and fish
schooling [66].
An overview of the applications using evolutionary based algorithms and
2.3.2 Bio-Inspired Cognitive radio
Inspired from the biological systems, a bio-inspired radio access scheme is
pro-posed in [67], where the behaviour of the flock of birds swarming in search for
food is simulated. Another technique, artificial bee colony (ABC) optimization
is utilized in [68], for evaluating the optimal spectrum allocation matrix. It
was observed in [68] that proposed method has outcomes near to the optimal
values, which are calculated using exhaustive search. Similarly in [69], ant
colony optimization is utilized for spectrum detection and allocation in
multi-radio environment. In [70], a co-operative spectrum sensing method using
particle swarm optimization (PSO) is presented that results in higher
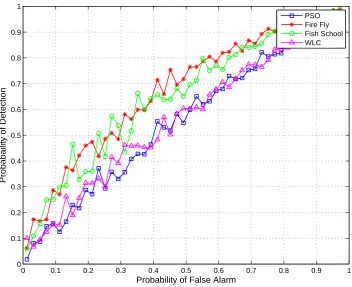
prob-ability of detection compared to the previous spectrum sensing techniques.
Further in [31], genetic algorithm (GA), quantum genetic algorithm (QGA)
and PSO are utilized for the spectrum allocation. It was observed in [31] that
all bio-inspired algorithms perform better than the traditional technique used
for spectrum allocation in the literature (color sensitive graph algorithm) and
specifically PSO outperforms both GA and QGA. A comparison between ABC
and GA is presented in [71] for the optimal spectrum allocation and it was
observed that ABC performs better than GA.
Although both evolutionary based algorithms and swarm based
algo-rithms have been extensively applied in the cognitive radio network but there
are still some complex problems that could be solved and optimized by
ex-ploiting the bio inspired algorithms. In this thesis, three bio-inspired
tech-niques: particle swarm optimization, fire fly algorithm and fish school search
are utilized for optimizing the collaborative spectrum sensing and allocation
in Chapter 3. Both particle swarm optimization and fire fly algorithm are
swarm based algorithms. They both exploit and explore the problem space to
highest probability of detection and for achieving fair spectrum allocation.
However fish school search is a hybrid algorithm, that inherits some
charac-teristic from both swarm based and evolutionary based algorithms. Both fire
fly algorithm and fish school search are not utlized for addressing CSS before.
It is observed in Chapter 3 that proposed algorithms performs better than
PSO (conventional swarm based scheme known in literature for achieving the
best spectrum sensing results in [70] and the best spectrum allocation results
in [31].)
2.3.3 Machine Learning
Machine learning is a pioneer field of the artificial intelligence, where
algo-rithms are implemented to analyse the data (input examples) based on the
previous experiences. There are three ways to learn from the input examples:
supervised learning, unsupervised learning and reinforcement learning [72] as
shown in Fig. 2.2 and explained as follows:
Supervised learning
In this method, a part of the data samples is used for training the objective
function. During training phase, a target value corresponding to each input
sample is directly mapped as an output. The main objective of the supervised
learning is to predict the future input-output observations with minimum error
by finding a deterministic function which maps any input to an output. The
recognition of the handwritten letters or digits is a popular example of the
supervised learning [72].
Supervised learning is of two types: classification and regression. In
classification, the output space can have discrete values. For example, the

![Figure 1.5: Dynamic spectrum access in an interweave mode. Adapted from [1].](https://thumb-us.123doks.com/thumbv2/123dok_us/9489150.454990/32.595.149.503.113.357/figure-dynamic-spectrum-access-interweave-mode-adapted.webp)