ISSN Online: 2169-2688 ISSN Print: 2169-267X
Optical-Elevation Data Co-Registration and
Classification-Based Height Normalization for
Building Detection in Stereo VHR Images
Alaeldin Suliman, Yun Zhang
Department of Geodesy and Geomatics Engineering, University of New Brunswick, Fredericton, Canada
Abstract
Building detection in very high resolution (VHR) images is crucial for map-ping and analysing urban environments. Since buildings are elevated objects, elevation data need to be integrated with images for reliable detection. This process requires two critical steps: optical-elevation data co-registration and aboveground elevation calculation. These two steps are still challenging to some extent. Therefore, this paper introduces optical-elevation data co-regis- tration and normalization techniques for generating a dataset that facilitates elevation-based building detection. For achieving accurate co-registration, a dense set of stereo-based elevations is generated and co-registered to their relevant image based on their corresponding image locations. To normalize these co-registered elevations, the bare-earth elevations are detected based on classification information of some terrain-level features after achieving the image co-registration. The developed method was executed and validated. Af-ter implementation, 80% overall-quality of detection result was achieved with 94% correct detection. Together, the developed techniques successfully facili-tate the incorporation of stereo-based elevations for detecting buildings in VHR remote sensing images.
Keywords
Building Detection, Very High Resolution Images, Optical-Elevation Data Co-Registration, Classification-Based Height Normalization
1. Introduction
Buildings are one of the most important classes in urban mapping. The current building distribution and development in a city are essential information for ur-ban analysis and planning [1][2]. The most cost-effective and broadly available How to cite this paper: Suliman, A. and
Zhang, Y. (2017) Optical-Elevation Data Co-Registration and Classification-Based Height Normalization for Building Detec-tion in Stereo VHR Images. Advances in Remote Sensing, 6, 103-119.
https://doi.org/10.4236/ars.2017.62008
Received: February 4, 2017 Accepted: June 6, 2017 Published: June 9, 2017
Copyright © 2017 by authors and Scientific Research Publishing Inc. This work is licensed under the Creative Commons Attribution International License (CC BY 4.0).
geo-spatial data for mapping building information are the very high resolution (VHR) remote sensed images. As a result, building detection in remote sensing VHR images has been an active area of research during the last two decades [3] [4][5].
VHR optical images are the two dimensional (2D) perspective projection of the three dimensional (3D) world; therefore, building heights play an important role in the reliability of the building detection process. Since the optical imagery and elevation data have complementary properties, co-registering these two datasets is an effective integration approach to make one data source compen-sates the limitations of the other one. However, several problems are introduced when such datasets are co-registered [6]. The misregistration between these different data sources is one of the most critical problems. Object-based ap-proaches are usually used to facilitate the integration and reduce the negative effect of the misregistration by changing the processing unit from individual pixels to a group of pixels (i.e., image segments/objects) [7]. Even so, this mis-registration problem is still serious for tall buildings appearing in off-nadir VHR images [8].
The most common sources for generating elevation information are the pho-togrammetric approaches and LiDAR (Light Detection and Ranging) technolo-gy. Both these sources provide the height information at the tops of surfaces such as buildings or trees. Hence, they result in digital surface models (DSMs). On the other hand, buildings are objects at heights above the ground; thus, height normalization is required to determine the aboveground heights. This process requires firstly extracting the terrain elevations to generate a digital ter-rain model (DTM). This elevation model is then subtracted from its corre-sponding DSM to calculate the normalized height above the ground that consti-tutes normalized digital surface model (nDSM). Unfortunately, extracting the DTMs from their corresponding DSMs is still a problem to some extent [9][10].
Many building detection methods have been published. These methods can be categorized into two classes: image-based and elevation-based methods. The most successful image-based building detection methods in VHR images are compared and analyzed comprehensively in [5]. These methods fail to reliably discriminate building roofs from parking lots when they are spectrally and spa-tially similar. This limitation results from not incorporating the elevation infor-mation which is the key component for reliable building objects delineation.
All of the elevation-based building detection methods, as reviewed in the lite-rature, encounter two challenges: the optical-elevation data co-registration and the aboveground/normalized elevation data calculation.
Regarding the first problem, in order to integrate the elevation data with the optical VHR image data, a co-registration is required. An accurate co-registra- tion without incorporating the sensor mode information is almost impossible especially in the cases of off-nadir VHR images with high rise buildings. As found in the literature, this co-registration can be achieved by four different ways: image-to-image registration, orthorectification, true-orthorectification, and the line-of-sight DSM (LoS-DSM) solution. All of these methods are de-fined, explained and reviewed extensively in [8]. Except for the LoS-DSM co-registration solution, it has been concluded that all of these methods have some limitations when off-nadir images acquired over dense urban environ-ments are employed. The LoS-DSM solution described in [8] is considered as the most promising and recent image-elevation co-registration method. It is based on projecting the DSM elevations from the object space to the image space. Al-though the solution has proven to be effective for building detection even in off-nadir VHR images, it calculates and projects full resolution (all image pixels) surface elevations. In this study, it is assumed that a subset of these elevations is sufficient to achieve successful building detection when the object-based detec-tion approaches are implemented.
The second problem is the DTM extraction from its corresponding DSM. Most of the reviewed algorithms in the literature regarding DTM extraction do not consider the availability of the relevant optical VHR imagery (e.g., [9][10] [13][14]). For this reason, the terrain extraction will not be reliable as it is in the case of incorporating image classification information.
work was presented in [15].
The rest of the paper is outlined as follows. The proposed elevation incorpora-tion method is described in Secincorpora-tion 2. The elevaincorpora-tion-based building detecincorpora-tion and its validation procedure are presented in Section 3. The datasets, results, and accuracy assessment are provided in Section 4. Finally, the conclusions are drawn in Section 5.
2. The Elevation Incorporation (EI) Method
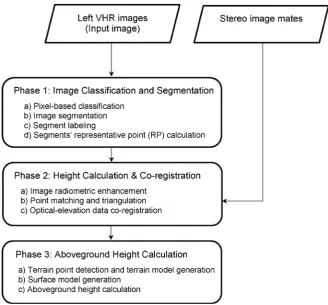
The proposed elevation incorporation (EI) method for stereo-based elevation data generation, co-registration, and normalization has three phases to achieve a dataset that is ready for building detection. The method starts in Phase 1 by processing the input image by pixel-based classification and image segmenta-tion. In Phase 2, the height information is photogrammetrically triangulated based on stereo images. In Phase 3, the aboveground heights are then calculated. After that, a building detection process can be executed. Further details on these phases are described in the following subsections.
2.1. Phase 1: Image Classification and Segmentation
This phase is proposed to combine the advantages of both pixel-based and ob-ject-based processing. It simply aims to produce classified image objects based on a pixel-based classification. This phase is extremely important when an ob-ject-based classification software package is not available and noise-free results are needed. In this phase, it is required to divide the image objects into two dif-ferent classes: terrain land-cover class (TLC class) and off-terrain land-cover and the land-use class (OLU class). While the TLC segments include the labels of water, soil land, and grass land; the OLU segments have the labels of trees (off-terrain land-cover) or urban areas (land-use) that include building roofs and traffic areas. The four steps involved in this phase are: 1) pixel-based classi-fication, 2) image segmentation, 3) segment labeling, and 4) segments’ repre-sentative points (RPs) calculation. All of these steps are described as follows:
1) Pixel-based classification—Pixel-based classification techniques are widely available and successfully used in land-cover mapping. However, their results usually suffer from salt and pepper noise. In contrast, object-based classification methods do not produce noisy results. However, the packages of these methods in the remote sensing software are expensive and narrowly accessible. Addition-ally, the methods depend heavily on the segmentation results which are the first step in all object-based image analysis approaches. Therefore, we propose gene-rating a bitmap for the TLC objects and another one for the OLU objects. These two bitmaps are obtained through a pixel-based classification. For higher accu-racy, a statistical classification technique is recommended. Thus, the Maximum Likelihood Classification technique described by [16] is selected to be imple-mented.
image segmentation technique is required to be executed. It is recommended in this study to apply the multiresolution segmentation technique as introduced in [17]. This technique, as concluded by [18], is one of the most appropriate tech-niques for segmenting VHR images of urban areas. The results of implementing multiresolution segmentation are usually vector format polygons. The shapes of these polygons depend critically on the selected segmentation parameters of scale, compactness, and smoothness. Trial-and-error method is usually followed until an acceptable result is achieved. Thus, to save time and achieve more accu-rate results, we recommend creating an over-segmented image by randomly se-lecting a small scale value to obtain small objects that are guaranteed not to in-clude two different classes.
3) Segment labeling—There is a very limited number of packages that offer object-based classification. Thus, we propose performing pixel-based classifica-tion and then transferring the labels of the identified classes to the result of ex-ecuting the image segmentation. This is easier to perform since pixel-based clas-sification techniques are relatively straightforward to program and hence several software tools provide these techniques. To transfer the classification result from the pixels to the image segments, each segment is classified based on the class related to the majority of the pixels contained within that segment (i.e., majority voting technique). If the employed image is over-segmented, the case of having several class minorities instead of one dominant class is avoided.
4) Segments’ RPs calculation—Once the generated image segments are clas-sified and given labels, a representative point (RP) that is guaranteed to be inside the segment boundary is required to be calculated based on the geometry of the segment shapes. For the regular segment shapes, this RP is the centroid that lies inside the polygon boundary. However, if the centroid lies outside the boundary, this RP point is replaced by the center of the greatest circle that fits inside the polygon as introduced by [19]. By working with these RPs instead of all the pix-els of the employed image, we reduce the computational cost tremendously.
When all of the four steps in this phase are executed, labeled segments (com-monly known as objects) for the TLC and OLU class objects along with their RPs are achieved.
2.2. Phase 2: Height Calculation and Co-Registration
Since the buildings are inherently elevated objects, the elevation data must be available. Photogrammetric approaches can be implemented to generate the needed elevation data. These data are usually in the form of DSMs that describe the elevation information of the visible surface.
(pixel and line coordinates) and the object-space (X, Y, and the elevation-Z). By having a dense set of matching point information, accurate optical-elevation da-ta co-registration can be achieved by assigning the derived ground elevation to its corresponding image location. Hence, the three steps for this phase are: 1) image radiometric enhancement, 2) point matching and triangulation, and 3) optical-elevation data co-registration.
1) Image radiometric enhancement—Since automatic image matching is going to be executed for generating dense matching points based on pixels’ brightness values, enhancing radiometric information of the employed stereo images will improve the quality of generating point matches. The recommended image enhancement is achieved by applying the Wallis adaptive filter as it is de-scribed in [20].
2) Point matching and triangulation—The matching points are required to be generated automatically by executing an image matching technique. Area-based pyramid matching, introduced in [21], is a well-established approach that is implemented by many photogrammetric software packages for dense matching due to its speed and accuracy. Hence, this matching technique is se-lected for this phase. Thereafter, the matched points between the stereo images need to be photogrammetrically triangulated to calculate their corresponding ground elevations.
3) Optical-elevation co-registration—Once the matched points are accu-rately generated, each image location (pixel and line) of these points is assigned the calculated ground elevation (Z). By doing that, a sub-pixel optical-elevation data co-registration is easily achieved.
2.3. Phase 3: Aboveground Height Calculation
In order to have elevation data that describe only the off-terrain surface for each image segment, the elevations generated in the previous phase need to be nor-malized. The normalization process is conducted by filtering out the rain-level effects. This process is commonly conducted by extracting the ter-rain-level elevations and then subtracting them from their corresponding surface elevations (i.e., the DSM elevations). However, terrain elevation extraction from DSM data is still a problem to some extent. Unlike the algorithms that only use the elevation information available in the DSM data, we propose exploiting the spectral or radiometric information available in the co-registered VHR image. Hence, the three steps involved in Phase 3 are: 1) terrain point detection and terrain model generation, 2) surface model generation, and 3) aboveground height calculation.
the terrain-level points are detected, a surface interpolation technique to gener-ate the DTM for the study area is applied.
2) Surface model generation—In the same manner as the previous step, all of the generated and co-registered elevations (including both TLC and OLU classes) need to be interpolated in the image space in order to generate a DSM. Since the elevations are co-registered accurately in the image-space, the resulting surface and terrain models are not orthogonal but represent a kind of line-of- sight elevation model. This is the key concept of accurate optical-elevation data co-registration.
3) Aboveground height calculation—Since the RPs of the OLU class seg-ments (the segseg-ments that represent the urban areas and trees) are generated, the information required now is the aboveground elevations of this class of seg-ments. We already have the co-registered and interpolated DTM and DSM of the study area. Hence, the elevations of the DTM can be subtracted from their corresponding ones in the DSM at the locations of the calculated segments’ RPs to compute the aboveground elevations. The resulting information represents the normalized/aboveground elevations at the RPs of the OLU class segments. These elevations help in distinguishing the elevated building-roof areas from terrain-level traffic areas even when the spectral and/or image-spatial informa-tion of these two different urban classes is very similar.
[image:7.595.208.537.414.719.2]The whole EI method developed in the previous sections is flowcharted in Figure 1. The figure shows the three phases along with their involved steps.
3. Building Detection and Validation Procedure
3.1. Elevation-Based Building Detection
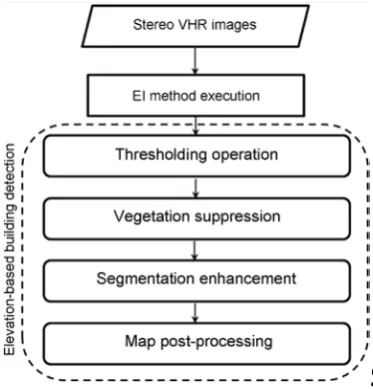
After executing the EI method, the complexity of the VHR image employed is re-duced by image segmentation. This complexity is further rere-duced by applying im-age classification to categorize these imim-age segments into two different classes: TLC segments (i.e., terrain land-cover class) and OLU ones (i.e., off-terrain land-cover and the land-use class) as described earlier. After that, the four steps of the elevation-based building detection illustrated in Figure 2 can be implemented:
Step 1:Thresholding operation—The RPs of the elevated objects can be easily dis-tinguished from the terrain objects by applying a thresholding operation. This opera-tion is simply executed by selecting empirically a threshold value, for instance, of one building floor (e.g. 3m) to detect off-terrain objects (represented by their RPs) since we already excluded terrain effects and achieved the normalized elevation data.
Step 2: Vegetation suppression—The detected elevated objects may represent building roofs or trees. Therefore, this type of vegetation must be re-moved from the detection result. Fortunately, vegetation objects can be easily detected using vegetation indices based on the spectral information of VHR im-ages. A comprehensive list of different vegetation indices is presented and inves-tigated in [22]. Among these ones, the Normalized Difference Vegetation Index (NDVI) is selected in our study.
[image:8.595.280.467.513.708.2]Step 3: Segmentation enhancement—Once the elevated non-building jects are removed, the remaining elevated objects should represent building ob-jects. This result usually needs to be post-processed because most of the building roofs have been over-segmented into small objects. In this case, we propose to enhance the segmentation results by optimizing the segmentation parameters and then merging the existing segments based on a supervised segmentation technique. Reference [23] developed a supervised segmentation software tool for semi-automatic determination of the optimal parameters of the multiresolution
Figure 2. The flowchart for elevation-based
segmentation. This software tool is called Fuzzy-based Segmentation Parameter optimizer (FbSP optimizer). The tool takes the segmentation parameters for a manually segmented object and calculates automatically the optimal values for the automatic segmentation parameters that produce the results close to that generat-ed manually (i.e., supervised segmentation). In this study, we recommend taking advantage of this tool to achieve better segmentation results in urban areas.
Step 4: Map post processing—The proposed finishing step includes merging all of the detected edge segments and then assigning to the building roof objects all of the polygons surrounded completely by the detected edge objects. A few morphological functions (e.g., opening and closing functions) might be required to be executed. Some misdetected objects of small size can be easily removed based on applying an area-based threshold. At this point, an accurate and relia-ble building mapping should be achieved.
3.2. Accuracy Assessment
The quality of the detection should be evaluated. The commonly used building detection performance measures are completeness, correctness, and overall quality. Completeness is the percentage of entities in the reference data that were detected automatically, while correctness indicates how well the detected entities match the reference data. On the other hand, the overall quality of the results provides a compound performance metric that balances completeness and cor-rectness. The formulas of these three measures are described in [24] as follows:
(
.)
(
)
Completeness Comp =TP TP+FN (1)
(
.)
(
)
Correcteness Corr =TP TP+FP (2)
(
.)
(
)
Overall Quality OQ =TP TP+FN+FP (3)
where the true positive (TP) is the number of building objects available in both detection result and the reference data. The false negative (FN) is the number of building objects in the reference dataset that are not detected automatically. The false positive (FP) represents the number of building objects that are detected but do not correspond to the reference dataset. It is worth mentioning that the accuracy assessment can be pixel-based or object-based. In this study, the defini-tion for the performance measure entities in this study represents the total number of pixels that are labeled as roof (i.e., the total area in pixel units) as recommended in [24][25].
4. Datasets, Results, and Accuracy Assessment
4.1. Test Data
(a) (b) (c)
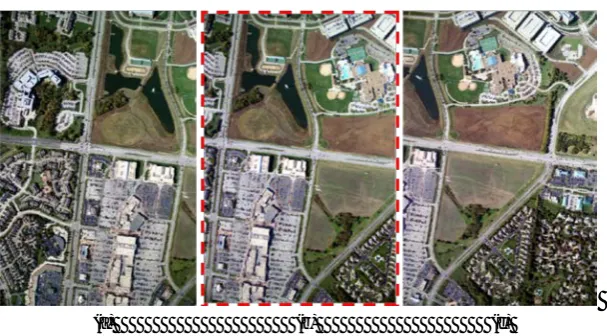
Figure 3. Test data used for the study: Three VHR airborne stereo images—(a),
(b), and (c)—acquired in a sequence. Test/input image used for detecting the buildings is the image (b).
As can be seen, these images contain natural land cover and man-made land use areas. The urban area in the images is with buildings of different sizes and with traffic areas of spectrally-spatially similar properties to building roofs. The land-cover features of the ground-level include soil lands, grass lands, and water bodies.
4.2. Experimental Results
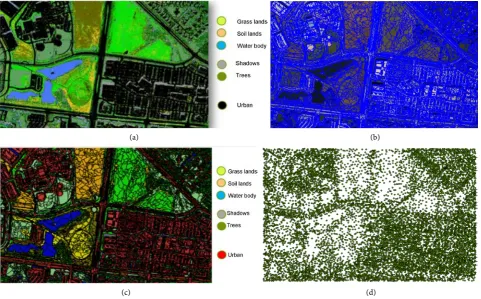
4.2.1. Results of the EI MethodThe EI methodwas implemented as described in Section 2. In Phase 1, all the image processing steps were executed. The pixel-based classification in the first steps was implemented on the image (b) of Figure 3 using the Maximum Like-lihood Classification technique. Then, this image was classified into six classes as shown in Figure 4(a). These classes are grass lands, solid lands, water bodies, shadows, trees, and urban areas. The same image was also over-segmented using the multiresolution segmentation as illustrated in Figure 4(b). The selected scale value for the segmentation was 25. After that, the classes generated in the first step were transferred to the generated image segments based on the predomi-nant class of the pixels falling within each segment. The class labels of the seg-ments are shown in Figure 4(c). The distribution of the calculated RPs of the generated image segments are shown in Figure 4(d). These RPs are guaranteed to be inside/within their corresponding segments.
In Phase 2 of the developed EI method, the conventional photogrammetric approach was executed. The contrast of the test image was first enhanced by ap-plying the Wallis adaptive filter. This filler improved the quality of the automat-ically detected matching points and increased their count from 2000 to 11,000 points (i.e., more than five times). The Root-Mean-Square-Error (RMSE) value of these matching points was less than one pixel.
Figure 5, an example of the optical-elevation data co-registration is presented. After image segmentation, the same figure shows an image segment along with its RP centroid location.
The grid pattern of point distribution was selected for the generated matching points as illustrated in Figure 6(a). Following that, based on the classification result in the first phase, the co-registered matching points were categorized into TLC points and OLU points. Figure 6(b) shows the LTC points and Figure 6(c) illustrates the OLU ones.
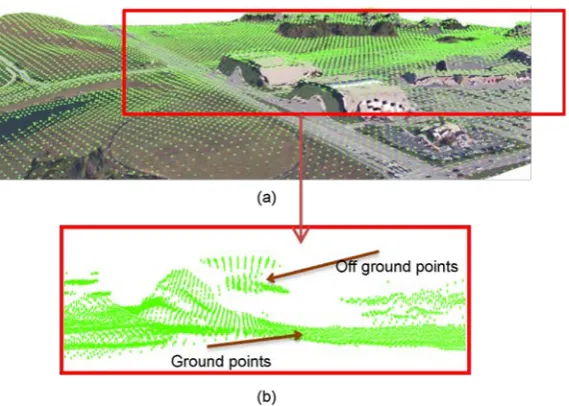
[image:11.595.59.541.234.533.2]Phase 3 was executed to detect the terrain and off-terrain elevations. As in Figure 7, an isometric view of a part of the study area is illustrated. Figure 7(a)
(a) (b)
[image:11.595.235.517.579.706.2](c) (d)
Figure 4. The pixel-to-object classification result. (a) Pixel-based classification result; (b) segmentation result with a small scale;
(c) the transferred classification result to the image segments; and (d) the calculated RPs of all generated image segments.
Figure 5. An example of the optical-elevation data co-registration a long
(a) (b) (c)
Figure 6. The co-registered and categorized matching points: (a) The distribution of the generated
matching points in the test image; (b) detected matching points that lie on the terrain segments based on the classification result; (c) the remaining points that lie on the OLU class segments.
Figure 7. Isometric views of a part of the study. (a) 3D rendered DSM representation of a
small part of the test image; and (b) a magnified part that illustrates the co-registered matching points and shows the possibility of delineating terrain-level points from the off-terrain ones based on image classification information.
represents a 3D rendered DSM representation of a small part of the test image. This representation shows the co-registered matching points. Figure 7(b) shows a magnified isometric view of a part of the co-registered points. It is clear that image classification to map the TLC class was an effective technique to detect terrain-level points and hence generate a DTM in the image space.
Once the terrain-level points have been detected, surface interpolation was implemented. In the same manner, all of the generated matching points were interpolated to reconstruct a DSM in the image-space based on the co-registered elevations of the matching points. By having both of these elevation models (i.e., DSM and DTM) in the image-space, the aboveground heights were calculated for all segments of the OLU class by finding the difference between the DSM and DTM elevations at the locations of the segment RPs.
4.2.2. Results of the Elevation-Based Building Detection
[image:12.595.232.517.225.428.2]step, thresholding was applied to detect the off-terrain RPs which represent building roofs objects. Then, based on the classification information extracted in Phase 1 of the EI method, the vegetation objects were suppressed. Figure 8 shows the detected RPs that lie on top of building roofs in the test image.
To enhance the created map of the detected buildings, the FbSO tool was ex-ecuted and the optimized parameters were applied to merge the detected build-ing segments. An example of the performance of this software tool is illustrated in Figure 9.
Figure 10 shows the detected building objects based on stereo elevations. Many man-made ground-level objects of very similar spectral information to the building roofs were removed from the detected urban objects. The result was accurate and reliable because elevation was the key component used for building detection. The quality of the achieved detection results was then assessed and evaluated.
4.3. Accuracy Assessment
[image:13.595.246.503.371.542.2]For the achieved result, the detection performance measures were calculated using a reference dataset that was generated manually in the test image. The deter-mined performance measures are listed in Table 1. The total areas—in pixels–
Figure 8. The detected building points shown as green dots in the test image.
[image:13.595.231.517.573.691.2](a) (b)
Figure 9. The enhanced building map. (a) The detected building segments
Figure 10. Detected building roofs and traffic areas.
Table 1. Performance measures for assessing the building detection accuracy.
Comp. Corr. Quality
83% 94% 80%
of true positive (TP), the false negative (FN), and the false positive (FP) were used as the input entities in the equations of the detection performance measures. Based on the assessment values shown in this table, the developed algorithm is promising despite the small size of the test area. This is proven quantitatively by the 80% detection quality measure and visually as shown in Figure 10.
Table 1 shows that the detection result was reliable as indicated by 94% cor-rect detection. This corcor-rectness value is attributed to two factors: 1) the use of the elevation data in the detection process, 2) the successful co-registration be-tween the optical and elevation datasets. The incomplete detection result of 17% is due to the moderate quality of the generated photogrammetric elevations based on automatic matching techniques. These automatic techniques have some limitations in the homogeneous areas such as the building roofs where they lack enough texture information. However, the executed post processing and finishing procedures are capable of enhancing the shapes of the detected building objects.
5. Conclusions
In this paper, a method was developed to facilitate detecting buildings and dis-tinguishing them from traffic areas of spectrally-spatially similar properties based on elevation information. The method introduced two techniques for achieving straightforward and accurate optical-elevation data co-registration and elevation data normalization for the purpose of building detection.
image in this co-registration was then segmented and classified into TLC and OLU. To normalize the co-registered elevations, the derived classification in-formation was used to identify the terrain-level elevations and then interpolated to generate a DTM of the test area in the image space. Similarly, the DSM was interpolated from all generated and co-registered elevations. Therefore, the ab-oveground elevations of the image segments of the land-use class (OLU) were calculated at their RPs by subtracting the DTM elevations from their corres-ponding DSM ones. These normalized elevations were thresholded to detect the building roofs.
After executing the developed method, the detection result was evaluated over a test dataset. The result was 94% correct due to the utilization of the elevation information. Additionally, this correctness value is attributed to the successful elevation and optical data co-registration. The missed building objects in the de-tection were mainly due to the moderate quality of the matching-based generat-ed elevation information. However, this limitation can be easily mitigatgenerat-ed in the process of shape finishing and enhancement.
After detecting and finishing building objects, the spectrally-similar ground level objects of building roofs were delineated accurately and reliably. The com-bination of pixel-based and object-based techniques in this study is effective de-spite the limitations of the photogrammetrically-derived elevations.
Based on the achieved 80% quality measure, the detection performance can be considered as highly promising for the building detection. Thus, it can be con-cluded that the developed algorithm facilitates the incorporation of the elevation data for object-based building detection applications.
In this study, the accuracy of the elevation data is critical for the quality of the final detection result. Additionally, in some cases, NDVI-based thresholding for vegetation suppression may omit building objects that have high NDVI values or roof gardens. These cases pose limitations in the developed elevation incorpora-tion and building detecincorpora-tion procedures. Therefore, future research will address these limitations and investigate the challenges associated with more complex urban environments.
Acknowledgements
This research is funded in part by the Libyan Ministry of Higher Education and Research (LMHEAR) and in part by the Canada Chair Research (CRC) program. The authors would like to acknowledge PCI Geomatics for providing the tutorial test data used in this research.
The authors also highly appreciate the comments for improving this paper from the anonymous reviewers.
References
[1] Zhang, Y. (1999) Optimisation of Building Detection in Satellite Images by Com-bining Mul-Tispectral Classification and Texture Filtering. ISPRS Journal of Photo-grammetry and Remote Sensing, 54, 50-60.
Im-ages. Computer Vision and Image Understanding, 72, 99-100. https://doi.org/10.1006/cviu.1998.0731
[3] Awrangjeb, M., Zhang, C. and Fraser, C.S. (2013) Automatic Extraction of Building Roofs Using LIDAR Data and Multispectral Imagery. ISPRS Journal of Photo-grammetry and Remote Sensing, 83, 1-18.
[4] Doxani, G., Karantzalos, K. and Tsakiri-Strati, M. (2015) Object-Based Building Change Detection from a Single Multispectral Image and Pre-Existing Geospatial Information. Photogrammetric Engineering and Remote Sensing, 81, 481-489.
https://doi.org/10.14358/pers.81.6.481
[5] Khosravi, I., Momeni, M. and Rahnemoonfar, M. (2014) Performance Evaluation of Object-Based and Pixel-Based Building Detection Algorithms from Very High Spa-tial Resolution Imagery. Photogrammetric Engineering and Remote Sensing, 80, 519-528. https://doi.org/10.14358/PERS.80.6.519-528
[6] Dowman, I. (2004) Integration of LIDAR and IFSAR for Mapping. International Archives of Photogrammetry and Remote Sensing, 35, 90-100.
[7] Kim, M., Madden, M. and Xu, B. (2010) A Vegetation Mapping in General Smoky Mountains National Park with Spectral and Non-Spectral Ancillary Information.
Photogrammetric Engineering and Remote Sensing, 76, 137-148. https://doi.org/10.14358/PERS.76.2.137
[8] Suliman, A. and Zhang, Y. (2015) Development of Line-of-Sight Digital Surface Model for Co-Registering Off-Nadir VHR Satellite Imagery with Elevation Data.
IEEE Journal of Selected Topics in Applied Earth Observations and Remote Sens-ing, 8, 1913-1923.https://doi.org/10.1109/jstars.2015.2407365
[9] Sithole, G. and Vosselman, G. (2004) Experimental Comparison of Filter Algo-rithms for Bare-Earth Extraction from Airborne Laser Scanning Point Clouds.
ISPRS Journal of Photogrammetry and Remote Sensing, 59, 85-101.
[10] Zhang, Y., Tao, C.V. and Merce, J.B. (2004) An Initial Study on Automatic Recon-struction of Ground DEMs From Airborne IFSAR DSMs. Photogrammetric Engi-neering and Remote Sensing, 70, 427-438. https://doi.org/10.14358/PERS.70.4.427
[11] Salehi, B., Zhang, Y., Zhong, M. and Dey, V. (2012) A Review of the Effectiveness of Spatial Information Used in Urban Land Cover Classification of VHR Imagery.
In-ternational Journal of Geoinformatics, 8, 35-51.
[12] Salehi, B., Zhang, Y. and Zhong, M. (2011) Object-Based Land Cover Classification of Urban Areas Using VHR Imagery and Photogrammetrically-Derived DSM. Pro-ceedings of the ASPRS Annual Conference, Milwaukee, 1-5 May 2011.
[13] Wack, R. and Wimmer, A. (2002) Digital Terrain Models from Airborne Laser scanner Data—A Grid Based Approach. International Archives of Photogrammetry Remote Sensing and Spatial Information Sciences, 34, 293-296.
[14] Zhang, K., Chen, S.-C., Whitman, D., Shyu, M.-L., Yan, J. and Zhang, C. (2003) A Progressive Morphological Filter for Removing Non-Ground Measurements from Airborne LIDAR Data. IEEE Transactions on Geoscience and Remote Sensing, 41, 872-882.https://doi.org/10.1109/TGRS.2003.810682
[15] Suliman, A., Zhang, Y. and Al-Tahir, R. (2016) Co-Registering and Normalizing Stereo-Based Elevation Data to Support Building Detection in VHR Images. Pro-ceedings of the Imaging and Geospatial Technology Forum (IGTF). Fort Worth, 11-15 April 2016.
Approach for High Quality Multi-Scale Image Segmentation. Angewandte Geogra-phische Informationsverarbeitung, 12, 12-23.
[18] Dey, V. (2013) Image Segmentation Techniques for Urban Land Cover Segmenta-tion of VHR Imagery: Recent Developments and Future Prospects. International Journal of Geoinformatics, 9, 15-35.
[19] Garcia-Castellanos, D. and Lombardo, U. (2007) Poles of Inaccessibility: A Calcula-tion Algorithm for the Remotest Places on Earth. Scottish Geographical Journal, 123, 227-233. https://doi.org/10.1080/14702540801897809
[20] Wallis, R.H. (1976) An Approach to the Space Variant Restoration and Enhance-ment of Images. Proceedings of the Symposium on Current Mathematical Problems in Image Science, Montery, 10-12 November 1976.
[21] Lehner, M. and Gill, R. (1992) Semi-Automatic Derivation of Digital Elevation Models from Stereoscopic 3-Line Scanner Data. European Space Agency, 347, 263- 263.
[22] Via, A., Gitelson, A.A., Nguy-Robertson, A.L. and Peng, Y. (2011) Comparison of Different Vegetation Indices for the Remote Assessment of Green Leaf Area Index of Crops. Remote Sensing of Environment, 115, 3468-3478.
[23] Tong, H., Maxwell, T., Zhang, Y. and Dey, V. (2012) A Supervised and Fuzzy-Based Approach to Determine Optimal Multi-Resolution Image Segmentation Parame-ters. Photogrammetric Engineering and Remote Sensing, 78, 1029-1044.
https://doi.org/10.14358/PERS.78.10.1029
[24] Rutzinger, M., Rottensteiner, F. and Pfeifer, N. (2009) A Comparison of Evaluation Techniques for Building Extraction from Airborne Laser Scanning. IEEE Journal of Selected Topics in Applied Earth Observations and Remote Sensing, 2, 11-20. https://doi.org/10.1109/JSTARS.2009.2012488
[25] Potůčková, M. and Hofman, P. (2016) Comparison of Quality Measures for Build-ing Outline Extraction. The Photogrammetric Record, 31, 193-209.
https://doi.org/10.1111/phor.12144
Submit or recommend next manuscript to SCIRP and we will provide best service for you:
Accepting pre-submission inquiries through Email, Facebook, LinkedIn, Twitter, etc. A wide selection of journals (inclusive of 9 subjects, more than 200 journals)
Providing 24-hour high-quality service User-friendly online submission system Fair and swift peer-review system
Efficient typesetting and proofreading procedure
Display of the result of downloads and visits, as well as the number of cited articles Maximum dissemination of your research work