ISSN Online: 1947-3818 ISSN Print: 1949-243X
Optimization of Minimum Power Output for
Combined Heat and Power Units Considering
Peak Load Regulation Ability
Cong Liu, Deyue Men, Dan Xu, Qiang Ding, Guodong Huang, Sai Dai, Jingyang Zhou
China Electric Power Research Institute, Beijing, China
Abstract
Northern China has rich wind power and photovoltaic renewable resources. Combined Heat and Power (CHP) Units to meet the load demand and limit its peaking capacity in winter, to a certain extent, it results in structural prob-lems of wind-solar power and thermoelectric. To solve these probprob-lems, this paper proposes a plurality of units together to ensure supply of heat load on the premise, by building a thermoelectric power peaking considering thermal load unit group dynamic scheduling model, to achieve the potential of differ-ent thermoelectric properties peaking units of the excavation. Simulation ex-amples show, if the unit group exists obvious relationship thermoelectric in-dividual differences, the thermal load dynamic scheduling can be more signif-icantly improved overall performance peaking unit group, effectively increase clean energy consumptive.
Keywords
CHP Units, Peak Load Regulation, Thermal Load Distribution, Solar Wind Power Consumption, Dynamic Scheduling
1. Introduction
According to the planning target is expected to “13th Five-Year” at the end, hy-dropower, wind power, photovoltaic power generation of state Grid installed capacity will be increased to 270 million kilowatts, 220 million kilowatts and 110 million kilowatts, a total of 600 million kilowatts, wind and other new energy consumptive issues will be more prominent. The scenery of the consumptive problem, to a certain extent trapped in the uncoordinated system integration mode of intermittent renewable energy and traditional energy. With China’s “Three North” area as an example, the winter scenery resources is very rich, but
How to cite this paper: Liu, C., Men, D.Y., Xu, D., Ding, Q., Huang, G.D., Dai, S. and Zhou, J.Y. (2017) Optimization of Mini-mum Power Output for Combined Heat and Power Units Considering Peak Load Regulation Ability. Energy and Power En-gineering, 9, 452-463.
https://doi.org/10.4236/epe.2017.94B051
the power peaking resources can participate in the scenery consumption,which
is further compressed because the CHP power determined by heat load. On the other hand, compared with the thermoelectric power generation, CHP has ob-vious economic advantages; CHP units will be further increased. In order to further improve the energy efficiency of the proportion a large number of exist-ing research show that two of coexistence will give the power peakexist-ing difficult [1]-[10]. Therefore, how to coordinate the contradiction between the CHP unit and the grid is a hot topic in recent years.
The paper [1]-[10] are from the operation angle, unified scheduling of ther-mal load and electrical load, expend the existing model of the economic opera-tion of the power grid, added the new thermal operaopera-tion constraints, in order to promote clean energy consumption as much as possible under the heat load. Most of the literatures put forward a core idea to solve the problem is to streng-then the peak load capacity of power network side. The theory on the unified dispatching of combined heat and power is a better solution with other types of thermoelectric power optimization techniques, but these methods require more complex external data, need the power supply and heat supply to realize the in-tegration of scheduling, it is difficult under the current scheduling model Paper [11] according to the manufacturer's demand curve for thermoelectric units, with total heat consumption minimum as the goal to solve the optimal load dis-tribution scheme for electric power dispatching, this model is suitable for de-partments to provide a power unit group load, and by the unit group complete electrical load distribution, it is similar to economic dispatch which change the optimization goal to the minimum heat consumption, but it doesn’t consider the constraints of the operation of the power grid side. Paper [12] through hardware investment, put forward in large pumping configuration through the heat sto-rage steam power plant to improve the peaking capability of the unit scheme, operation characteristics of electric heat storage configuration before and after thermal power unit is analyzed and modeled. The results show that the thermal load level in the middle of the given heating the configuration, thermal storage unit makes the peaking capacity improve significantly.
unit peak load capacity of power network thermal load dispatch model, power operation range can be further optimized CHP units, if the power is transmitted to the regular interval power dispatching departments can enhance the scenery of the clean energy consumptive ability.
2. Performance Analysis of CHP Units
2.1. Thermoelectric Analysis of CHP Unit
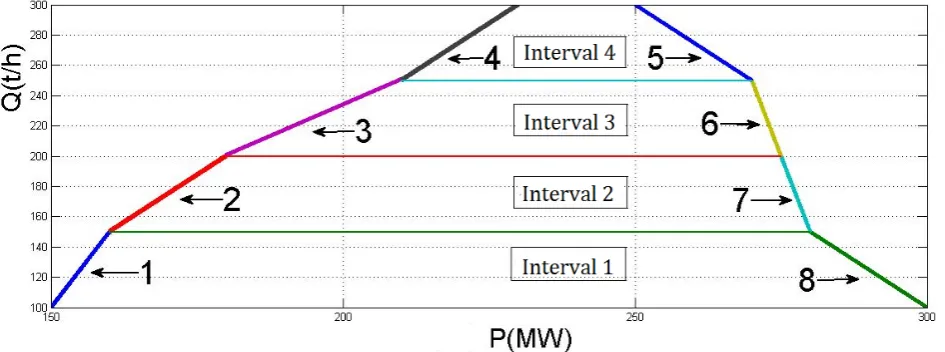
Thermo-electric relationship curve is the key for analyzing units’ heat load supply and electric power regulation, thus it’s proper to start with the relation-ship for the study of units’ peak-load regulating performance. It’s illustrated in Figure 1 the schematic diagram of classical thermo-electric relationship curve, among which the horizontal ordinate is electric power P and the vertical coor-dinate is the heat load capacity of suction Q. Through the analysis of such kind of curve, as the capacity of suction Q is given, electric power’s limits are deter-mined by the bound curves of the two sides, which are called the lower bound
Pmin and upper bound Pmax respectively. Besides, the regulation interval Pran = Pmax − Pmin. In all, the greater the capacity of suction Q, the smaller the regulation
interval Pran.
As the bound lines are a series of irregular curves, for convenience of model building later, the bound curves are piecewise linearized, as in Figure 1, the bound curves are clarified into 4 intervals according to capacity of suction which is corresponding to bound curves numbered 1 - 8 assigned by arrows in the fig-ure and each of the oblique line is denoted by a line function. Assume that func-tions of curve 1 and curve 8 are as Equation (1),
1 1 1,min 1
1 2 1,max 2
a b
a b
Q P
Q P
= ⋅ +
= ⋅ +
(1)
where a1, a2, b1, b2 are known constants.
[image:3.595.64.537.542.718.2]In air extraction interval 1, when the capacity of suction Q is given, expression of limits regulation interval P1,ran is as Equation (2).
2 1 1, 2 1 b b a a ran Q Q
P = − − − (2)
When traditional thermal units need to be transformed to CHP units, as the traditional thermal power units’ performance varies, thermoelectric relationship curves have also their differences in some constant. What’s more, by equipped with different thermal storage devices, the curves can be adjusted later [5].
2.2. CHP Units Operational Cost Analysis
In the traditional economic dispatch of thermal power units, coal consumption (operational cost) of units is normally expressed as a quadratic curve, while the operational cost of CHP units could be expressed as a quadratic curve of electric power and heat power of the units as in Equation (3).
2 2
c ap bp aq bq dqp
f = + ⋅ +P ⋅P + ⋅ +Q ⋅Q + ⋅ ⋅P Q (3)
where c is a constant term, ap and bq are linear and quadratic coefficient of the
heat power, dqp is the thermoelectric coupling coefficient. For one unit, when the
thermoelectric coupling optimization objective only contains the supply of heat or electricity, its operational state is the most economic under rated power through the analysis of the quadratic curves. However, if the supply cost of heat and electricity are considered simultaneously, the determination of optimal val-ue is relatively complicated. The linearization or proper decoupling method is the key of solving the problem.
3. Heat Load Dynamic Dispatch Model Considering Power
Grid Peak-Load Regulation
3.1. CHP Traditional Optimization Dispatch Model
CHP optimal dispatch problem is normally the realization of the minimum of whole operation cost while satisfying various kinds of related constraints of the units operation, heat grid and electric grid.
1 min N i i f f =
=
∑
(4)load 1 load 1 . ( ) ( ) N i i N i i P q P P Q Q s t P F Q F = = = = ≤ ⋅ ≤ ⋅
∑
∑
(5)where, in Equation (4), fi is the operational cost of unit i, constraints in Equation
(5) mainly include electricity balance, heat balance and various kinds of inequa-lity constraints. The model has been illustrated in literature [1]-[10], and not ex-plained here.
3.2. Heat Load Dispatch Optimization Objective
regula-tion performance and promote wind/photovoltaic clean energy accommodaregula-tion by distributing the proper heat load. The peak-load regulation performance could be considered in two aspects, one is to maximize the electric power regula-tion interval of the whole CHP units, the other is to minimize the units’ down-ward output ability that is to release more generation space in load valley pe-riods. In the work of power grid dispatching schedule, these two aspects may all affects its peak-load regulation performance, while in periods of electric power load valley, the latter has a more direct influence of wind/photovoltaic accom-modation. As illustrated above in 2.1, when there are several CHP units whose heat and electric bound curves seem inconformity, there is a heat load distribu-tion scheme to maximize units’ integral electric power reguladistribu-tion interval Psum,ran
or minimize units’ integral electric power output while satisfying the heat load requirement. It’s normally conducted as dynamic economic dispatch according to the load requirements in different time intervals, what’s more, heat load is al-so affected by various kinds of weather situation in the outside world in the dis-patching cycle. Thus this paper builds the dynamic load distribution model of the heat load requirement in the dispatching cycle. The optimization objectives can be chosen as Equations (6) or (7) according to requirements.
sum,ran , ,ran 1 1 max
T N
i t
t i
P P
= =
=
∑∑
(6)where Pi,t,ran, is the limit regulation ability of unit i when the heat load Q is given, N is the total number of thermal power generation units, and T is the total time intervals.
sum,min , ,min
1 1 min
T N
i t
t i
P P
= =
=
∑∑
(7)where Pi,t,min is the minimum electric power of unit i at time t when the unit’s
heat load Q is given.
As the load regulation pressure normally exists in electric load valley periods, the model is simplified for pertinence and the optimal objective is focused on specific time intervals.
3.3. Heat Load Regulation Constraints Condition
The equations are an exception to the prescribed specifications of this template. You will need to determine whether or not your equation should be typed using either the Times New Roman or the Symbol font (please no other font). Equa-tions should be edited by Mathtype, not in text or graphic versions. You are suggested to use Mathtype 6.0 (or above version).
1) Heat load requirement constraints
CHP units should first meet the heat load requirement.
load, ,
1 N
t i t
i
Q Q
=
≤
∑
(8)where Qload,t is the total amount of heat load at time t and Qi,t is the heat power of
2) Electric load requirement constraints
In economic dispatch with heat load, electric load requirement of power grid is no need. However, different electric load requirements have directly influ-enced the supply of heat load. Thus electric load constraints would be consi-dered in form of load requirement intervals.
load, ,min ,min, 1
load, ,max ,max, 1 N
t i t
i N
t i t
i P P P P = = ≥ ≤
∑
∑
(9)where Pload,t,min and Pload,t,max are the lower and upper bounds of electric load
re-quirements respectively. Pi,min,t and Pi,max,t are the lower and upper bounds of
electric power respectively when the capacity of suction is given. The meaning of the equation is that all the units’ electric power sum should meet the limits bound constraints of load.
3) Thermoelectric coupling constraints
As the thermoelectric relationship curve in Figure 1, the optimization objec-tive would make the results in the bound of thermoelectric relationship, i.e. the linear relationship curve. The thermoelectric coupling constraints could be rea-lized using Equation (1).
4) Heat power operation constraints
As constrained by the unit’s operational condition, units’ heat power needs to meet heat power operation constraints.
,min , ,max
, , 1 ,up
, 1 , ,down
i i t i
i t i t i
i t i t i
Q Q Q
Q Q Q
Q Q Q
− − ≤ ≤ − ≤ − ≤ (10)
where Qi,max and Qi,min are the maximum and minimum capacity of suction, Qi,up
is the added capacity limit of suction in adjacent time intervals of unit i and
Qi,down is the reduced capacity limit of suction in adjacent time intervals of unit i
which can be perceived as heat power climbing constraints. 5) Electric power operational constraints
The units should also meet the electric power operational constraints.
,min , ,max
, , 1 ,up
, 1 , ,down
i i t i
i t i t i
i t i t i
P P P
P P P
P P P
− − ≤ ≤ − ≤ − ≤ (11)
In Equation (11), Pi,min and Pi,max are the lower and upper output limit of unit I
respectively, Pi,up and Pi,down are the upper and lower limit of electric power
climbing rate of unit i respectively.
3.4. The Processing Mode of the Piecewise Thermoelectric
Relationship Curve
in Figure 1. Besides, this model building could not be realized only according to two former sections. As in Figure 1, different units are in different intervals of heat supply, thus corresponding to different P-Q relationships, there for the model above could not determine the relationship equation adopted between P-Q.
To solve the problems above, the model should be improved. The method adopted in this paper is to transfer the problem into MIP with 0 - 1 binary va-riables by piece-wise linearization. The strategy built here is as follows.
1) First, to piece-wisely linearize the thermoelectric relationship curve ac-cording to its calculation accuracy acquirement and the unit is split into various virtual units according to total sectional number. The relationship curve in fig-ure 1 is split into 4 virtual units and their thermoelectric operational perfor-mances are corresponding to pump interval 1 - 4.
2) To build a 0 - 1 binary variable Sf,tfor the split virtual units. As for capacity
of suction in each time interval can only drop in one pump interval, thus the split units should meet the following virtual on-off constraints.
, 1
f t f I
S
∈
=
∑
(12)where Sf,tis the on-off state of split virtual unit f and I is the former physical unit I.
3) Through adding 0 - 1 binary variable of virtual units, the objective function and constraints in 2.1 and 2.2 are improved, i.e. Equation (7) is changed into Equation (13).
sum,min , , ,min
1 1 min
T N
i t i t
t i
P S P
′
= =
=
∑∑
⋅ (13)In Equation (13), N’ is the total units number including virtual units, for
non-virtual units, Si,t= 1.
For constraints, i.e. Equation (10) is changed into Equation (14).
,min , , ,max ,
, , 1 ,up
, 1 , ,down
i i t i t i i t
i t i t i
i t i t i
Q S Q Q S
Q Q Q
Q Q Q
−
−
⋅ ≤ ≤ ⋅
− ≤
− ≤
(14)
Other expression can also been built in the model according to similar me-thod. As for model solving, it’s a classical MIP which can be solved by mature commercial programming solver CPLEX.
4. Example and Analysis
proposed in this paper, it is divided into 15 units, including the virtual unit, and the model is solved on the Xeon E7420 2.13 GHz server, and calculation time is less than 1 second. The thermoelectric parameter of the unit is shown in Table 1. The predicted heat load requirements are shown in Figure 2. The predicted load demand is shown in Figure 3.
4.1. Analysis on the Influence of Peak Regulation
In order to validate the effect of peak regulation performance, an example to the overall power output is minimized as the optimization objective, the results of the calculation of the first time section are shown in Table 1.
Now the lower power limit of total ten units is 1337 MW.
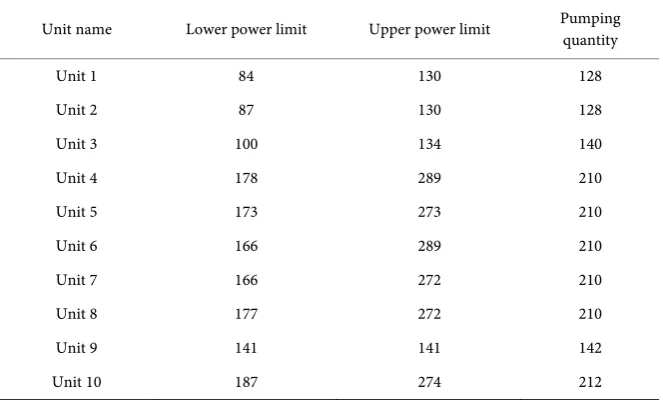
[image:8.595.206.540.314.497.2]If the heat load can be allocated according to the heating capacity of the unit, then solve the electricity power adjustment interval of each unit according to the distribution of heat load, the results are shown in Table 2.
Table 1. Optimization results of thermal load.
Unit name Lower power limit Upper power limit Pumping quantity
Unit 1 75 142 60
Unit 2 80 136 100
Unit 3 112 126 190
Unit 4 150 300 100
Unit 5 150 250 300
Unit 6 180 280 300
Unit 7 180 250 300
Unit 8 150 300 100
Unit 9 100 100 200
Unit 10 160 280 150
Table 2. Capacity allocation results of thermal load.
Unit name Lower power limit Upper power limit Pumping quantity
Unit 1 84 130 128
Unit 2 87 130 128
Unit 3 100 134 140
Unit 4 178 289 210
Unit 5 173 273 210
Unit 6 166 289 210
Unit 7 166 272 210
Unit 8 177 272 210
Unit 9 141 141 142
[image:8.595.208.540.530.730.2]Figure 2. Thermal load forecast value.
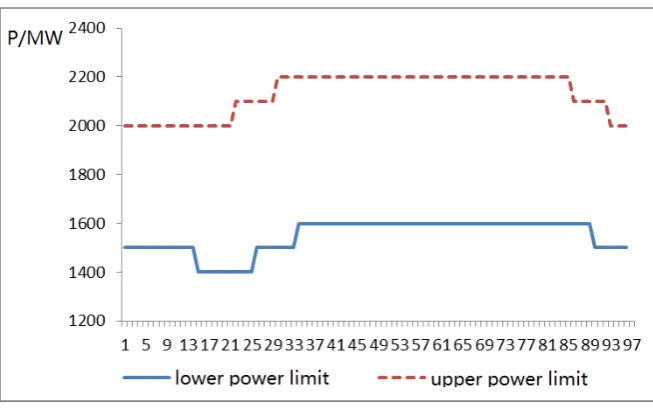
Figure 3. Load forecast value.
Now the lower power limit of total ten units is 1459 MW. Compare the two methods, the optimization model proposed in this paper can make the electric power down 122 MW, it can improve the peak depth of 8.36%. In the period of a lot of wind power, if there is a large number of abandoned wind, by the way you can enhance the space wind power 122 MW. When the size of CHP unit is large this mode can bring considerable increase peak regulation capacity.
4.2. Analysis of the Economic Impact of the System
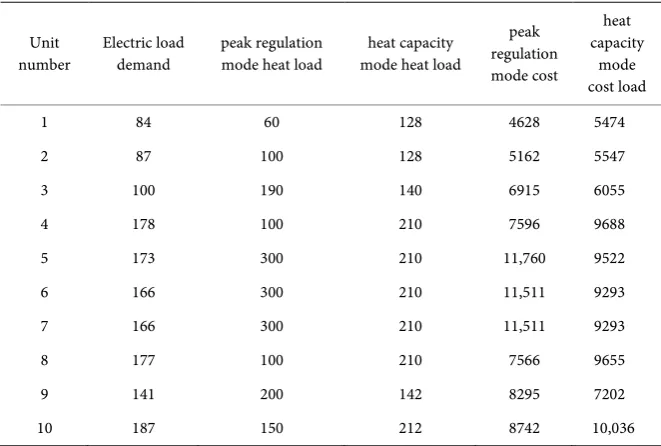
shown in Table 3. The total cost of peak regulation mode specific heat capacity mode increased by 2.3%. Because thermal power plant does not get additional benefits in wind power consumptive process, but pay the extra cost, so how to give economic subsidies to thermal power plant in this case is a problem needed to be further investigated.
4.3. Thermal Load Sensitivity Analysis
In accordance with the heat load requirements shown in Figure 2 for the entire cycle of heat load distribution, there will be a unit to participate in the adjust-ment of heat load. According to the simulation curves of thermoelectric units in the calculation results show that unit 1, 2, 5, 9, 10 were not involved in the con-stant adjustment and unit operation with a concon-stant pumping quantity, unit 3, 4, 6, 7, 8 is responsible for stabilize the fluctuation of heat load.
It can be seen from the analysis that the principle of load distribution depends on the slope of the thermoelectric relationship a, when the a is greater that a small amount of electricity power limit can be realized with large heat load fluc-tuation change, when take the strongest peak load capacity as the optimization objective, the smaller the slope a is, the more suitable for the base heat load.
If you want to achieve a more detailed allocation of heat load, in accordance with the model proposed in this paper, only need to increase the divided number of CHP unit pumping interval. When the thermal power relationship curves of all the units are divided into enough piecewise linear functions, the optimization results can be obtained with high accuracy. Of course, this measure will also in-crease the amount of calculation model.
4.4. Electric Load Sensitivity Analysis
[image:10.595.207.538.509.732.2]Because the demand of electric load will directly affect the heat load of the unit,
Table 3. Economic comparison of the two models.
Unit
number Electric load demand peak regulation mode heat load mode heat load heat capacity
peak regulation mode cost
heat capacity
mode cost load
1 84 60 128 4628 5474
2 87 100 128 5162 5547
3 100 190 140 6915 6055
4 178 100 210 7596 9688
5 173 300 210 11,760 9522
6 166 300 210 11,511 9293
7 166 300 210 11,511 9293
8 177 100 210 7566 9655
9 141 200 142 8295 7202
it is necessary to analyze the influence of the change of electric load on the op-timal allocation of heat load. For the electric load demand curve in Figure 3, the first assumption is that the system needs to further reduce the active power out-put of the unit, and the lower limit of the power demand is reduced by 100 MW, at this point, the model has no solution. When the upper and lower limits of electrical power are increased by 100 MW, the system can get the same results as the previous data. However, if the electric power to improve 200 MW, this time must also improve the heat load requirements, increase the heating capacity, or the model is also no solution. The simulation results show that in the premise of heat load supply, electric power boundary model has been obtained close to the boundary, the boundary data of the power range is more sensitive, but also shows that the proposed model can be used to obtain a more accurate range of electric power.
5. Conclusion
For the CHP unit limit the peak regulation capability of the unit to ensure the supply of heat load, which causing the problem of wind and light insufficient consumptive, this paper put forward to supply multiple units together to ensure the heat load, give full play to the potential of different of peak thermoelectric properties set. In this paper, CHP power group thermal load dynamic scheduling model considering peak load regulation, and puts forward solutions to the irre-gular power curve. The simulation example shows that if there are obvious dif-ferences between the relationship between the thermal power unit inside the in-dividual heat load dynamic scheduling method of multi-unit can ensure the load requirements effectively improving the peak load capacity of CHP unit. Of course, due to the purchase of thermal power peaking at the expense of benefit is a need for further study of economic problems.
Acknowledgements
Thanks for support from the science and technology program of State Grid Corporation of China (SGCC).
References
[1] Meng, A.B., Mei, P. and Lu, H.M.(2016) Crisscross Optimization Algorithm for Combined Heat and Power Economic Dispatch. Power System Protection and Con-trol, 44,90-97.
[2] Zhang, C., Hu, L.X. and Hu, J.(2013) Research on the Impact of The Proportion of Thermal Power Generating Units and Heat Load on The Wind Power Accommoda-tion Rate.Power System Protection and Control, 41,120-125.
[3] Chen, J.,Yang, X.,Zhu, L.,et al. (2013)Genetic Algorithm Based Economic Operation Optimization of A Combined Heat And Power Microgrid.Power System Protection and Control, 41, 7-15.
[5] Shan, H.H. and Pei, C.L. (2013) A Harmony-Genetic Based Heuristic Approach to-ward Economic Dispatching Combined Heat and Power.Electrical Power and Ener-gy Systems,53, 482-487.https://doi.org/10.1016/j.ijepes.2013.05.027
[6] Chen, J.H.,Wu, W.C.,Zhang, B.M.,et al.(2012) A Rolling Generation Dispatch Strat-egy for Co-generation Units Accommodating Large-scale Wind Power Integra-tion.Automation of Electric Power Systems,6, 21-27.
[7] Pei, W.D., Wei,S. Zi, Q.,et al.(2014) Energy Coordination and Optimization of Hy-brid Microgrid Based on Renewable Energy and CHP Supply.Automation of Electric Power Systems,38, 9-15.
[8] Long, H.Y., Ma, J.W., Wu, K.,et al.(2011) Energy Conservation Dispatch of Power
Grid With Mass CHPand Wind Turbines.Electric Power Automation Equipment,
31, 18-22.
[9] Gu, W., Wu, Z. and Wang, R. (2012) Multi-objective Optimization of Combined Heat and Power Microgrid Considering Pollutant Emission. Automation of Electric Power Systems,36,177-185.
[10]Wang, R., Gu, W. and Wu, Z.(2011) Economic and Optimal Operation of a
Com-bined Heat and Power Microgrid with Renewable Energy Resources.Automation of Electric Power Systems,35, 22-27.
[11]Wu, L., Yuan, Q. and Liu, X.(2012) Research on the Scheme of Optimal LoadDi-stribution for CHP Units. Proceedings of the CSEE, 2012,32, 6-12.
[12]LV, Q., Chen, T.Y.,Wang, H.X., et al.(2014) Analysis on Peak-load Regulation Abil-ity of CHP Unit with Heat Accumulator.Automation of Electric Power Systems, 38, 34-41.
Submit or recommend next manuscript to SCIRP and we will provide best service for you:
Accepting pre-submission inquiries through Email, Facebook, LinkedIn, Twitter, etc. A wide selection of journals (inclusive of 9 subjects, more than 200 journals)
Providing 24-hour high-quality service User-friendly online submission system Fair and swift peer-review system
Efficient typesetting and proofreading procedure
Display of the result of downloads and visits, as well as the number of cited articles Maximum dissemination of your research work
Submit your manuscript at: http://papersubmission.scirp.org/