Blood Vessel Segmentation and Classification of
Diabetic Retinopathy Images using Gradient
Operator and Statistical Analysis
Praveen Kumar Reddy Yelampalli, Jagadish Nayak, and Vilas H Gaidhane
Abstract—Retinal blood vessel detection in fundus images is a challenging task. Widely spread blood vessels in diabetic retinopathy effected fundus images can not be accurately segmented using conventional gradient-based edge detection techniques. Accurate detection of blood vessels can give bet-ter classification for decisive diagnosis at different stages of diabetic retinopathy. The proposed blood vessel segmentation technique is a combination of gradient and morphological operators. The fundus images are preprocessed using a local-phase-based enhancement technique to highlight the blood vessels from the background image. Further, detected edges are made connected using an averaging filter. Area occupied by the blood vessels provides a biomarker to classify fundus images into normal, prolific diabetic retinopathy (PDR), and non-prolific diabetic retinopathy (NPDR). The classification is achieved using ANOVA test. The ANOVA test classified with the 91% accuracy for normal, 92.7% for PDR, and 87.8% for NPDR images, respectively. These results are compared with conventional Canny and Prewitt edge detection techniques and the proposed method outperforms both.
Index Terms—diabetic retinopathy, edge detection, gradient operator, morphological operations, ANOVA test, classification.
I. INTRODUCTION
D
IABETIC retinopathy (DR) commonly appears in dia-betic patients which causes blindness due to damaged retina. The retinal structure of DR affected eyes can be seen using fundus imaging technique. Fundus images are usually acquired by a fundus camera focusing through the eye. Fundus images show the internal eye surface consisting of blood vessels, fovea, macula, retina, and optic disc. A healthy retina contains only blood vessels that carrying blood and nutrients required for an eye. These blood vessels are fragile in nature and rupture due to excess blood pressure in diabetic patients. The progress of diabetic retinopathy due to excess pressure can be detected by the growth of extraneous small blood vessels from the surface of the retina. This growth in blood vessels can be used as a bio-marker for classifying different stages of diabetic retinopathy such as PDR and NPDR aginst the normal retina [1].In the last decade, many researchers have developed efficient vessel segmentation schemes and classified the retinal images on the basis of disease severity and type [2]-[9]. Nayak et al., [10] proposed an automated retinopathy classification method based on artificial neural network for
Manuscript received July 07, 2017; revised July 12, 2017.
P. K. R. Yelampalli, J. Nayak, and V. H. Gaidhane are with the Department of Electrical and Electronics Engineering, BITS Pilani, Dubai Campus, Dubai, 345055 UAE e-mail: [email protected], [email protected], [email protected].
the early recognition of DR. This method employs morpho-logical operators to separate blood vessels and exudates. In another approach, fuzzy c means (FCM) and genetic algorithms detected exudates with96%accuracy [11]. Akram
et al. [12] presented a multilayered thresholding technique to segment the blood vessels in retinopathy images. Wavelet [13], ridgelets [14] and curvelet [15] transforms are also used with the fundus images for the analysis of retinal structure. A fuzzy logic approach attained a sensitivity of 99.9% for the hard exudate detection in DR images [16].
In 2012, Nguyen et al. [17] developed a retinal vascular feature analysis using a multi-scale line detector. Roychowd-hury et al. [18] developed a DREAM (Diabetic retinopa-thy analysis using machine learning) project by combining the Gaussian mixer model with the k-nearest neighbour-hood algorithm and classified using singular vector machine (SVM). Further, Zhao et al. [19] used L2 Lebesgue inte-gral method to estimate an infinite perimeter regularization. Global thresholding technique is implemented by Mapayiet al. [7] for the preprocessing of retinal images. A morpho-logical component analysis (MCA) of vessel detection has attained an accuracy of 0.959 and 0.9523 with STARE and DRIVE datasets, respectively [20]. Premature retinopathy in blood vessels can be studied by tortuosity level on the retina. Masoudet al.[21] presented a curvature-based algorithm for vessel grading depends on the tortuosity levels.
Roychowdhuryet al. [22] estimated the boundary of the optic disc using a Gaussian mixture model. Liskowski and Krawiec [23] used a deep neural network methodology that trained on a huge samples of DRIVE, STARE and CHEST datasets. However, this method requires a substantial amount of samples (upto 400,000). In a recent work, Seoud et al. [24] developed a telemedicine system using the red-lesions for computer-aided screening of retinopathy images. Later, a direct method has been proposed through training the classifier for DR referral [25]. The omission of lesions reduced efforts to detect the lesions, however, it requires large pool of data to train the classifier.
preprocess-Fig. 1. Framework for DR image vessel detection and classification
(a) (b) (c) (d)
Fig. 2. Removal of optic disc (a) Original image (b) Green component (c) Background obtained using morphological transformation[10] (d) Image with optic disc removed
ing is applied on the acquired fundus images. Later, optic disc is removed using morphological transformation [10] to enable clear blood vessels and exudates visibility in the ac-quired image.First, the fundus images are contrast enhanced using a local-phase-based quadrature filtering method. The proposed method introduces new method of edge detection to segment blood vessels from all other backgrounds in the fundus image. Further, the density of blood vessels is computed based on the area measure. The total count of pixels which constitute blood vessels is used as a parameter for classification.
The remaining paper is organised as, processes involved in the blood vessel segmentation and classification are ex-plained in Section II. Detailed discuss of experimental results is presented in Section III. Section IV concludes the paper with the further possible extension to the present work.
II. METHODS ANDAPPROACHES
A. Proposed edge detection method
Fig1 shows the block diagrammatic approach of fundus image blood vessel detection. The green component of RGB fundus image shows prominent blood vessels compared to RED and BLUE components. Hence, we used the GREEN component of the fundus image in our work. At the first stage, for improving the visibility of the regions contrast enhancement [13] is performed using local-phase method [26]. Local-phase method uses quadrature filter to combine both line and edge detectors, and gives better enhancement compared to wavelets, histogram equalization, and other filtering approaches. This strengthen the vessel structures at multiple scales. Fourier domain representation of quadrature filter is
Fk(u)=0, u.nk ≤0 (1)
whereu andu.nk are frequency and filter direction
respec-tively.
In the present work, the optic disc (OD) is removed by applying a morphological transform [10]. Firstly, the background of the image is evaluated using the transform and it is subtracted from the original image. Fig. 2 shows the step-by-step removal of OD. The transformation function can be defined as
Itr ans f or m=I− (I◦S) (2)
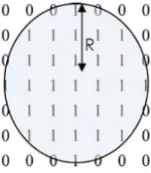
[image:2.595.75.538.51.223.2]whereS is the structuring element of radiusR=3 and type ‘disc’as shown in Fig. 3.
Fig. 3. Disc structuring element with radiusR=3
A gradient operator (5) depicts the slope of a function in a particular direction. In a simplified form 5 of a function f(x)can be expressed as
5f(x).v=Dvf(x) (3)
The first-order gradient vectorsgx(m,n)andgy(m,n) for an
imageI(m,n) in horizontal (kx) and vertical (ky)directions
are [27]
gx(m,n)=I(m,n) ∗kx gy(m,n)=I(m,n) ∗ky
(4)
The calculated gradient vectors gx(m,n) and gx(m,n) in
equation 4 are normalized with the magnitude to obtain the unit gradient vectorsux(m,n) anduy(m,n)
ux(m,n)=gx(m,n)/
q
g2x(m,n)+g2y(m,n)
uy(m,n)=gy(m,n)/
q
g2x(m,n)+g2y(m,n)
(5)
[image:2.595.388.464.305.392.2](a) (b) (c) (d) (e) (f)
Fig. 4. Row-wise: Normal, PDR, and NPDR images. (a) Original fundus image (b) Green component of the original (c) Enhanced green component using local-phase [26] (d) Blood vessels detected using Canny edge detection (e) Blood vessels detected using Prewitt method (f) Blood vessels detected using the proposed method
B. ANOVA Statistical test
The ANOVA (Analysis of variance) statistical test gives the statistical dependency of three or more unrelated groups. The statistical difference between the means and the variance are estimated by plotting the boxplots. A boxplot is a graphical representation of numerical data using quartiles. As depicted in Fig. 5, a boxplot consists of maximum and minimum values of the dataset, median of the values in each dataset, quartiles (first and third), inner fence, outer fence, and whiskers. First quartile represents the variance from the median to the minimum value whereas, third quartile gives the variance from median to the maximum value in the dataset. Whiskers are the vertically extended lines from the quartiles indicate the variability outside the two quartiles. The inner fence shows the likely presence of values beyond one and half times of the variance and these are called suspected outliers. Similarly, the outer fence is the boundary the values beyond which are considered to be outliers [28].
Fig. 5. Boxplot description.
III. RESULTS ANDDISCUSSIONS
[image:3.595.353.499.299.392.2]Retinal images of 140 subjects aged between 25-57 years have been collected at Department of Ophthalmology, Kas-turba Medcial College, Manipal, India. A TRC-NW200
Fig. 6. Boxplots representing the classification of normal, PDR, and NPDR based on blood vessel area in each image category using Canny.
Fig. 7. Boxplots representing the classification of normal, PDR, and NPDR based on blood vessel area in each image category using Prewitt.
model TOPCON mydriatic retinal camera has used for image acquisition. All the images have the resolution of560×720. In this experimentation images of normal, prolific DR, and non-prolific DR are considered for the classification. Blood vessels are extracted using the methods discussed in Section II. Further, blood vessel area(A)of each image is determined using equation (6)
A=Õ
i
Õ
j
Ωi,j ∀ Ωi,j ,0 (6)
[image:3.595.352.501.432.525.2] [image:3.595.93.229.531.689.2]TABLE I
MEAN AND VARIANCES OF BLOOD VESSEL AREAS CALCULATED FOR EACH CLASS OF RETINAL IMAGES USINGCANNY, PREWITT,AND THE
PROPOSED METHOD. THEp-VALUE IS<1×10⁻⁴
Method Canny Prewitt Proposed
Image Type Normal PDR NPDR Normal PDR NPDR Normal PDR NPDR
Mean 58145 63670 60374 9518 8025.5 4609 349274 359521 363414 Variance ±8053.7 ±9492.1 ±9890.8 ±1596.2 ±1332.6 ±1282.7 ±4809.0 ±3840.8 ±4587.2 Accuracy 73.4% 77.7% 68.5% 74.2% 56.9% 61.1% 91% 92.7% 87.8%
Fig. 8. Boxplots representing the classification of normal, PDR, and NPDR based on blood vessel area in each image category using the Proposed method.
The boxplots for blood vessel area calculated using Canny edge detection are shown in Fig. 6. This shows significant overlapping between any two classes and hence they are statistically dependent. Hence the Canny method results in poor accuracy of 73.4%, 77.7%, and 68.5% for normal, PDR, and NPDR retinopathy images, respectively. The accuracy is not acceptable in the clinical diagnosis of retinopathy. On the other hand, vessel area calculated using a Prewitt-based method is achieved 74.2%, 56.9%, and 61.1% accuracy of classification between normal, PDR, and NPDR images. This is due to the fact that the Prewitt edges are unable to specify blood vessels precisely in healthy and retinopathy images. The ANOVA statistical plots for Prewitt method are shown in Fig. 7.
However, From Fig. 8 it is evident that the considered images of three classes are statistically independent with respect to the blood vessel area. Table. I shows the av-erage area obtained for normal, PDR, and NPDR images. Moreover, the variance gives the maximum and minimum vessel areas for each class of images. Accuracy of the present method is evaluated based on the number of images having the blood vessel area beyond the mean and variance values calculated for each image category. The accuracy of the proposed classification method is 91% for normal, 92.7% for PDR, and 87.8% for NPDR images. The superiority of the proposed method is it’s efficiency in the classification of retinal fundus images when compared to the conventional Canny and Prewitt edge detectors.
IV. CONCLUSION ANDFUTURESCOPE
The proposed methodology for blood vessel detection classifies retinal fundus images of diabetic patients. The combination of gradient operator and morphological opera-tions highlights the blood vessels in the retinal fundus image more clearly than conventional edge detection operations. The area contributed by the detected blood vessels is used as feature for classification. The ANOVA test statistically classified fundus images as normal, PDR, and NPDR. The classificatinon accuracy is high in the proposed method due
to the clear visibility of blood vessels as a biomarker which distinguishes the fundus image into three classes. Better accuracy can be achieved by taking more features other than blood vessel areas and efficient noise removal techniques. In recent days, binary patterns are also emerging as reliable edge detectors with smaller feature size and exceptional local texture analysis.
REFERENCES
[1] C. P. Wilkinson, F. L. Ferris, R. E. Klein, P. P. Lee, C. D. Agardh, M. Davis, D. Dills, A. Kampik, R. Pararajasegaram, and J. T. Verda-guer, "Proposed international clinical diabetic retinopathy and diabetic macular edema disease severity scales,"Opthalmology, vol. 110, no. 9, pp. 1677–1682, Sep. 2003.
[2] M. M. Fraz, P. Remagnino, A. Hoppe, B. Uyyanonvara, A. R. Rudnicka, C. G. Owen, and S. A. Barman, "Blood vessel segmentation methodologies in retinal images -A Survey,"Comput. Meth. Prog. Bio., vol. 108, pp. 407–433, Mar. 2012.
[3] J. Nayak, P. S. Bhat, and U. R. Acharya, "Automatic identification of diabetic maculopathy stage using fundus images," J. Med. Eng. Technol., vol. 33, no. 2, pp. 119–129, Feb. 2009.
[4] K. Ram, G. D, Joshi, and J. Sivaswamy, "A successive clutter-rejection-based approach for early detection of diabetic retinopathy,"
IEEE Trans. Biomed. Eng., vol. 58, no. 3, pp. 664–673, Mar. 2011. [5] M. M. Fraz, P. Remagnino, A. Hoppe, B. Uyyanonvara, A. R.
Rud-nicka, C. G. Owen, and S. A. Barman, "An ensemble classification-based approach applied to retinal blood vessel segmentation,"IEEE Trans. Biomed. Eng., vol. 59, no. 9, pp. 2538–2548, Sep. 2012. [6] S. W. Franklin and S. E. Rajan, "Diagnosis of diabetic retinopathy by
employing image processing technique to detect exudates in retinal images,"IET Image Process., vol.8, no. 10, pp. 601–609, 2014. [7] T. Mapayi, S. Viriri, and J-R. Tapamo, "Comparative study of retinal
vessel segmentation based on global thresholding techniques," Com-put. Math. Method. M., vol. 2015, pp. 1–15, Nov. 2014.
[8] D. Wu, M. Zhang, J-C. Liu, and W. Bauman, "On the adaptive detection of blood vessels in retinal images,"IEEE Trans. Biomed. Eng., vol. 53, no. 2, pp. 341–343, Feb. 2006.
[9] A. M. Mendinca and A. Campilho, "Segmentation of retinal blood vessels by combining the detection of centerlines and morphological reconstruction," IEEE Trans. Med. Imag., vol. 25, no. 9, pp. 1200– 1213, Sep. 2006.
[10] J. Nayak, P. S. Bhat, U. R. Acharya, C. M. Lim, and M. Kagathi, "Automated identification of diabetic retinopathy stages using digital fundus images,"J. Med. Syst., vol. 32, pp. 107–115, 2008.
[11] A. Osareh, B. Shadgar, and R. Markham, "A computational-intelligence-based approach for detection of exudates in diabetic retinopathy images,"IEEE Trans. Inf. Technol. Biomed., vol. 13, no. 4, pp. 535–545, Jul. 2009.
[12] M. U. Akram and S. A. Khan, "Multilayered thresholding-based blood vessel segmentation for screening of diabetic retinopathy,"Eng. Comput., vol. 29, pp. 165–173, 2013.
[13] P. Bankhead, C. N. Scholfield, J. G. McGeown, and T. M. Curtis, "Fast retinal vessel setection and measurement using wavelets and edge location refinement,"PLOS One, vol. 7, no. 3, pp. 1–12, Mar. 2012. [14] J. Staal, M. D. Abramoff, M. Niemeijer, M. A. Viergever, and B. v.
Ginneken, "Ridge-based vessel segmentation in color images of the retina,"IEEE Trans. Med. Imag., vol. 23, no. 4, pp. 501–509, Apr. 2004.
[15] M. S. Miri and A. Mahloojifar, "Retinal image analysis using curvelet transform and multistructure elements morphology by reconstruction,"
[17] U. T. V. Nguyen, A. Bhuiyan, L. A. F. Park, and K. Ramamohanarao, "An effective retinal blood vessel segmentation method using multi-scale line detection,"Pattern Recogn., vol. 46, pp. 703–715, 2013. [18] S. Roychowdhury, D. D. Koozekanani, and K. K. Parhi, "DREAM:
Di-abetic retinopathy analysis using machine learning,"IEEE J. Biomed. Health Inform., vol. 18, no. 5, pp. 1717–1728, Sep. 2014.
[19] Y. Zhao, L. Rada, K. Chen, S. P. Harding, and Y. Zheng, "Automated vessel segmentation using infinite perimeter active contour model with hybrid region information with application to retinal images,"IEEE Trans. Med. Imag., vol. 34, no.9, pp. 1797–1807, Sep. 2015. [20] E. Imani, M. Javidi, and H-R. Pourreza, "Improvement of retinal blood
vessel detection using morphological component analysis,"Comput. Meth. Prog. Bio., vol. 118, pp. 263–279, 2015.
[21] A-S. Masoud, H. R. Pourreza, and T. Banaee, "A novel curvature-based algorithm for automatic grading of retinal blood vessel tortuosity,"
IEEE J. Biomed. Health Inform., vol. 20, no. 2, pp. 586–595, Mar. 2016.
[22] S. Roychowdhury, D. D. Koozekanani, S. N. Kuchinka, and K. K. Parhi, "Optic disc boundary and vessel origin segmentation of fundus images,"IEEE J. Biomed. Health Inform., vol. 20, no. 6, pp. 1562– 1574, Nov. 2016.
[23] P. Liskowski and K. Krawiec, "Segmenting retinal blood vessels with deep neural networks,"IEEE Trans. Med. Imag., vol. 35, no. 11, pp. 2369–2380, Nov. 2016.
[24] L. Seoud, T. Hurtut, J. Chelbi, F. Cheriet, and, J. M. P. Langlois, "Red lesion detection using dynamic shape features for diabetic retinopathy screening,"IEEE Trans. Med. Imag., vol. 35, no. 4, pp. 1116–1126, Apr. 2016.
[25] R. Pires, S. Avila, H. F. Jelinek, J. Wainer, E. Valle, and A. Rocha, "Beyond lesion-based diabetic retinopathy: a direct approach for retinal,"IEEE J. Biomed, Health Inform., vol. 21, no. 1, pp. 193–200, Jan. 2017.
[26] G. LathÜ en, J. Jonasson, M. Borga, "Blood vessel segmentation using´
multi-scale quadrature filtering,"Pattern Recogn. Lett., vol. 31, no. 8, pp. 762–767, Jun. 2010.
[27] D. Onkaew, R. Turior, B. Uyyanonvara, and T. Kondo, "Automatic extraction of retinal vessels based on gradient orientation analysis," in
Int. Joint Conf. Comput. Sci. Softw. Eng., 2011, pp. 102–105. [28] T. L. Weissgerber, N. M. Milic, S. J. Winham, and V. D. Garovic,
![Fig. 4.Row-wise: Normal, PDR, and NPDR images. (a) Original fundus image (b) Green component of the original (c) Enhanced green componentusing local-phase [26] (d) Blood vessels detected using Canny edge detection (e) Blood vessels detected using Prewitt method (f) Blood vessels detectedusing the proposed method](https://thumb-us.123doks.com/thumbv2/123dok_us/412818.538823/3.595.93.229.531.689/original-component-enhanced-componentusing-detection-prewitt-detectedusing-proposed.webp)
