Abstract— In this work, we developed an automatic decision support system to provide efficient customer assistance on commerce websites. To provide the needed service, E-commerce sites must identify "users in need." They must determine which users they can help among all the users on the site that will make them the most profit. These questions are complex and difficult to answer without a smart algorithm. The problem of choosing the potential customer most in need was aimed at answering the question "which users on the website will most benefit from assistance". To model and calculate a score and type of each visitor to the website, we proposed an approach using the influence (weight) of various parameters and calculated the final score of all potential users using the website. The problem is defined as handling online analysis of Big Data.
Index Terms— Big Data, Decision Support Systems, Automated Customer Assistance
I. INTRODUCTION
ODAY, online customer service is an essential part of almost all internet shopping sites. Nevertheless, the number of users on these sites is usually much greater than the number of online representatives that can provide effective help and assist users with their buying experience. Many sites solve this shortage by creating a chat tool that replaces human representatives. Yet market research and consumer satisfaction parameters indicate that these chat tools are insufficient and can even be annoying. To provide the needed service, E-commerce sites must identify "users in need." They must determine which users they can help among all the users on the site that will make them the most profit. These questions are complex and difficult to answer without a smart algorithm.
With the growth of online shopping, IBIS World research forecasts an increase in online revenues of 8.6% annually [1] over the next five years. This forecasted increase points to the need for an effective online customer service that can answer questions, present offers and provide satisfaction to online consumers to encourage them to come back and shop.
Manuscript received March 15, 2016.
Miri Weiss Cohen (corresponding author) is with the Software Engineering Department, Braude Academic College of Engineering, Karmiel Israel (phone: 972-4-9901758; fax: 972-4-9901852; e-mail: [email protected]).
Yevgeni Kabishcher is with the Software Engineering Department, ,Braude Karmiel Israel (e-mail: [email protected]).
Pavel Krivosheev is with the Software Engineering Department,,Braude Academic College of Engineering, Karmiel Israel (e-mail: [email protected]).
Some companies that provide online customer service claim that the number of shoppers (active users online every minute of the day) on one site alone ranges from 1000-2000 users. The problem is that only a few representatives are available for online customer service on this site. Two types of online customer experiences can be provided. The implicit method provides an online help button that will access an online chat with a representative. After clicking on the button, customers will be able to start talking with a representative. The explicit method provides a popup window in the middle of the screen offering a sale or asking whether the customer needs help.
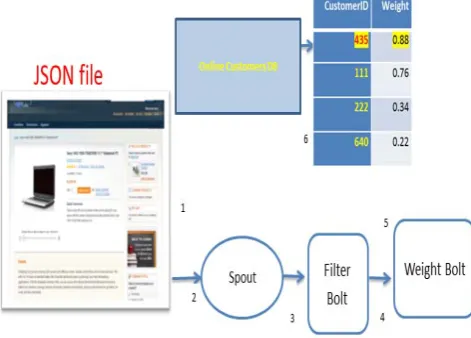
The question is: Who will benefit most from receiving online customer service? In other words, what will lead customers to buy more? We need to analyze the information collected by the system to determine who the best candidate is. An example of the collected data of "one click information" for a single user is depicted in Figure 1.
Let us suppose we gather this information over one month. Information is currently collected by site-visit/redirection per user in JSON format of 2KB. A quick calculation indicates that the size of this information per month is: 2KB (information per click) * 1000 (no. of users on site) * 10 (no. of clicks/visits per min) * 43200 (no. of minutes in month) = 823 GB of information per month. This amount of information will take a great deal of time to analyze with standard tools. Therefore, we need to examine Big Data solutions to solve problems of this nature [2,3]. Even if we analyze the relevant information and come to some conclusion, some behavioral search parameters change in real time, causing the “best customer” image to change and we need to analyze the information again [4]. In fact, it changes constantly while the site is running, so we need a real-time solution for this problem. The Model for Automated Customer assistance in E-Commerce Websites that we propose is generic and can be applied flexibly to different websites. During the development stage, several methodologies were examined, and results are detailed in the following section.
II.BACKGROUND
Big data processing systems are characterized by a large number of components [4,5] that must be processed. These components operate in parallel to run multiple instances of the same tasks in order to achieve the needed performance levels in applications characterized by huge amounts of data. The number of components depends on the dimension of the involved data, so that new resources (e.g., processing
A Decision Support System for Automated
Customer Assistance in E-Commerce Websites
Miri Weiss Cohen, Yevgeni Kabishcher, and Pavel Krivosheev
Fig. 1. Collected information per click
or storage) are usually added as the working database grows. Reliable performance evaluation of these systems is crucial to enable administrators and developers to keep pace with data growth. Yet such evaluation is extremely difficult due to the intrinsic complexity of these architectures [6,7]. There are three main approaches for handling and analyzing big data: stream processing, batch processing and interactive analysis. To understand the architecture of big data, we first need to look at its fundamental programming model. Then we discuss two uses of the MapReduce model in batch processing and big data tools. Finally, we examine the stream processing solution.
MapReduce is a programming model and an associated implementation for processing and generating large data sets. Users specify a map function that processes a key/value pair to generate a set of intermediate key/value pairs, and a reduce function merges all intermediate values associated with the same intermediate key. Many real world tasks are expressible in this model [8]. MapReduce involves two main programming stages: Mapping: In this stage, the original computational problem is taken by the master node and divided into smaller pieces. Every computational piece is then sent to different worker nodes called mappers. Reducing: In this stage, the output of every mapper node is collected and reassembled using the same key index for all the nodes.
In many cases, we want to view and analyze the data we have collected. The data will be displayed in an interactive environment, and users will be able to choose how to interact with the data. The data can be reviewed, compared and analyzed in tabular or graphic format as needed. [9] Stream processing tools [10] were introduced to meet the need of analyzing large amounts of data (such as online customer service demands) in order to make decisions in real time. The difference between batch processing and stream processing is that in stream the data are analyzed before being stored.
Storm [10,11] is a real time computation system for processing streaming data. Storm has many applications, such as real-time analytics and on-line machine learning. A storm cluster has three types of components: the master
node that runs a daemon called Nimbus, Zookeeper nodes and worker nodes, which run a daemon called Supervisor. The Nimbus is the master node. Its job is to control the work across the cluster. It distributes code around the cluster, assigns tasks to machines and monitors the cluster for failure. The Zookeeper is responsible for coordinating between Nimbus and the Supervisors. In addition, all state information and configuration is kept in the ZooKeeper cluster, which makes the Nimbus and the Supervisor fail-fast and very stable. The Supervisor receives instructions from the Nimbus, and starts and stops the worker processes as necessary. Each worker process is a physical JVM and executes a subset of all the tasks for the topology [12].
Data streams include all real time computations and are handled by topologies. A topology is a graph of computation that defines how to process the streaming data. The data in storm is also called a "tuple", while a sequence of tuples is called a stream. A topology graph consists of spouts and bolts. These spouts and bolts have the interface to implement application-specific logic [13.
A spout is the source of a stream. It receives a sequence of tuples and sends it to every bolt that subscribes to that stream. A spout can be either reliable or unreliable. A reliable spout makes sure to resend a tuple (which is an ordered list of data items) if Storm fails to process it. An unreliable spout does not track the tuple once it is emitted.
The bolts do the "real" work: They run functions, filter tuples, do streaming joints and aggregations and talk to the database. After the bolts have done their job on the stream, they send the stream data to the next bolts in their streaming procedure. Bolts can be defined in any language. Bolts written in another language are executed as sub processes, and Storm communicates with those sub processes using JSON messages over stdin/stdout [12,13].
A stream grouping defines how a stream should be partitioned among the bolt's tasks. Storm provides built-in stream groupings. Some examples used in our model are detailed:
Shuffle grouping - Tuples are randomly distributed across the bolt's tasks such that each bolt is guaranteed to get an equal number of tuples.
{"aac":1386748743275,"visitId":"b1bf4fe0644a41e4983b329e178118e4", "ip":"79.182.105.213 ","location":{"ipTo":1337393151,"ipFrom":1337342976,"countryCode":"IL" ,"continentCode" :"ME","continentName":"MIDDLEEAST","timeZone":"GMT+2","owner":"SE","cityName":"", "countyName":"","latitude":31.428663,"longitude":35.288086,"regionCode":"","region":""} ,"browser":"mozilla11.0","os":"Windows","flashPlayerVersion":"12.0.0","hasRequiredFlashPla yerVersion":true,"javaVersion":"TBDfalsetrue","hasRequiredJavaVon":false,"protocol": "http:","host":"www.hbrtest3.com","currentPathname":{"memers":{"title":"Guy\u0027samazint estsite", "url""/SWF/28/ GuyAmazingSite.html"}} ,"currentQueryString":"","referrer":"" ,"referrerType":"Direct", "landingPage": "http://www.hbrtest3.com\"/SWF/28
/GuyAmazingSite.html\ "","onSiteSince":"Mar 11, 2014 8:1 AM", "lastIsAlive":"Mar11201411:20:16AM",
Fields grouping -The stream is partitioned by the fields specified in the grouping. For example, if the stream is grouped by the id" field, tuples with the same "user-id" will always go to the same task, but tuples with different "user-ids" may go to different tasks.
All grouping - The stream is replicated across all the bolt's tasks.
Global grouping - The entire stream goes to a single one of the bolt's tasks, specifically the one with the lowest id.
None grouping - This grouping specifies that it does not matter how the stream is grouped. Currently, none groupings are equivalent to shuffle groupings. Eventually, though, Storm will push down bolts with none groupings to be executed in the same thread as the bolt or spout they subscribe from (when possible).
Direct grouping - A stream grouped this way means that the producer of the tuple decides which consumer task will receive this tuple. Direct groupings can only be declared on streams that have been declared as direct streams.
Storm guarantees that every spout tuple will be fully processed by the topology. It does this by tracking the tree of tuples triggered by every spout tuple and determining when that tree of tuples has been successfully completed. Every topology has a "message timeout" associated with it. If Storm fails to detect that a spout tuple has been completed within that timeout, then it fails the tuple and replays it later [12].
Our automatic decision algorithm uses a wide range of patterns provided by the Storm platform. The following are commonly used:
Streaming joins - A streaming join combines two or more data streams together based on some common field. Whereas a normal database join has finite input and clear semantics for a join, a streaming join has infinite input and unclear semantics for what a join should be.
Batching - Often for reasons of efficiency or otherwise, we would like to process a group of tuples in batch rather than individually.
BasicBolt - Many bolts follow a similar pattern of reading an input tuple, emitting zero or more tuples based on that input tuple, and then passing that input tuple immediately at the end of the execute method. Among the bolts that match this pattern are functions and filters.
In-memory caching + fields grouping combo – It is common to keep caches in-memory in Storm bolts. Caching becomes particularly powerful when combined with a fields grouping. For example, suppose you have a bolt that expands short URLs (like bit.ly, t.co, etc.) into long URLs. Performance can be increased by keeping an LRU cache of short URL to long URL expansions to avoid doing the same HTTP requests repeatedly. Component "urls" emit short URLS, and component "expands" expand short URLs into long URLs and keep an internal cache [13].
III. PROPOSED APPROACH
In attempting to answer the questions of who will benefit most from receiving online customer service and what will lead customers to buy more, we have defined the following model based on the following performance measures:
Ability to filter the incoming information and exclude irrelevant information.
• Handle large amount of information per second (throughput).
• A programmable system.
• A scalable system - can be migrated into large sites as well as small ones.
The proposed algorithm and model will determine who in the online shop needs help by examining each visitor and analyzing its behavior on the website, just like an assistant in a regular shop. The algorithm takes as input the user's current activity (page click, page idle, site search, etc.) and compares this to the overall site activity during the last minute. The algorithm returns two pieces of information: the weight (the probability of the current customer to get customer assistance) and the reason this customer needs help. Figure 2 provides a graphic representation of the model.
[image:3.595.309.545.293.462.2]
Fig. 2. Graphic representation of the data flow
The data flow depicted in Figure 2 is passed and analyzed in six stages, as indicated by numbers 1-6, in Figure 2. The output of the algorithm is a weighted factor, which is used to solve the problem of to whom to provide the best customer assistance. The stages are detailed as follows: 1.Data from customers browsing the site is collected at each
interaction.
2.Data is collected, sent to a server and received by the Storm spout.
3.The spout sends the JSON data to the filter bolt for further analysis.
4.The filter bolt filters “unnecessary” data and sends it a Visit class to the update bolt.
5.The weight bolt uses a function that will assign each “parameter” a “weight” (to indicate the importance of that parameter) to prioritize the customers.
"behavior". These groups must be assigned in the first minute of the user in the web site, and are as follows: NEW – This is probably a new visitor. At this point, we should probably not popup our chat but instead let the visitor browse the website for a while.
SEARCH – This is probably a visitor that is searching for something specific. In that case we can offer help in finding it: “Hello, can I help you find what you are looking for?” UNSURE – This visitor is probably looking at one or two specific items and cannot decide which one to take, so we should help him accordingly: “Hello, can I help you with ‘product name’?”
NORMAL – This option applies for those who are not new visitors but do not fall into one of the above categories. We should offer him help by saying: “Hello, can I help you?” REDIRECTED – A visitor is redirected if the shop owner wants to set up a special chat help for specific people that were redirected from a specific page or add: “Chat with
David to get a special offer?”
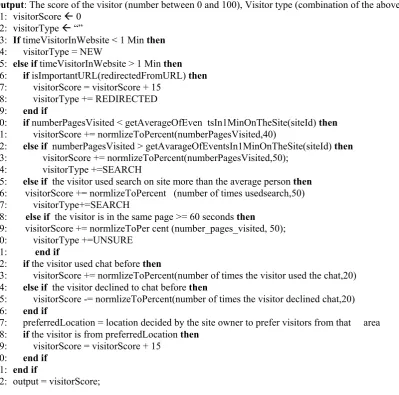
The Calculate Score algorithm is detailed in Figure 3. The algorithm uses the data visited by the user as input and returns as output the score of the visitor (number between 0 and 100) and the visitor type.
Rows 1-10: If the user is on the site less than one minute, the user type is set to “NEW” and the user scores will remain zero until the user remains on the site more than one minute. Otherwise, if the user is not a new user (more than one minute on the site), the algorithm checks how the user got to the site. If the user was redirected from a special link (as decided by the site owner), the user is assigned a score bonus of 15 points to the total score, and “REDIRECTED” is added to the type string.
.
Algorithm: CALCULATE SCORE
Input: VisitData
Output: The score of the visitor (number between 0 and 100), Visitor type (combination of the above types) 1: visitorScore 0
2: visitorType “”
3: If timeVisitorInWebsite < 1 Min then
4: visitorType = NEW
5: else if timeVisitorInWebsite > 1 Min then
6: if isImportantURL(redirectedFromURL) then
7: visitorScore = visitorScore + 15 8: visitorType += REDIRECTED 9: end if
10: if numberPagesVisited < getAverageOfEven tsIn1MinOnTheSite(siteId) then
11: visitorScore += normlizeToPercent(numberPagesVisited,40)
12: else if numberPagesVisited > getAvarageOfEventsIn1MinOnTheSite(siteId) then
13: visitorScore += normlizeToPercent(numberPagesVisited,50); 14: visitorType +=SEARCH
15: else if the visitor used search on site more than the average person then
16: visitorScore += normlizeToPercent (number of times usedsearch,50) 17: visitorType+=SEARCH
18: elseif the visitor is in the same page >= 60 seconds then
19: visitorScore += normlizeToPer cent (number_pages_visited, 50); 20: visitorType +=UNSURE
21: end if
22: if the visitor used chat before then
23: visitorScore += normlizeToPercent(number of times the visitor used the chat,20) 24: else if the visitor declined to chat before then
25: visitorScore -= normlizeToPercent(number of times the visitor declined chat,20) 26: end if
27: preferredLocation = location decided by the site owner to prefer visitors from that area 28: if the visitor is from preferredLocation then
29: visitorScore = visitorScore + 15 30: end if
31: end if
[image:4.595.54.454.321.716.2]32: output = visitorScore;
Rows 15-18: If the user used the search more than the average number of search queries in one minute, the number of the user’s queries will affect the user score by increasing it by 50% of the total score, and the user type string is updated with “SEARCH”
Rows 18-21: Else, if the visitor stays on the same page more than 60 seconds, then
Rows 22-26: If the user used that chat before, the number of chat uses affects the total score by increasing it by 20%.
Rows 28-30: If the user came from a preferred location, the user gets a 15% bonus.
For each case the algorithm adds to the total score starting from 0 up to 100 by using a function called NormalizeToPercent
Once the data has been analyzed and the user is offered help, the system provides assistance as depicted in Figure 5. The result is two records. One is on the console containing the scores and information of the user being helped by the automated system, and the other is the output of the resulting GUI on the web site.
IV. SIMULATIONS AND RESULTS
After running the system on the website or on a simulation process for a certain amount of time, we expect to see that
users who most need help and have problems finding what they are looking for on the website will get higher scores and will receive chat support faster.
Figures 5 and 6 depict the simulation of running the system for 78 and 108 seconds respectively.
The main window includes three parts: the upper sub-window displaying the online customers and their IDs (assigned by the system), the user type (processed by the information retrieval process) followed by the score
(calculated by the algorithm).
[image:5.595.312.552.131.270.2]In the lower part of the window, the log displays the events as well as exceptions in the process. The right panel displays the average values (AVG), the average number of page visits and the number of searches performed in a given time as calculated each minute.
Fig. 4. Resulting output on the console and on the website.
[image:5.595.110.490.482.727.2]In Figure 5 some users are new, indicating they have been in the system for less than a minute and not redirected from any other website. The algorithm calculates 0.0 score not offering any of the users any assistance. The simulation window also indicates the time the visitor is on the web page and the number of pages the user visited. Figure 5 depicts the state of the simulation after 78 seconds. The figure shows that the scores are calculated for each visitor and a type is assigned to it. A snapshot of system simulation at 105 seconds (Figure 6) shows more relevant results for decision making. We see that user d has better score than user a and therefore has a better chance of being automatically chosen to be offered assistance.
Fig.6. Running the simulation for 105 seconds
V.CONCLUSION
An automatic decision support system to provide efficient customer assistance on E-commerce websites was developed. The problem of choosing the potential customer most in need is aimed at answering the question "which users on the website will most benefit from assistance". To model and calculate a score and type of each visitor to the website we proposed an approach using the influence (weight) of various parameters, and calculated the final score of all potential users using the website.
The problem is defined as handling online analysis of Big Data. The platform we chose to run our algorithm, Apache Storm, was efficient in running the algorithm on a very large number of inputs in real time. The algorithm was tested on separate log files that were pre-generated to test all the algorithm options and in real time websites. In our work the algorithm calculates the visitor score while considering the average visitor activity on the site.
It should be noted that visitor behavior on a website can differ from different websites. These differences can emerge from the website structure and the visitor himself, our model and algorithm are designed in a generic manner that can be adapted and modified to the needs of various demands and websites.
REFERENCES
[1] Ibis Report Industry https://www.ibisworld.com/industry/home.aspx [2] S. Cai, M. Jun, "Internet users' perceptions of online service quality: a
comparison of online buyers and information searchers," Managing
Service Quality, 13.6:504-519, 2003.
[3] R. M. Chang, R. J. Kauffman, Y. O. Kwon, "Understanding the paradigm shift to computational social science in the presence of big [4] data," Decision Support Systems, 63, 67–80, 2014.
http://dx.doi.org/10.1016/j.dss.2013.08.00
[5] C. L. P. Chen, C-Y. Zhang, "Data-intensive applications, challenges, techniques and technologies: A survey on Big Data," Information
Sciences, 275, 314–347, 2014. dx.doi.org/10.1016/j.ins.2014.01.015.
[6] A. Castiglione, M. Gribaudo, M. Iacono, F. Palmieri, "Exploiting mean field analysis to model performances of big data architectures," 37, 203–211, 2014. http://dx.doi.org/10.1016/j.future.2013.07.016 [7] T. H. Davenport, P. Barth, R. Bean, "How 'Big Data' Is Different,"
MIT Sloan Management Review, Fall 2012.
http://sloanreview.mit.edu/article/how-big-data-is-different
[8] H. C. Chen, R. H. L. Chiang, V. C. Storey, "Business intelligence and analytics: from big data to big impact," MIS Quarterly. 36 (4), 1165– 1188, 2012.
[9] C. White, Using big data for smarter decision making, IBM: Yorktown Heights, NY, 2011.
[10] IBM Map reduce - Official Website: http://www.ibm.com/analytics/us/en/technology/hadoop/
[11] P. Zikopoulos, C. Eaton, Understanding Big Data: Analytics for
Enterprise Class Hadoop and Streaming Data (1st ed.), McGraw-Hill
Osborne Media, 2011.
[12] P. Giacomelli, Apache Mahout cook book. Princeton, 2013), https://www.princeton.edu/~achaney/tmve/wiki100k/docs/Naive_Bay es_classifier.html
[13] Hadoop - Official Website, http://hortonworks.com/hadoop/storm/ [14] Apache storm tutorial,