Original Article
c-MET expression potentially contributes to the
poor prognosis of rhabdomyosarcoma
Juan Du1*, Yuanyuan Wang1*, Lian Meng1, Yang Liu1, Yuwen Pang1, Wenwen Cui1, Liang Zhang1, Zhenzhen Li1, Qianqian Liu1, Hao Shang1, Chunxia Liu1, Feng Li1,2
1Department of Pathology, School of Medicine, Shihezi University, Shihezi, Xinjiang, China; 2Department of
Pathol-ogy, Beijing Chaoyang Hospital, Capital Medical University, Beijing, China. *Equal contributors and co-first authors. Received May 23, 2018; Accepted June 29, 2018; Epub August 1, 2018; Published August 15, 2018
Abstract: Rhabdomyosarcoma (RMS) is one of the most common soft-tissue sarcomas with a poor prognosis. c-MET is a prognostic biomarker associated with growth, proliferation, invasion, and metastasis in various carcinomas. In this study, we aim to investigate the expression of c-MET in RMS and its effect on the prognosis of patients with rhabdomyosarcoma. We performed immunohistochemistry and a quantitative real-time polymerase chain reac-tion (qRT-PCR) to determine the expression levels of c-MET proteins and mRNAs. Results indicated that the c-MET protein and mRNA expression levels in the RMS samples were significantly higher than those in normal controls (P<0.01 and P=0.0492). However, the correlation between c-MET expression and any other clinicopathological pa-rameter and survival was not significant (P=0.837). Nevertheless, c-MET expression had a significant influence on the overall survival rates of patients with ERMS (χ2=9.673, P=0.002) and fusion gene-negative patients (χ2=5.400,
P=0.020). These findings suggest that c-MET may serve as a promising biomarker capable of predicting poor prog -nosis in patients with RMS.
Keywords: Rhabdomyosarcoma, c- MET, immunohistochemistry, qRT-PCR, prognosis
Introduction
Rhabdomyosarcoma (RMS) is a malignant tu- mor derived from skeletal muscle cells and is one of the most common soft tissue sarcomas affecting children and adolescents. According to the latest classification standards on soft tis -sue tumors by the World Health Organization (WHO), RMS has four subtypes, namely, embry-onal RMS (ERMS), alveolar RMS (ARMS), pleo-morphic RMS (PRMS), and sclerosing RMS (SRMS); the first two are the major subtypes [1]. ARMS is associated with PAX3/7-FKHR fusion genes and has a poor prognosis [2, 3]. Some chromosome deletions and ectopic changes occur in ERMS [2, 4], which has a better prog -nosis than ARMS. Several studies have indicat-ed correlations between genomic copy number and gene expression levels and have showed evidence of the involvement of aberrant gene expression in tumorigenesis and/or tumor pro-gression [5]. Aiming at precisely detecting novel genes and therapeutic targets associated with
RMS, we conducted an array comparative gen- omic hybridization, and we observed a high fre-quency of gain and the amplification of several genes, including c-MET, GLI1, and GEFT [6]. Moreover, GLI1 and GEFT serve as promising biomarkers for the prediction of poor prognosis in patients with RMS and have potential as therapeutic targets [7, 8]. Therefore, we investi -gated whether c-MET has the same effect as these genes.
and amplification of the c-MET gene are closely related to the oncogenesis and metastasis of several tumors, including glioblastoma, colorec-tal, breast, lung, and gastric tumors [12-16].
In an early study by Ferracini et al., the aberrant expression of c-MET enabled RMS cells to ex- hibit properties similar to those of embryonal myoblasts and subsequently to migrate into surrounding connective tissues [17]. Moreover, human c-MET, which situates at the nexus of pathways that regulate myogenic growth and differentiation, represents critical targets in RMS pathogenesis [18]. Sierra et al. provided evidence of the potential of c-MET as a poten-tial therapeutic target and prognostic biomark-er in various carcinomas [19]. Previous data indicated that the c-MET-directed approaches have therapeutic value and are effective in RMS treatment [20]. However, the correlation between c-Met expression and the clinical prognosis of RMS remains unclear.
In this study, we evaluated c-MET protein and mRNA expression levels in RMS patients with RMS. We also analyzed the correlations of c-MET expression with various clinicopatho- logical characteristics, and the relationship be- tween c-MET expression and patient survival. Importantly, the objective of our study was to identify whether c-MET can serve as a prog- nostic marker for unfavorable outcomes in patients with RMS.
Materials and methods
Patients and tissue samples
We collected 45 RMS samples and their clinico-pathological data from the Department of Pa- thology, the First Affiliated Hospital of Shihezi University School of Medicine and the First Affiliated Hospital of Xinjiang Medical University during the period 1972 to 2013. We obtained thirty-six normal muscle samples as controls, including the RMS adjacent normal tissues and normal-striated muscle tissues of other normal cases. The diagnosis and classification of RMS were confirmed by two pathologists, combined with immunohistochemical (IHC) staining and the result of molecular genetics, according to the Intergroup RMS Study Group and the late- st WHO classification criterion on soft tissues. The 45 RMS cases consisted of 20 ARMS cases, 23 ERMS cases, and 2 PRMS cases,
wherein 22 were men and 23 were women, 10 patients had lymph node metastasis, 35 were without lymph node metastasis, 24 cases were in TNM stages I-II, and 21 cases were in stages III-IV. We determined the presence of the PAX3-FKHR and PAX7-FKHR fusion genes by reverse transcription polymerase chain reac-tion (RT-PCR).
Tissue microarray (TMA) construction
We selected two representative fields of each tumor sample from the hematoxylin-eosin (HE) slides. Areas relevant to the selected fields were located in the paraffin blocks for TMA con -struction. Each area was reviewed to ensure the presence of at least 70% tumor cells. We used a tissue-arraying instrument (Alphelys, Plaisir, France) to create the tissue cores from paraffin blocks. We collected the cores by us-ing a hollow needle with an inner diameter of 1.0 mm and prepared from the TMA blocks for IHC staining.
Experimental reagents
We used rabbit-derived monoclonal antibodies against c-MET (Abcam, dilution 1:200) and an EnVision Detection Kit and DAB chromogenic reagent (Dako). We extracted total RNA by using an RNeasy FFPE Kit (Qiagen). We performed reverse transcription to single-stranded cDNA through QuantiTect Reverse Transcription Kit (Qiagen). c-MET and β-actin primers were pur-chased from the Sangon Company (Shanghai, China).
Immunohistochemistry (IHC) assay
Evaluation of IHC staining
We scored the expression levels of c-MET in tumor and normal muscles semiquantitatively according to the percentage of positive cells and cytoplasmic-staining intensity. The propor-tions of the following positive staining scores were given as: 0 (≤5%), 1 (6%-25%), 2 (26%-50%), and 3 (≥51%). We scored the intensity of the special staining on a scale from 0 to 3 as follows: 0 (negative), 1 (buff), 2 (yellow), and 3 (brown). We calculated the staining index as fol-lows: staining index = staining intensity × stain-ing grade. Thus, the stainstain-ing results were cate-gorized as: - (0), + (1-3), ++ (4-6), and +++ (7-9), where a score of 0 indicates negative expres-sion (-), and scores of 1-9 represent positive expression (+). All the samples were evaluated independently by two pathologists without any clinicopathological information.
Quantitative real-time polymerase chain reac-tion (qRT-PCR)
We extracted total RNA from the FFPE sections in RNeasy FFPE Kit (QIAGEN) according to the manufacturer’s instructions and treated all total RNA samples with DNAse I, and tran-scribed to single-stranded cDNA with a Qu- antiTect Reverse Transcription Kit (Qiagen). We carried out qRT-PCR to detect β-actin expres-sion, which was used to normalize the amount of cDNA for each sample. Normal muscle tis-sues, which were the same ones used in IHC, served as a control. The c-MET gene primer was from QuantiTect Primer Assays (Qiagen). We carried out the reaction on ABI 7500 Real-Time PCR thermocycler (Applied Biosystems) using a Quantifast SYBR Green PCR Kit (Qiagen). The thermal cycling program was 5 min at 95°C, 40 cycles of 10 s at 95°C and 30 s at 60°C. We normalized the data for β-actin
expression through the comparative threshold cycle method. Cycle threshold (Ct) is the frac-tional cycle number when the amount of the amplified target reaches a fixed threshold. We calculated the ΔCt values by subtracting the β-actin Ct values from Ct values of the target gene. We determined the expression level was as 2-ΔCt and performed all PCR samples in
tripli-cate measurements. Statistical analysis
We compared both the statistical significance of c-MET protein expression in RMS samples versus normal controls and the correlation between c-MET expression and clinicopatho-logical factors using the χ2 test or fisher’s exact test. The results were expressed as the mean ± standard deviation. We adopted the kaplan-meier and log-rank methods to calculate sur-vival rates and compared the sursur-vival curves with the log-rank test. We performed variables of univariate and multivariate hazard ratios with the Cox regression model. A two-sided P<0.05 was considered statistically significant in all cases. We performed all statistical data by using Statistical Package for the Social Science (IBM Corp., Armonk, NY, USA) version 17.0.
Results
c-MET protein expression in RMS and normal tissue samples
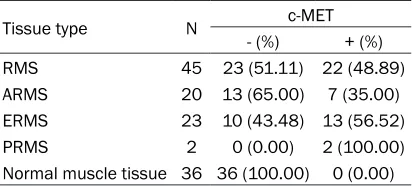
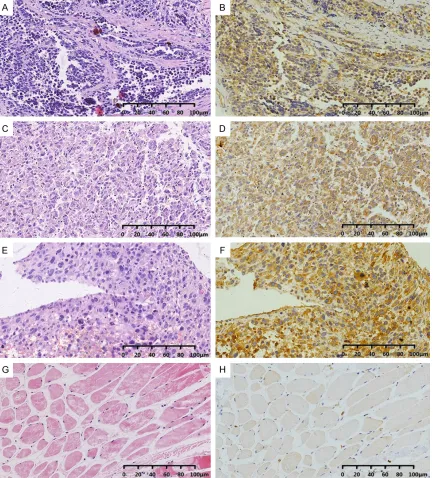
[image:3.612.91.297.96.189.2]c-MET protein expression was present in 22 (48.89%) of 45 RMS samples but absent in 36 normal controls, indicating that the c-MET expression levels in patients with RMS was sig-nificantly higher than those of normal controls (P<0.01; Table 1). In these RMS samples, 44.44% (20/45) were weakly expressed (1+), 4.44% (2/45) were moderately expressed (2+), and no cases were strongly expressed (3+). Moreover, we compared the expression of the c-MET protein in ERMS and ARMS with those in normal tissues. The results showed that the expression of the c-MET protein in both ERMS and ARMS was significantly higher than in nor -mal tissues (P<0.001). However, there was no significant difference in the c-MET expression between ERMS and ARMS (χ2=1.992, P=0.158). Furthermore, c-MET expression was mainly localized in the cytomembrane and cytoplasmic of RMS cells (Figure 1).
Table 1. c-MET expression in RMS patients and normal muscle tissue
Tissue type N c-MET
- (%) + (%) RMS 45 23 (51.11) 22 (48.89) ARMS 20 13 (65.00) 7 (35.00) ERMS 23 10 (43.48) 13 (56.52)
PRMS 2 0 (0.00) 2 (100.00)
Expression of c-MET mRNA in RMS and nor-mal tissue samples
We performed quantitative real-time polyme- rase chain reaction (qRT-PCR) to evaluate the relative expression of c-MET mRNA in 30 RMS tissue samples (17 ERMS, 12 ARMS, and 1 PRMS) and 15 normal muscle tissue samples. The quantity of c-MET mRNA expression in
RMS was 4.925 times higher than in the nor-mal controls. According to our statistical analy-sis, the relative expression of c-MET in RMS tissues was 9.033±2.492, which was signifi -cantly higher than that of normal tissue sam-ples 1.834±0.3904 (P=0.0492).
[image:4.612.92.525.72.550.2]cases with those in normal tissues. The expres-sion levels of c-MET mRNA in the ERMS and ARMS were 3.21-fold and 7.519-fold greater than those in normal tissues, respectively. The relative expression levels of c-MET in ERMS and ARMS were 5.888±1.605 (P=0.0276) and 13.79±5.68 (P=0.0264), respectively. Thus, the expression levels of c-MET mRNA in both ERMS and ARMS were significantly higher than in normal tissues and were statistically signifi -cant (P<0.05). However, the difference betwe-
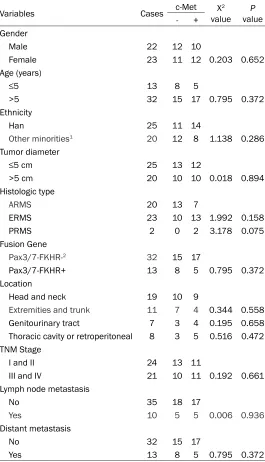
(2/7) ARMS (χ2=0.196, P=0.658) was consis-tent with the result.
The relationship between c-MET expression and the survival rates of patients with RMS
Of the 45 patients, 38 had a certain survival time with a follow-up duration ranging from 1.5 months to 117 months (mean 25 months), and the follow-up rate was 84.44% (38/45). Me- anwhile, the Kaplan-Meier and log-rank indicat-Table 2. Basic clinical characteristics of patients with c-MET
expression
Variables Cases c-Met valueX2 valueP - +
Gender
Male 22 12 10
Female 23 11 12 0.203 0.652
Age (years)
≤5 13 8 5
>5 32 15 17 0.795 0.372
Ethnicity
Han 25 11 14
Other minorities1 20 12 8 1.138 0.286
Tumor diameter
≤5 cm 25 13 12
>5 cm 20 10 10 0.018 0.894
Histologic type
ARMS 20 13 7
ERMS 23 10 13 1.992 0.158
PRMS 2 0 2 3.178 0.075
Fusion Gene
Pax3/7-FKHR-2 32 15 17
Pax3/7-FKHR+ 13 8 5 0.795 0.372
Location
Head and neck 19 10 9
Extremities and trunk 11 7 4 0.344 0.558 Genitourinary tract 7 3 4 0.195 0.658 Thoracic cavity or retroperitoneal 8 3 5 0.516 0.472 TNM Stage
I and II 24 13 11
III and IV 21 10 11 0.192 0.661
Lymph node metastasis
No 35 18 17
Yes 10 5 5 0.006 0.936
Distant metastasis
No 32 15 17
Yes 13 8 5 0.795 0.372
Note: 1: Including Uygur (n=17), Kazak (n=2), and Hui (n=1); 2: Including the fusion gene-negative ARMS (n=7), ERMS (n=23), and PRMS (n=2).
en the expression of c-MET mRNA in ERMS and ARMS was not sta-tistically significant (P>0.05). Correlations between c-MET ex-pression and clinicopathological parameters in the RMS samples
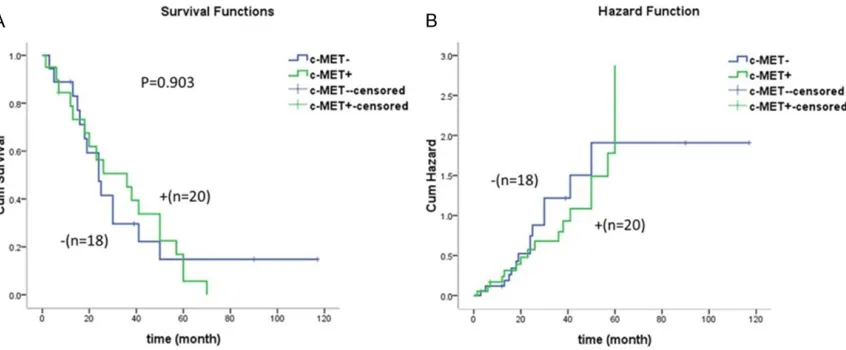
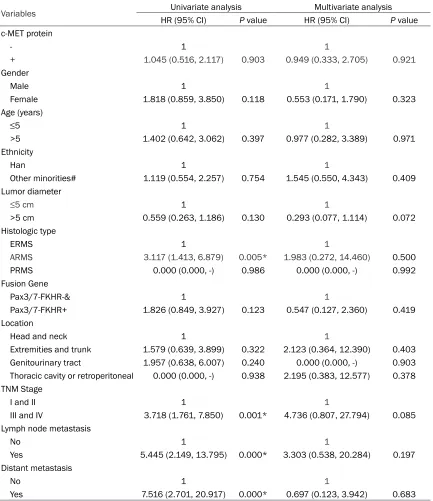
[image:5.612.93.358.97.559.2]ed that c-MET expression is not associated with prognosis, (χ2=0.042; P=0.837; Figure 2). We performed univariate and multivariate analyses for all clinicopathological factors (Table 3). In the univariate analysis, the histological type, tumor, node, and metastasis (TNM) stage, ly- mph node metastasis, and distant metastasis were found to be relevant factors that could affect the survival rates and prognosis of patients with RMS. However, independent prog-nostic factors for poor overall survival (OS) in RMS were nonsignificant under the multivariate analysis (Table 3).
Given that patients with ARMS and ERMS have different prognoses, we carried out a survival analysis separately for each group. c-MET pro-tein expression and OS were not associated in the ARMS group (χ2=0.004; P=0.948). However, c-MET expression did have a significant effect on OS in ERMS (χ2=9.673; P=0.002), where the patients with c-MET expression experienced worse outcomes and had higher risk of death after surgery than those with a negative expres-sion of c-MET.
As is well known, fusion-negative ARMS is a bio-logical equivalent of ERMS. Thus, we grouped the RMS as fusion-positive and fusion-negative and carried out a survival analysis. No relation-ship was observed between c-MET protein expression and OS in the fusion gene-positive patients (χ2=0.677; P=0.411). By contrast, a si- gnificant impact was observed between c-MET
expression and OS among fusion gene-nega-tive patients (χ2=5.400; P=0.020), similar to the results in ERMS.
Discussion
[image:6.612.96.519.72.247.2]Although our understanding of the molecular pathogenesis for RMS has improved in recent decades, the overall patient outcomes remain poor. Therefore, the current RMS situation leads us to search for biological markers in improving patient survival from RMS, which still has a poor prognosis and early metastasis in children. By functional annotation clustering of our previous study, we found that c-MET acted as proto-oncogene in ARMS [6]. Some studies showed that c-MET functions not only in ARMS, which takes a dominant genetic lesion in an upstream transcription factor, but also in ERMS, wherein the molecular mechanisms are intricate [17, 18]. Some previous studies dem -onstrated that c-Met down-regulation can sig-nificantly restrict the survival, invasiveness, proliferation, and anchorage-independent gro- wth of RMS cells [21]. Several studies proved that c-MET expression regulates the metastatic behavior of RMS [22, 23]. In this study, we found that c-MET expression at the protein and mRNA levels were significantly higher in RMS samples than in normal muscles. These results are consistent with those of Tiffin et al., who found that c-MET mRNAs are highly expressed in RMS samples [24]. In the study of Hou et al., positive staining was absent in normal muscle Figure 2. Kaplan Meier OS curves for c-MET-negative and -positive patients. The association between c-MET expres-sion and OS was absent (χ2=0.042, P=0.837). A: Cumulative survival function curves for patients with expressed
tissues [9]. In our study, no c-MET expression was observed in normal tissues.
[image:7.612.92.525.97.598.2]Apart from the migratory function in RMS, c-MET knockdown by shRNA in ERMS and ARMS inhibits cell proliferation and induces apoptosis and anchorage-independent growth
[25, 26]. Moreover, high levels of c-MET are widely expressed in both RMS subtypes in iso-lated marrow-infiltrating tumor cells, and high c-MET expression levels in RMS correlate with ARMS histology [27]. There’s research confirm -ing that both the expression levels of c-MET protein and mRNA are significantly higher in Table 3. Univariate and multivariate Cox proportional hazard models for the relationships between clinicopathological factors and survival
Variables Univariate analysis Multivariate analysis
HR (95% CI) P value HR (95% CI) P value c-MET protein
- 1 1
+ 1.045 (0.516, 2.117) 0.903 0.949 (0.333, 2.705) 0.921
Gender
Male 1 1
Female 1.818 (0.859, 3.850) 0.118 0.553 (0.171, 1.790) 0.323 Age (years)
≤5 1 1
>5 1.402 (0.642, 3.062) 0.397 0.977 (0.282, 3.389) 0.971 Ethnicity
Han 1 1
Other minorities# 1.119 (0.554, 2.257) 0.754 1.545 (0.550, 4.343) 0.409 Lumor diameter
≤5 cm 1 1
>5 cm 0.559 (0.263, 1.186) 0.130 0.293 (0.077, 1.114) 0.072 Histologic type
ERMS 1 1
ARMS 3.117 (1.413, 6.879) 0.005* 1.983 (0.272, 14.460) 0.500
PRMS 0.000 (0.000, -) 0.986 0.000 (0.000, -) 0.992
Fusion Gene
Pax3/7-FKHR-﹠ 1 1
Pax3/7-FKHR+ 1.826 (0.849, 3.927) 0.123 0.547 (0.127, 2.360) 0.419 Location
Head and neck 1 1
Extremities and trunk 1.579 (0.639, 3.899) 0.322 2.123 (0.364, 12.390) 0.403 Genitourinary tract 1.957 (0.638, 6.007) 0.240 0.000 (0.000, -) 0.903 Thoracic cavity or retroperitoneal 0.000 (0.000, -) 0.938 2.195 (0.383, 12.577) 0.378 TNM Stage
I and II 1 1
III and IV 3.718 (1.761, 7.850) 0.001* 4.736 (0.807, 27.794) 0.085 Lymph node metastasis
No 1 1
Yes 5.445 (2.149, 13.795) 0.000* 3.303 (0.538, 20.284) 0.197 Distant metastasis
No 1 1
ARMS compared to ERMS [28]. Similar to this result, Kacper et al. proposed that aggressive ARMS cells express higher c-MET levels than ERMS cell lines [22]. However, we found that c-MET proteins are more highly expressed in ERMS than in ARMS. The difference may be due to an insufficient number of tumors. In con -trast to protein expression, the relative expres-sion of c-MET mRNA in ARMS was higher than that in ERMS. This result is consistent with the discovery of Joseph et al. in RMS cells [29]. ARMS is typically characterized by the pres-ence of a fusion gene, and the human c-MET promoter presents as a potentially functional Pax3 binding site. Both Pax3 and PAX3/FKHR expression can increase c-MET expression lev-els during limb muscle development and in some RMS subtypes [30]. Furthermore, c-MET is a common denominator with PAX3-FKHR fusion protein for aberrant cell growth [20]. However, we found that no statistically signifi -cant relationship was observed between c-MET expression and the fusion gene. These results may be attributed to the discordance of c-MET expression in vitro and in vivo, the difference in the study objective, or the status of c-MET, which still needs further studies.
In this study, we analyzed the correlation of clinicopathological parameters with the expres-sion of c-MET protein. Although the expresexpres-sion of c-MET was clearly higher in patients with RMS than in the control group, the c-MET levels were not associated with any of the clinicopath-ological parameters, including lymphatic meta- stasis and distant metastasis. However, Jan- kowski et al. indicated that the c-MET-HGF axis can regulate the metastatic behavior of RMS cells and direct them to the lymph nodes and bone marrow [22]. Miekus et al. also confirmed that the inhibition of c-MET expression can lead to a low metastasized ability of ARMS cells to bone marrow cavities, possibly resulting from the insufficiency of our sample [31]. Thus, we could expand the sample size for further in-depth studies in the future.
Some previous studies found c-Met expression as an independent predictor of survival in mul-tiple malignancies, and it has been reported that overexpression of c-MET is associated with poor prognosis in cancer patients [32-34]. Edakuni et al. confirmed that the HGF/c-Met pathway acts primarily as a paracrine mitogen and affects some clinical factors, including
patient survival [35]. However, this study did not demonstrate any association between c-MET expression and survival. Nevertheless, we further explored the relationship between the c-MET expression and survival in different subtypes and fusion-negative and fusion-posi-tive types of RMS, respecfusion-posi-tively. We found that c-MET expression presents significant impacts on OS in ERMS and fusion gene-negative pa- tients. We considered that the size of the sam-ples, to a certain extent, may limit our findings. Besides, owing to the heterogeneity of our study population, the analysis of more samples and additional research are necessary to clear-ly confirm our findings.
In summary, our systematic study has shown that the expression of c-MET is higher in the tumors of patients with RMS than in the corre-sponding normal tissues. In addition, a signifi -cant impact was observed between c-MET expression and OS present in ERMS and fusion gene-negative patients. The findings in this st-udy scratched the unknown arena warranting further studies in molecular details. We should improve our clear understanding of tumor biol-ogy and identify the novel prognostic factors and targets for clinical therapy.
Acknowledgements
This work was supported by grants from the National Natural Science Foundation of China (Grant Nos. 81660441 and 81460404). Disclosure of conflict of interest
None.
Address correspondence to: Chunxia Liu and Feng Li, Department of Pathology, Shihezi University School of Medicine, Shihezi 832002, Xinjiang, China. Tel: 86-993-2057136; Fax: 86-993-205- 7136; E-mail: [email protected] (CXL); lifeng- [email protected] (FL)
References
[1] Zambo I, Veselý K. [WHO classification of tu -mours of soft tissue and bone 2013: the main changes compared to the 3rd edition]. Ces -koslovenská Patologie 2014; 50: 64-70. [2] Linardic CM. PAX3-FOXO1 fusion gene in
rhab-domyosarcoma. Cancer Letters 2008; 270: 10-18.
Triche TJ, Barr FG. PAX3-FKHR and PAX7-FKHR gene fusions are prognostic indicators in alve-olar rhabdomyosarcoma: a report from the children’s oncology group. J Clin Oncol 2002; 20: 2672-2679.
[4] Crose LE, Etheridge KT, Chen C, Belyea B, Tal-bot LJ, Bentley RC, Linardic CM. FGFR4 block-ade exerts distinct antitumorigenic effects in human embryonal versus alveolar rhabdomyo-sarcoma. Clin Cancer Res 2012; 18: 3780-3790.
[5] Tsafrir D, Bacolod M, Selvanayagam Z, Tsafrir I, Shia J, Zeng Z, Liu H, Krier C, Stengel RF, Ba-rany F, Gerald WL, Paty PB, Domany E, Notter-man DA. Relationship of gene expression and chromosomal abnormalities in colorectal can-cer. Cancer Res 2006; 66: 2129-2137. [6] Liu C, Li D, Jiang J, Hu J, Zhang W, Chen Y, Cui
X, Qi Y, Zou H, Zhang W, Li F. Analysis of mo-lecular cytogenetic alteration in rhabdomyo-sarcoma by array comparative genomic hybrid-ization. PLoS One 2014; 9: e94924.
[7] Wang YY, Sun C, Jiang JF, Xie Y, Li B, Cui X, Chen Y, Liu C, Li F. GLI1 expression is an impor-tant prognostic factor that contributes to the poor prognosis of rhabdomyosarcoma. Histol Histopathol 2016; 31: 329-337.
[8] Sun C, Liu CX, Li SG, Li H, Wang Y, Xie Y, Li B, Cui X, Chen Y, Zhang W, Li F. Overexpression of GEFT, a Rho family guanine nucleotide exch- ange factor, predicts poor prognosis in pa-tients with rhabdomyosarcoma. Int J Clin Exp Pathol 2014; 7: 1606-1615.
[9] Hou J, Dong J, Sun L, Geng L, Wang J, Zheng J, Li Y, Bridge J, Hinrichs SH, Ding SJ. Inhibition of phosphorylated c-Met in rhabdomyosarcoma cell lines by a small molecule inhibitor SU- 11274. J Transl Med 2011; 9: 64.
[10] Wu J, Yu J, Wu HB, Zheng LH, Ni XC, Li XQ, Du GY, Jiang BJ. Expressions and clinical signifi -cances of c-MET, p-MET and E2f-1 in human gastric carcinoma. BMC Res Notes 2014; 7: 6. [11] Agwa ES, Ma PC. Targeting the MET receptor tyrosine kinase in non-small cell lung cancer: emerging role of tivantinib. Cancer Manag Res 2014; 6: 397-404.
[12] Basilico C, Hultberg A, Blanchetot C, de Jonge N, Festjens E, Hanssens V, Osepa SI, De Boeck G, Mira A, Cazzanti M, Morello V, Dreier T, Saunders M, de Haard H, Michieli P. Four indi-vidually druggable MET hotspots mediate HGF-driven tumor progression. J Clin Invest 2014; 124: 3172-3186.
[13] Boccaccio C, Luraghi P, Comoglio PM. MET-mediated resistance to EGFR inhibitors: an old liaison rooted in colorectal cancer stem cells. Cancer Res 2014; 74: 3647-3651.
[14] Qin Y, Mcallister SS. SPSB1 may have MET its match during breast cancer recurrence. Can-cer Discov 2014; 4: 760-761.
[15] Iommelli F, De RV, Gargiulo S, Panico M, Monti M, Greco A, Gramanzini M, Ortosecco G, Fonti R, Brunetti A, Del Vecchio S. Monitoring rever-sal of MET-mediated resistance to EGFR tyro-sine kinase inhibitors in non-small cell lung cancer using 3’-deoxy-3’-[18F]-fluorothymidi-ne positron emission tomography. Clin Cancer Res 2014; 20: 4806-4815.
[16] Lordick F. Targeting the HGF/MET pathway in gastric cancer. Lancet Oncol 2014; 15: 914-916.
[17] Ferracini R, Olivero M, Di Renzo MF, Martano M, De Giovanni C, Nanni P, Basso G, Scotlandi K, Lollini PL, Comoglio PM. Retrogenic expres-sion of the MET proto-oncogene correlates with the invasive phenotype of human rhabdo-myosarcomas. Oncogene 1996; 12: 1697-705.
[18] Sharp R, Recio JA, Jhappan C, Otsuka T, Liu S, Yu Y, Liu W, Anver M, Navid F, Helman LJ, De-Pinho RA, Merlino G. Synergism between INK4a/ARF inactivation and aberrant HGF/SF signaling in rhabdomyosarcomagenesis. Nat Med 2002; 8: 1276-1280.
[19] Sierra JR, Tsao MS. c-MET as a potential thera-peutic target and biomarker in cancer. Ther Adv Med Oncol 2011; 3: S21-35.
[20] Taulli R, Scuoppo C, Bersani F, Accornero P, Forni PE, Miretti S, Grinza A, Allegra P, Schmitt-Ney M, Crepaldi T, Ponzetto C. Validation of met as a therapeutic target in alveolar and embryonal rhabdomyosarcoma. Cancer Res 2006; 66: 4742-4749.
[21] Jacobsen F, Ashtiani SN, Tennstedt P, Heinzer H, Simon R, Sauter G, Sirma H, Tsourlakis MC, Minner S, Schlomm T, Michl U. High c-MET ex-pression is frequent but not associated with early PSA recurrence in prostate cancer. Exp Ther Med 2013; 5: 102-106.
[22] Jankowski K, Kucia M, Wysoczynski M, Reca R, Zhao D, Trzyna E, Trent J, Peiper S, Zembala M, Ratajczak J, Houghton P, Janowska-Wieczorek A, Ratajczak MZ. Both hepatocyte growth fac-tor (HGF) and stromal-derived facfac-tor-1 regulate the metastatic behavior of human rhabdomyo-sarcoma cells, but only HGF enhances their resistance to radiochemotherapy. Cancer Res 2003; 63: 7926-35.
[23] Lukasiewicz E, Miekus K, Kijowski J, Drabik G, Wilusz M, Bobis-Wozowicz S, Majka M. Inhibi-tion of rhabdomyosarcoma’s metastatic be-havior through downregulation of MET recep-tor signaling. Folia Histochemica Et Cytobi- ologica 2009; 47: 485-489.
[24] Tiffin N, Williams RD, Shipley J, Pritchard-Jones K. PAX7 expression in embryonal rhabdomyo-sarcoma suggests an origin in muscle satellite cells. Br J Cancer 2003; 89: 327-332. [25] Marshall AD, Grosveld GC. Alveolar
7-FOXO1-induced tumorigenesis. Skeletal Mu- scle 2012; 2: 25.
[26] Kikuchi K, Tsuchiya K, Otabe O, Gotoh T, Tamu-ra S, Katsumi Y, Yagyu S, Tsubai-Shimizu S, Miyachi M, Iehara T, Hosoi H. Effects of PAX3-FKHR on malignant phenotypes in alveolar rhabdomyosarcoma. Biochem Biophys Res Commun 2008; 365: 568-574.
[27] Diomedicamassei F, Mcdowell HP, De Ioris MA, Uccini S, Altavista P, Raschellà G, Vitali R, Man-narino O, De Sio L, Cozzi DA, Donfrancesco A, Inserra A, Callea F, Dominici C. Clinical signifi -cance of CXC chemokine receptor-4 and c-Met in childhood rhabdomyosarcoma. Clin Cancer Res 2008; 14: 4119-4127.
[28] Megiorni F, Mcdowell HP, Camero S, Mannari-no O, Ceccarelli S, PaiaMannari-no M, Losty PD, Pizer B, Shukla R, Pizzuti A, Clerico A, Dominici C. Crizotinib-induced antitumour activity in hu-man alveolar rhabdomyosarcoma cells is not solely dependent on ALK and MET inhibition. J Exp Clin Cancer Res Cr 2015; 34: 112. [29] Pressey JG, Haas MC, Pressey CS, Kelly VM,
Parker JN, Gillespie GY, Friedman GK. CD133 marks a myogenically primitive subpopulation in rhabdomyosarcoma cell lines that are rela-tively chemoresistant but sensitive to mutant HSV. Pediatr Blood Cancer 2013; 60: 45-52. [30] Epstein JA, Shapiro DN, Cheng J, Lam PY, Maas
RL. Pax3 modulates expression of the c-Met receptor during limb muscle development. Proc Natl Acad Sci U S A 1996; 93: 4213-4218.
[31] Miekus K, Lukasiewicz E, Jarocha D, Sekula M, Drabik G, Majka M. The decreased metastatic potential of rhabdomyosarcoma cells obtain- ed through MET receptor downregulation and the induction of differentiation. Cell Death Dis 2013; 4: e459.
[32] Petterson SA, Dahlrot RH, Hermansen SK, K A Munthe S, Gundesen MT, Wohlleben H, Ras-mussen T, Beier CP, Hansen S, Kristensen BW. High levels of c-Met is associated with poor prognosis in glioblastoma. J Neurooncol 2015; 122: 517-27.
[33] Xu YP, Lin G, Sun XJ, Yan MH, Zhang G, Hu JL, Sun WY, Yu JM. C-met as a molecular marker for esophageal squamous cell carcinoma and its association with clinical outcome. J Cancer 2016; 7: 587-594.
[34] Boccaccio C, Comoglio PM. Invasive growth: a MET-driven genetic programme for cancer and stem cells. Nat Rev Cancer 2006; 6: 637-45. [35] Edakuni G, Sasatomi E, Satoh T, Tokunaga O,