© European Geosciences Union 2008
Geophysicae
Enhanced ion acoustic lines due to strong ion cyclotron wave fields
H. Bahcivan and R. Cosgrove
Center for Geospace Studies, SRI International, Menlo Park, CA, USA
Received: 7 March 2008 – Revised: 9 June 2008 – Accepted: 23 June 2008 – Published: 31 July 2008
Abstract. The Fast Auroral Snapshot Explorer (FAST) satel-lite detected intense and coherent 5–20 m electric field struc-tures in the high-latitude topside auroral ionosphere between the altitudes of 350 km and 650 km. These electric fields ap-pear to belong to electrostatic ion cyclotron (EIC) waves in terms of their frequency and wavelengths. Numerical sim-ulations of the response of an electron plasma to the par-allel components of these fields show that the waves are likely to excite a wave-driven parallel ion acoustic (IA) in-stability, through the creation of a highly non-Maxwellian electron distribution function, which when combined with the (assumed) Maxwellian ion distribution function provides inverse Landau damping. Because the counter-streaming threshold for excitation of EIC waves is well below that for excitation of IA waves (assuming Maxwellian statistics) our results suggest a possible two step mechanism for destabi-lization of IA waves. Combining this simulation result with the observational fact that these EIC waves share a com-mon phenomenology with the naturally enhanced IA lines (NEIALS) observed by incoherent scatter radars, especially that they both occur near field-aligned currents, leads to the proposition that this two-step mechanism is an alternative path to NEIALS.
Keywords. Ionosphere (Ionospheric irregularities; Plasma waves and instabilities) – Space plasma physics (Electro-static structures)
1 Introduction
The large-aperture, large-power incoherent scatter radars (ISR) are designed specifically to detect thermal electron density fluctuations and therefore are extremely sensitive to plasma instabilities. The naturally enhanced ion acoustic Correspondence to: H. Bahcivan
lines (NEIALs) are the radar backscatter from ion acoustic (IA) waves that are significantly enhanced above the thermal fluctuation levels. These lines have been of considerable in-terest because they may be signatures of strong field-aligned currents and/or plasma turbulence in the auroral ionosphere. The purpose of this paper is to show that NEIALs can be associated with electrostatic ion cyclotron (EIC) wave-like intense and sporadic spiky turbulent electric fields in the au-roral ionosphere.
A summary of NEIALs characteristics is as follows. The radar enhancements occur during intense red aurora and soft electron precipitation; the enhancements are usually 2–3 or-ders of magnitude larger than the quiescent values (such large enhancements cannot be associated with field-aligned irreg-ularities because the relevant ISR observations were made with the radar beam directed far away from perpendicularity to the magnetic field); the enhancements occur at a range of altitudes above 250 km, mostly occurring near 500 km, and can reach 1500 km; radar interferometric observations show that their transverse extent is several hundred meters; they last less than a few tenths of a second; the upshifted and downshifted spectral lines are not equally enhanced; the enhancements can more frequently be seen at 224 MHz as opposed to at 930 MHz and 1290 MHz (Collis et al., 1991; Wahlund et al., 1993; Rietveld et al., 1996; Cabrit et al., 1996; Forme et al., 2001; Grydeland et al., 2004). For an extensive review of NEALS, including observations and the-ories, see Sedgemore-Schulthess and St.-Maurice (2001).
resonantly interact with the IA oscillations. However, one problem with this mechanism is that current densities of more than 1 mA/m2 are required to trigger the CDEIA in-stability in the upper ionosphere. This current density is in excess of typically measured field-aligned currents, al-though there are recent theoretical and experimental stud-ies that show that the threshold for the CDEIA instability is significantly reduced if there is a transverse gradient in the relative magnetic field aligned drift (Gavrishchaka et al., 1998) or if the electron plasma is heated by Langmuir tur-bulence that leads to a higherTe/Ti ratio (Mishin and Fiala, 1995). Moreover, CDEIA instability cannot explain simulta-neous enhancements of both ion lines – a turbulent excitation process may explain the simultaneous enhancements. Forme et al. (2001); Kontar and P´ecseli (2005) suggested that simul-taneous enhancements of both ion lines can occur through parametric excitation of IA waves by coupling to beam-driven Langmuir waves. The simultaneous radar observa-tion of enhanced Langmuir waves and IA waves by Stromme et al. (2005) supports the parametric excitation mechanism, however, it is not a proof because the enhancements could be occurring independently.
The goal of this paper is to contribute to these studies by showing that IA oscillations are also sensitive to a different kind of energy source. We are going to consider EIC wave-driven IA excitations because: (1) there is in-situ evidence for strong EIC waves in the regions of enhanced backscat-ter observations, (2) the counbackscat-ter streaming current threshold for excitation of EIC waves is well below that for IA waves when the statistics are assumed to be Maxwellian, and (3) previous kinetic simulations, e.g. Rowland and Palmadesso (1981), showed that strong EIC wave fields can potentially distort the electron distribution function (EDF) f (x, v, t ). The starting point of this work is that the observed EIC-like waves have already been initiated by a field-aligned current instability mechanism, perhaps aided by shears and tempera-ture anisotropy, and we want to determine if IA waves can be excited by such EIC waves. We will carry out kinetic simula-tions for ion wave amplitudes comparable to the FAST satel-lite measurements and from the simulation we will compute the incoherent scatter spectra. To the extent that the spectrum is computable (the backscatter can be analyzed in terms of the fluctuation-dissipation theorem), the peak-to-valley ratio of the spectrum will be indicative of a near-instability condi-tion.
In the next sections, we are going to (1) present the FAST electric field measurements and discuss their EIC-like fea-tures, (2) describe a kinetic (Vlasov) code for computing the electron plasma response to ion wave fields and compute the electron distribution function, and (3) perform a Nyquist sta-bility analysis and calculate the incoherent scatter spectrum analysis from the computed distributions.
2 Electrostatic ion cyclotron waves
EIC waves are considered important plasma wave modes in and near auroral arcs. Field-aligned currents are considered as the primary energy source for these waves. Some of the field-aligned currents observed by spacecraft and ground-based instrumentation are sufficiently strong to excite the current-driven ion cyclotron instability (Kindel and Kennel, 1971; Satyanarayana et al., 1985; Ganguli et al., 1994).
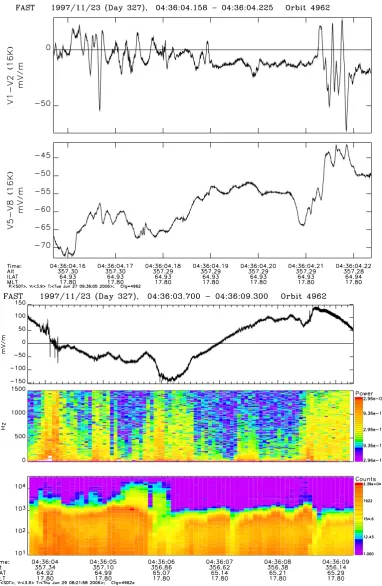
Some examples of FAST spacecraft electric field measure-ments from 360 km altitude are shown on the left side of Fig. 1 between 4.16 and 4.19 s, and between 4.21 and 4.22 s past 04:36 UT. The top and bottom panels show the time se-ries of electric field measurements made by DC coupled elec-tric field antenna of lengths, 5 and 56 m, respectively. The oscillations display a nearly sinusoidal wave form implying a spatially pure source. Under the “frozen-in” structures as-sumption, which is demonstrated to be valid below, the short-est scales are several meters in the direction transverse to the magnetic field. The right panels of Fig. 1 show their occur-rence in a broader context. The V1-2 signal (top panel) and its power spectra (middle panel) show broadband ELF emis-sions (reaching above 1 KHz) near the boundaries of elec-tron precipitation regions. The emissions are also in spatial proximity to large scale (>100 m) electric field structures su-perimposed on the 5-s period spin modulation. The EIC-like oscillations may be identified from the electric field power spectrum (middle panel) as broadband ELF spectral features above 500 Hz. However, because of their extremely short durations (≈0.05 s), they are more easily distinguished from the electric field time series as isolated, spiky, and oscillatory events as shown in the left panels of Fig. 1.
Another example of measurements from a higher altitude (562 km) is shown in Fig. 2 and demonstrates a distinction of the subject small-scale electrostatic structures from electro-magnetic oscillations with similar scales. The bottom panels are two subsets from the top panel, one coinciding with the intense DC magnetic perturbations and soft (<1 keV) elec-tron precipitation (on the left) and the other one occurring with no DC magnetic perturbations and in a region of hard (>1 keV) electron precipitation (on the right). The bottom-right panel shows a clear correlation between electric and magnetic fields indicating the electromagnetic nature of the oscillations, while the bottom-left panel shows no such cor-relation.
Fig. 1. Top two panels: FAST observations of EIC-like electric fields. The upper panel shows the V1-2 signal collected with a 5 m boom
Fig. 2. The center-top panels show the electric field power spectrum, DC magnetic field perturbations along the spin axis, and electron
energy spectra (in eV). The left-bottom panels show the V1-2 signal and the AC spin axis magnetic field perturbations from 0.04 s interval. The time of these left-bottom panels corresponds to the location of one of the two intense DC magnetic field perturbations shown in the center-top panels. The bottom-right panel shows the same signals as the bottom-left panels show, except that the time interval corresponds to a location in the hard (>1 keV) electron precipitation period of the center-top panels and away from DC magnetic field perturbations.
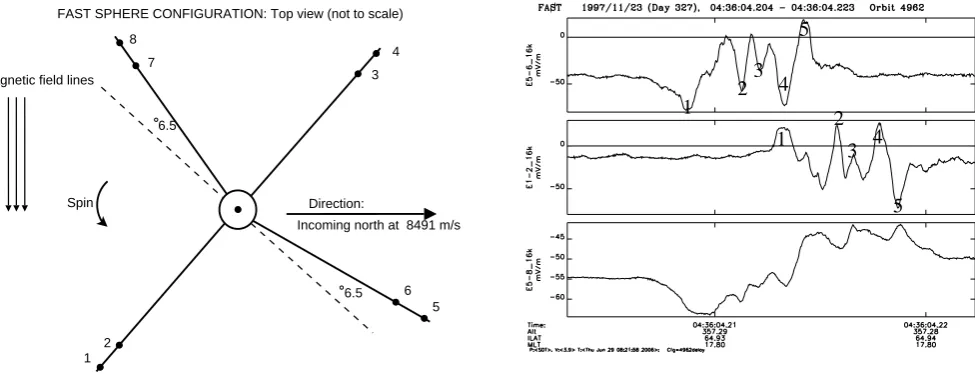
time series of electric field measurements given by the po-tential differences between spheres 1 and 2, 5 and 6, and 5 and 8, all of which are located on the spin plane. Clearly, the V1-2 signal is very similar (after sign reversal) to the V5-6 signal but with a lag (≈4 ms) corresponding to the separa-tion of the antennas (≈70 m) divided by the satellite speed (≈8 km/s). This reappearance of the V5-6 signal wave form in the V1-2 signal after a time delay that matches the time it takes for the spacecraft to traverse their separation clearly supports the “frozen-in” assumption. However, it also possi-ble that the waveforms have periods 10 ms or longer (at least several times longer than 4 ms). This means the frequency is<100 Hz, which would include the O+gyrofrequency of ≈40 Hz. Furthermore, the V5-8 signal is smoother, a con-sequence of nulling that can be expected as the wavelengths approach the dimensions of the electric field dipoles (LaBelle
and Kintner, 1989). Because the V5-6 signal has similar waveform as the V1-2 signal and the nulling effect is ob-served in the V5-8 signal indicate that the oscillations should have spatial scales between several meters and a few decame-ters.
[image:4.595.103.498.62.416.2]6.5 Magnetic field lines
6.5
2 7 8
3 4
5 6 Incoming north at 8491 m/s Spin
FAST SPHERE CONFIGURATION: Top view (not to scale)
1
Direction:
1 2
3 4
5
1 2
3 4
[image:5.595.56.544.66.254.2]5
Fig. 3. Left panel: A schematic view of the electric field sensors on the FAST satellite at 4.21 s past 04:36 UT. The EIC-like oscillations
of this time are seen on the right panel. Right panel: High-resolution electric field waveforms of the sensors V5-6, V1-2, and V5-8. The numbering 1 to 5 identifies spikes that can be matched (after sign reversal) from V5-6 signal to V1-2 after a time delay of approximately 4 ms.
whereρi is the ion gyroradius and k⊥ is the wavenumber
component transverse to the magnetic field lines. For an ion temperature of 1300◦K and B0=4.2×10⁻⁵T we have k⊥=0.31 1/m=2π/λ, and the instability maximizes for λ≤20.47 m. The oscillations seen in Fig. 1 have scales from several meters to a few decameters, in agreement with the scales predicted by the linear theory. The third reason is that the observed wave amplitudes match the predicted broad-band electric field amplitudes when the turbulence saturates by ion resonance broadening (Palmadesso et al., 1974):
(δE)2
8π = k⊥2
2π e2T 2
i
ω− i
i 2
(1) Considering the mode with the maximum linear growth rate (Satyanarayana et al., 1985), we have k2⊥ρ2i=1 and
ω=1.2i, and for Ti=1300 K the resulting wave electric field amplitude is 16 mV/m. The oscillations we observe are around tens of mV/m range and therefore in satisfactory agreement with the theory.
Previous studies using an order lower velocity spacecraft, i.e. sounding rockets, detected similar structures at similar al-titudes and similar proximities to field-aligned currents and suggested that the structures are EIC waves driven by field aligned currents. Bering et al. (1975) detected narrowband electric field oscillations with a sounding rocket at approx-imately 350 km altitude, in a region where the differential drift between ions and electrons was sufficient to destabi-lize the EIC wave. The detected wave forms are similar to the FAST measurements shown in Fig. 1 in terms of magni-tude and scale. The rocket measurements were assumed to be EIC waves because of the narrow bandwidth of the os-cillations and because their frequency range, after adjusting
for the Doppler shift due to the rocket velocity, was in agree-ment with this mode. Later, Bering (1984) detected similar waves with a different rocket in diffuse aurora at lower alti-tudes (≈150–250 km). There were narrow peaks in the close proximity of the O+and H+cyclotron frequencies and EIC
waves were suggested to be the possible causes for these os-cillations. More recently, Bonnell et al. (1996) using plasma wave interferometry reported the detection of H+EIC waves
at≈850 km altitude by AMICIST (interferometry was pos-sible because spacecraft velocity was much smaller than H+ cyclotron wave parallel or perpendicular phase velocity).
At somewhat higher altitudes in the topside auroral iono-sphere the Freja spacecraft (1700 km) detected BB-ELF emissions containing a mixture of Alfv´en, ion cyclotron, as well as IA waves (Wahlund et al., 1998). The Astrid-2 (1000 km) (Holback et al., 2001) detected similar BB-ELF emissions.
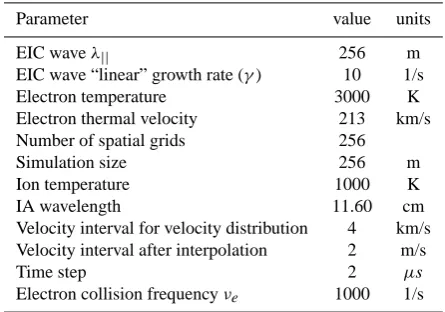
Table 1. Numerical simulation parameters.
Parameter value units
EIC waveλ|| 256 m
EIC wave “linear” growth rate (γ) 10 1/s
Electron temperature 3000 K
Electron thermal velocity 213 km/s Number of spatial grids 256
Simulation size 256 m
Ion temperature 1000 K
IA wavelength 11.60 cm
Velocity interval for velocity distribution 4 km/s Velocity interval after interpolation 2 m/s
Time step 2 µs
Electron collision frequencyνe 1000 1/s
wavelengths (Ott and Farley, 1975). This instability cannot be a cause for the oscillations because its frequency is of the order of the lower hybrid frequency, which is outside the pos-sible frequency range we infer. For this same reason, the oscillations should also be distinguished from upper hybrid wave packets (LaBelle et al., 1989) of similar scale sizes.
3 Electron distribution function distorted by EIC local wave fields, stability of IA waves, and enhanced inco-herent scatter radar spectra
The purpose of this section is to show that electron distri-bution function (EDF) perturbations, similar to those in the simulation works by Rowland and Palmadesso (1981), imply IA wave growth and therefore ISR spectral enhancements. 3.1 Electron distribution function
The analysis consists of setting an ion wave as the parallel component of a small aspect angle EIC wave and computing the motion of a column of electron plasma by solving a ki-netic equation in one dimension with the BGK collision term (Bhatnagar et al., 1954),
∂f ∂t +v
∂f ∂x+
e∂φ/∂x me
∂f
∂v = −νe(f−f0) (2)
We solve for the electric potential using Poisson’s equation
0∇2φ=ni−ne (3)
In Eq. (2), the background distribution functionf0is uniform
in space and Maxwellian in velocity, with the initial electron temperature. The electron densityneis obtained as
ne(x)= Z
f (x, v)dv (4)
Starting with zero, the normalized ion wave amplitude is in-creased with a linear growth rate parameterγ, untilt=t0, as
ni/n0=1+[γ (t−(t−t0)u(t−t0))]sin(k||z+ωeict ),
where u is the unit step function. Two values oft0are chosen to achieveni/n0=0.1 andni/n0=0.2. The frequency of the
ion wave is given by the EIC wave dispersion relation
ω2eic=ω2c+k2Cs2
where,ωcis the ion cyclotron frequency,kis the wavenum-ber, andCs is the ion sound velocity. The wavelength along the magnetic field is fixed atλk=256 m, and the
perpendicu-lar wavelength is adjusted to give two different phase veloci-ties along the magnetic field:Vp=20 km/s, andVp=40 km/s. These choices result inkk/ k⊥≈0.1 andk⊥≈1/ρi, whereρi is the ion gyroradious. In addition, for reference, we run the simulation withVpartificially set to zero.
Equations (2) and (3) are solved together using a finite dif-ference method. Starting from the initial distribution func-tion f (x,0)=f0, first the Poisson equation is solved and
thenf (x, t ) is iterated by 1t in time using the fourth or-der Runge-Kutta method. Then, ne(x) is computed from
f (x, t+1t ), andni is updated for the new time. The sim-ulation is cycled this way until a stationary solution in the ion wave reference frame is reached, that is,
∂f (x+Vpt )
∂t =0.
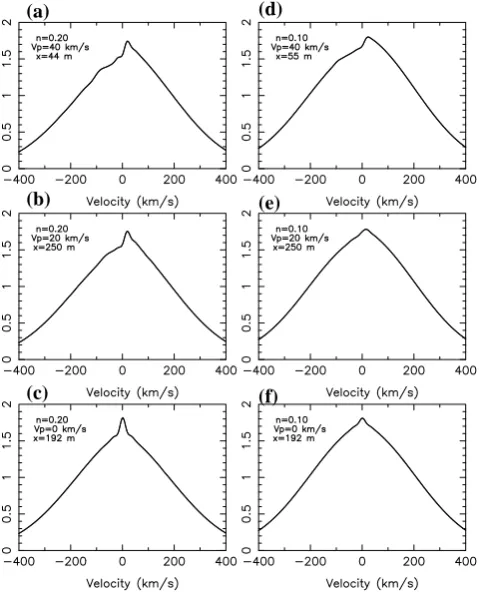
Figure 4 shows the resulting EDF contour plots for wave den-sity amplitudes of 20% (left panels) and 10% (right panels), and forVp=40, 20, and 0 km/s, top to bottom. Density max-ima corresponds to flat topped EDFs, where low energy elec-trons have been trapped by potential wells (potential≡ elec-tron potential energy). Density minima correspond to po-tential peaks and sharply peaked EDFs, where mid-to-high energy electrons have been depleted relative to low energy electrons. The depletion occurs because the mid to high en-ergy electrons are constantly moving away, and must be re-plenished with electrons from the neighboring region. Upon imposition of the potential structure, the neighboring region (to the potential peak) is in a potential well, so that the elec-trons replenishing those with velocityv must have a higher velocityv+1vat their origination point, that is, the replen-ishing electrons come from further down on the tail of the distribution function.
(a)
(b)
(c)
(d)
(e)
(f)
Fig. 4. Contours of EDF: (a)n≡20% andVp=40 km/s; (b)n≡20% andVp=20 km/s; (c)n≡20% and Vp=0 km/s; (d) n≡10% and
Vp=40 km/s; (e)n≡10% andVp=20 km/s; (f)n≡10% andVp=0 km/s. The 256-m long simulation box is repeated to 512-m.
In the caseVp>0 it is the electrons moving with the exact velocityVp that never move away from the potential max-ima, and whose numbers experience the greatest increase ac-cording to the supply and demand scenario. Hence, the EDF maxima is shifted in the direction of the phase velocity of the EIC wave. The resulting EDFs, shown in Fig. 5a, b, d, and e, are similar to the case forVp=0, except that they are not symmetrical, and have peaks shifted towardVp.
3.2 Ion acoustic stability analysis and incoherent scatter spectrum
Destabilization of ion acoustic waves requires that the cen-tral peak of the EDF is shifted past the phase velocity of ion acoustic waves (about 1 km/s, defined with respect to the ion distribution function), such that the Landau damping
from electrons becomes negative, and overcomes the (pos-itive) Landau damping from ions. For a Maxwellian EDF the shift must be on the order of the electron thermal veloc-ity, which implies a rather large electric field. However, for the sharply peaked EDFs shown in Fig. 5 the required shift is much smaller. We will analyze the stability of the EDFs obtained from our simulation using the Nyquist method.
The dispersion relation for electrostatic waves (e.g. Nicholson, 1983), which includes IA waves, is written
=0, where
=1+i +e=1+
ωe2 k2 Z
C
∂F /∂u
ω/ k−udu (5)
F (u)=Fi(u)+Fe(u)=
me
n0mi Z
fiδ(u−kˆ·v)dv+ 1
n0
[image:7.595.62.535.68.462.2](a)
(b)
(c)
(d)
(e)
[image:8.595.46.286.64.362.2](f)
Fig. 5. Individual EDFs near density minimums.
Z
feδ(u−kˆ·v)dv, (7)
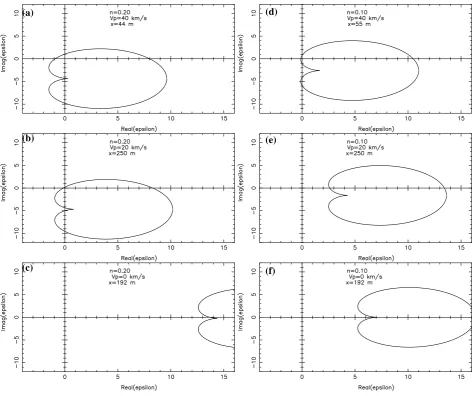
wherekˆ is a unit vector along the wave vector, which in our case we take to be along the magnetic field. The system is unstable if the dispersion relation=0 has solutions in the upper half of the complex frequency plane. The Nyquist method is to determine the number of such solutions by trac-ing out the pathξ traversed byasωencircles the upper half of the complex frequency plane (i.e.−∞<ω<∞, since as |ω|→∞,→1). As can be shown by a simple application of the residue theorem, the number of times that (the closed path)ξ circles the origin in the counterclockwise direction is the number of zeros ofin the upper half plane. (Circling in the clockwise direction is impossible.)
Figure 6 shows the curvesξ obtained by using the EDFs shown in Fig. 5 in Eq. (7). Note that the curvesξ are plotted for−3<ω/ k<3 km/s and they mostly correspond to the ion distribution function because the electron distribution func-tion does not change much over this interval. Figure 7 shows a representative drawing of the curveξ for−∞<ω/ k<∞ where the dashed curve corresponds to the electron distribu-tion funcdistribu-tion. The system is unstable for the caseVp=40 m/s,
ni/n0=0.2. Figure 9 showsξ at multiple positions for the
same set of simulations as in Fig. 4. Note that there are 256 positions, andξ for every position is plotted. A plasma in-stability occurs if any ofξ encircles the origin. The plasma
is stable for the stationary wave. In addition, for the same phase velocity, the increase of ion wave amplitude increases the number of curves encircling the origin.
The functionF is an effective distribution function deter-mining the effects of ion and electron Landau damping on IA waves. Using the residue theorem, it can be shown that the imaginary part of the dispersion function, forωon the real axis, is−πω2e
k2
dF
du|u=ω/ k. Therefore, the curveξ can only cross the real axis when the derivative ofF vanishes. Be-cause the imaginary part is positive forω→+∞, and nega-tive forω→−∞, to circle the origin in the counterclockwise directionξ must cross the real axis at least twice. Therefore, a necessary (the Nyquist criteria is necessary and sufficient) criterion for instability is that the effective distribution func-tionF must have two humps. It is this fact that gives rise to the common wisdom that the EDF must shift sufficiently with respect to the ion distribution function for the system to become unstable. When the EDF is sharply peaked as in Fig. 5, the required shift is not as far, and this explains why the system has become unstable at a relatively modest elec-tron drift. As a consistency check, a closeup of the function
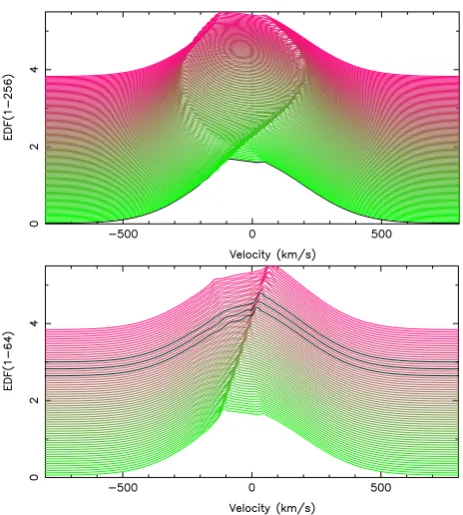
F is shown in Fig. 10, showing the emergence of two humps. Figure 8 (left panel) displays the EDFs at all 256 positions as a 3-D plot for the casen≡20% andVp=40 km/s. The right panel zooms into the first 64 positions and also shows the un-stable positions with black curves. The dominant feature of this set of EDFs is the “ridge” that crosses from negative to positive velocities as we advance in position. The unstable curves occur near where the ridge crosses the zero velocity axis. This means that the sharp gradient of EDF in velocity associated with the ridge must occur near the zero velocity axis so that strong inverse electron Landau damping occurs. Although we have already smoothed the EDF’s with a spline function, the EDFs are not entirely artifact free, which affects the IA stability. However, the “ridge” feature in the EDF is clearly not an artifact. Moreover, the clustering of the un-stable cases near where the ridge crosses the zero velocity axis is evidence that the stability is determined by the ridge feature.
Figure 11 shows the mean electron drift along the mag-netic field as a function of position along the wave. The peak electron drift for 20% wave amplitude is≈10 km/s, which is much lower than the critical drift (≈vt e) for IA instability required for Maxwellian electron and ions. This is a main point of this paper, that the current as inferred from the in-situ magnetometers does not need to be near the critical drift for the IA instability to occur.
We find that the peak electric potential forni=20% and
(a)
(b)
(c)
(d)
(e)
[image:9.595.60.536.61.457.2](f)
Fig. 6. The plasma dispersion curveC, found by mapping the curveCωfor the EDFs shown in Fig. 5.
≈30 mV/m fork⊥≈1/ρi, which when multiplied by 1/ √
2, corresponds to an RMS δE⊥=21 mV/m. This value is in
good agreement with the predicted broadband electric field (δE)of 16 mV/m calculated from Eq. (1), which is for tur-bulent saturation by ion resonance broadening (Palmadesso et al., 1974). In addition, the spiky electric fields measured by the FAST satellite, as seen in Fig. 1, have amplitudes of several 10s of mV/m, sometimes reaching 100 mV/m. We predict stronger EDF distortions and, therefore, a stronger IA instability for the measured electric fields.
The ISR spectrum can be calculated for the EDFs that are stable to IA waves. The ISR spectrum for a collisionless un-magnetized plasma with one Maxwellian ion species is given by (Dougherty and Farley, 1960):
S(k, ω)= 1
k
1+i(ω/ k)
(ω/ k)
2
Fe ω
k
(8)
Im(epsilon)
1 Re(epsilon)
w->+inf
w->-inf
[image:9.595.311.548.499.633.2]Fig. 8. Left: The EDF forn≡20% andVp=40 km/s over all 256 positions. Right: The EDF over the first 64 positions; the lines in black are unstable.
+ miZ
mek
e(ω/ k)
(ω/ k) 2 Fi ω k , (9)
whereZis the charge number of the ion species,Fe,iare the one-dimensional velocity distributions along the radar line-of-sight, and is the plasma dispersion function, both of which are given in Eq. (7). The electron and ion characteris-tic frequencies are given as
ω0e,i=
n0e2 0me,i
!1/2
The contour integral in Eq. (5) is evaluated as Z
C =P
Z ∞ −∞
− iπ (residue at v=ω/ k)
where the first term on the RHS is the principal value of the integral. For the ion species, we used a mass of 16 pro-tons, corresponding to O+ ions. The plasma can be
con-sidered collisionless for the purpose of ISR spectrum cal-culations because the (UHF/S-Band) ISR correlation time is much smaller than the mean time between collisions.
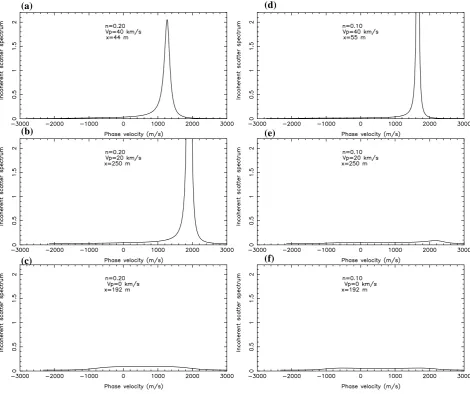
Figure 12 shows the ISR spectrum for 11.6 cm waves ac-cording to the Eq. (9) using the EDFs shown in Fig. 5. Note that the ISR calculations are inapplicable if the plasma is un-stable; however, we may interpret a “spike” in the calculated shape as an indicator that the denominator in Eq. (9) is ap-proaching zero, that is, a solution of the dispersion relation
lies near the realωaxis. It is clear that those panels in Fig. 12 that contain spikes match to the panels ofCin Fig. 9 that in-dicate instability based on the Nyquist stability criteria.
4 Discussion
The numerical simulations here show that strong EIC-like wave fields lead to non-Maxwellian electron distribution functions that look like “phase-space holes”, which are elec-tric potential structures that trap some portion of the electron velocity distribution (see p. 89 in Paschmann et al., 2003, and the references therein). Previous auroral region stud-ies associate the phase-space holes with the non-linear phase of plasma instabilities of mainly two-stream type, such as electron-ion drift and electron beams (e.g. Newman et al., 2001; Muschietti et al., 1999). In our case, phase-space holes occur periodically in space as a result of a large ampli-tude EIC wave potential structure along the magnetic field. The structure moves along the magnetic field with the par-allel phase velocity of the EIC wave, i.e.ωeic/ k||, which is
much greater than the ion acoustic/thermal velocity. To de-termine whether these EIC wave-induced phase-space struc-tures can be described in terms of an exact nonlinear elec-trostatic plasma structure, e.g. a Bernstein-Greene-Kruskal (BGK) electron hole (Bernstein et al., 1957), requires a sep-arate analysis. The main interest here is, rather, on the tran-sition region from one phase-space hole to another, and to determine if the structuring in the transition region near zero velocity could excite the IA instability.
The topic of wave-driven IA wave excitation was explored in our previous work (Bahcivan et al., 2006), which was on the enhancement of IA oscillations by the parallel electric fields of the Farley-Buneman waves in the E region. In that work, we used a kinetic code with a detailed modeling of electron collisions and solved for the EDF for a spatially homogeneous plasma along the magnetic field for a given RMS local parallel electric field. The solution contained non-Maxwellian features that lead to enhancements of IA oscilla-tions; however, an instability was unrealistic for a reasonable RMS parallel electric field in the collisional E region. On the other hand, because the F region electrons are much less collisional, the EDF could be easily distorted and an IA in-stability is more likely to occur.
The critical drift for the CDEIA instability is reduced if there is a transverse gradient in the relative magnetic field aligned drift. This effect was studied (Gavrishchaka et al., 1998, 2000), and experimentally demonstrated (Teodorescu et al., 2002; Agrimson et al., 2001). A transverse gradient is naturally present in an EIC wave structured electron flow because the electron drift is energized by EIC wave fields: in one phase the drift is upgoing, in another it is downgoing, and the opposing drifts are separated by λ⊥/2. The transverse
(a)
(b)
(c)
(d)
(e)
[image:11.595.48.549.66.475.2](f)
Fig. 9. The plasma dispersion curvesCplotted in each panel for all positions: (a)ni≡20% andVp=40 km/s; (b)ni≡20% andVp=20 km/s;
(c)ni≡20% andVp=0 km/s; (d)ni≡10% andVp=40 km/s; (e)ni≡10% andVp=20 km/s; (f)ni≡10% andVp=0 km/s.
(1988). For Maxwellian ions and electrons, the generalized susceptibility functionsG?e,i are related to the susceptibility functions in Eq. (5) as
e?=e
1+ V 0
de
µui
(10)
i?=i
1− V 0
di
ui
(11) whereu≡kz/ ky,Vdα0 =dV (dα)/dx, andµ=mi/me. Here,
ky and kz are the transverse and magnetic field aligned wavenumber components of the IA mode. The importance of the shear effect can be quantified as follows. Figure 4 shows the electron drift for the 20% wave amplitude: the drift is about 10 km/s. For simplicity assume that this drift repre-sents that of Maxwellian electrons, although the simulation
[image:11.595.344.504.532.658.2](a)
(b)
(c)
(d)
(e)
[image:12.595.59.535.63.239.2](f)
Fig. 11. The mean (parallel) electron drift as a function of position along the magnetic field: (a)n≡20% andVp=40 km/s; (b)n≡20% and
Vp=20 km/s; (c)n≡20% andVp=0 km/s; (d)n≡10% andVp=40 km/s; (e)n≡10% andVp=20 km/s; (f)n≡10% andVp=0 km/s.
(a)
(b)
(c)
(d)
(e)
(f)
[image:12.595.61.532.289.683.2]results here show otherwise. For a 10 m transverse wave scale, Vde0 will be on the order of 1000 s−1. Choosing
kz/ ky=0.1, we will find that for O+Vde0 /(µui)≈2×10−5. Furthermore, the ions in response to wave fields are essen-tially immobile in theB|| direction, that is, the ion drift is
on the ordermi/metimes less than the electron drift. Then,
Vdi0/(ui)1. Therefore, according to the simulation re-sults here and ignoring non-Maxwellian features of the par-ticle distributions, the transient gradient in the relative mag-netic field aligned drift as driven by the EIC wave has a neg-ligible effect on the amplitude of IA oscillations.
Additionally, the role of ion temperature anisotropy in the growth of shear-modified IA waves is to change the propa-gation direction orkz/ ky, which is a critical term of Gan-guli’s generalized dispersion relation (Spangler et al., 2002; Teodorescu et al., 2003). As explained above, for a wide range ofkz/ ky values, the shear effect as part of EIC wave oscillations will be insignificant, and therefore ion tempera-ture anisotropy needs to be addressed independently from the shear effect.
Determination of the relative significance of EDF distor-tion effect to shear and temperature anisotropy effect in the presence of strong parallel inhomogeneous flows requires an advanced higher-dimensional numerical simulation code.
The connection between EIC waves and NEIALs is sup-ported by their certain observational features. For instance, they appear to occur in the same environment, in associa-tion with field-aligned currents and soft electron precipita-tion. Moreover, Grydeland et al. (2004) made interferometric radar observations of filamented structures and showed that the echoes originate from very localized regions (≈300 m scales) perpendicular to the magnetic field at 500 km altitude. The FAST structures that we have shown have spatial extents (not scale size) between 70 and 400 m, in satisfactory agree-ment with Grydeland’s measureagree-ments.
It remains to be determined if the EIC-driven IA waves occupy a sufficiently large volume or have sufficiently large amplitudes to cause ISR backscatter enhancements with backscatter power comparable to that of NEIALs. Although the IA enhancements could occur only at a certain phase re-gion of the EIC wave, the EIC wave has a much faster phase velocity along B, so the IA waves can be excited everywhere, as long as they are kept alive by “EIC pumping”. We will ad-dress this question with a 2d-3v kinetic code in a future work. Finally, EIC waves have been associated with transversely energizing ions through a gyroresonant motion, and in-coherent scatter radars have often detected enhanced ion lines in the presence of ion upflows (Wahlund et al., 1992; Stromme, 1999). The same ion cyclotron waves that energize ion upflows could possibly be causing enhanced incoherent backscatter.
5 Conclusions
The large-amplitude EIC wave fields in the low-altitude auro-ral ionosphere can lead to non-Maxwellian electron distribu-tions with slopes in the distribution function that are unstable to IA waves. The FAST satellite detected such wave fields in the altitude regions where enhanced incoherent scatter was recorded. On the basis of the computed particle distributions in response to such fields and the corresponding dispersion relation and incoherent scatter spectrum calculations, radar ion lines can be enhanced by such large-amplitude ion waves through an “ion cyclotron wave-driven ion acoustic instabil-ity”.
This study will be followed by a higher dimensional code and including the ion dynamics to do a more complete sim-ulation. We will also be looking for additional evidence of enhanced incoherent scatter as indicator of EIC turbulence in the auroral regions by looking into a larger dataset of FAST satellite measurements and determining where and when EIC turbulence occur, and comparing with the onset of enhanced incoherent scatter.
Acknowledgements. This work was supported by NSF grant
no. ATM-0334122 to SRI International.
Topical Editor M. Pinnock thanks E. Mishin and another anony-mous referee for their help in evaluating this paper.
References
Agrimson, E., D’Angelo, N., and Merlino, R.: Excitation of ion-acoustic-like waves by subcritical currents in a plasma having equal electron and ion temperatures, Phys. Rev. Lett., 86(23), 5282–5285, 2001.
Bahcivan, H., Cosgrove, R., and Tsunoda, R.: Parallel electron streaming in the high-latitude E region and its effect on the in-coherent scatter spectrum, J. Geophys. Res., 111(A7), A07 306, doi:10.1029/2005JA011595, 2006.
Bering, E. A.: The plasma wave environment of an auroral arc: electrostatic ion cyclotron waves in the diffuse aurora, J. Geo-phys. Res., 89, 1635–1649, 1984.
Bering, E. A., Kelley, M. C., and Mozer, F. S.: Observations of an intense field aligned thermal flow and associated intense narrow band electric field oscillations, J. Geophys. Res., 80, 4612–4620, 1975.
Bernstein, I. B., Greene, J. M., and Kruskal, M. D.: Exact nonlinear plasma oscillations, Phys. Rev., 108, 546–550, 1957.
Bhatnagar, P. L., Gross, E. P., and Krook, M.: Model for collision processes in gases I. Small amplitude processes in charged and neutral one-component systems, Phys. Rev., 94, 511–525, 1954. Bonnell, J., Kintner, P., Wahlund, J. E., Lynch, K., and Arnoldy, R.: Interferometric determination of broadband ELF wave phase velocity within a region of transverse auroral acceleration, Geo-phys. Res. Lett., 23(23), 3297–3300, 1996.
Cattell, C., Bergmann, R., Sigsbee, K., Carlson, C., Chaston, C., Ergun, R., McFadden, J., Mozer, F. S., Temerin, M., Strange-way, R., Elphic, R., Kistler, L., Moebius, E., Tang, L., and Pfaff, R.: The association of electrostatic ion cyclotron waves, ion and electron beams and field-aligned currents: FAST observations of an auroral zone crossing near midnight, Geophys. Res. Lett., 25(12), 2053–2056, 1998.
Collis, P. N., Haggstrom, I., Kaila, K., and Rietveld, M. T.: EISCAT radar observations of enhanced incoherent scatter spectra: Their relation to red aurora and field-aligned currents, Geophys. Res. Lett., 18, 1031–1034, 1991.
Dougherty, J. P. and Farley, D. T.: A theory of incoherent scattering of radio waves by a plasma, Proc. Roy. Soc., A259, 79–99, 1960. Ergun, R. E., Carlson, C. W., McFadden, J. P., Mozer, F. S., De-lory, G. T., Peria, W., Chaston, C. C., Temerin, M., Elphic, R., Strangeway, R., Pfaff, R., Cattell, C. A., Klumpar, D., Shelley, E., Peterson, W., Moebius, E., and Kistler, L.: FAST satellite observations of electric field structures in the auroral zone, Geo-phys. Res. Lett., 25(12), 2025–2028, 1998.
Forme, F., Ogawa, Y., and Buchert, S. C.: Naturally enhanced ion acoustic fluctuations seen at different wavelengths, J. Geophys. Res., 106(A10), 21 503–21 515, 2001.
Foster, J. C., Pozo, C. D., Groves, K., and St-Maurice, J. P.: Radar observations of the onset of current-driven instabilities in the top-side ionosphere, Geophys. Res. Lett., 15, 160–163, 1988. Ganguli, G., Lee, Y. C., and Palmadesso, P. J.: Kinetic theory for
electrostatic waves due to transverse velocity shears, Phys. Flu-ids, 31, 823–838, 1988.
Ganguli, G., Keskinen, M. J., Romero, H., Heelis, R., Moore, T., and Pollock, C.: Coupling of microprocesses and macropro-cesses due to velocity shear: An application to the low-altitude ionosphere, J. Geophys. Res., 99(A5), 8873–8889, 1994. Gavrishchaka, V. V., Ganguli, S. B., and Ganguli, G. I.: Origin of
low-frequency oscillations in the ionosphere, Phys. Rev. Lett., 80(4), 728–731, 1998.
Gavrishchaka, V. V., Ganguli, G. I., Scales, W. A., Slinker, S. P., Chaston, C. C., McFadden, J. P., Ergun, R. E., and Carlson, C. W.: Multiscale coherent structures and broadband waves due to parallel inhomogeneous flows, Phys. Rev. Lett., 85(20), 4285– 4288, 2000.
Grydeland, T., Blixt, E. M., Lovhaug, U. P., Hagfors, T., Hoz, C. L., and Trondsen, T. S.: Interferometric radar observations of fila-mented structures due to plasma instabilities and their relation to dynamic auroral rays, Ann. Geophys., 22, 1115–1132, 2004, http://www.ann-geophys.net/22/1115/2004/.
Holback, B., Jacksen, A., Ahlen, L., Jansons, S. E., Eriksson, A. I., Wahlund, J. E., Carozzi, T., and Bergman, J.: LINDA – the Astrid-2 Langmuir probe instrument, Ann. Geophys., 19, 601– 610, 2001,
http://www.ann-geophys.net/19/601/2001/.
Kindel, J. M. and Kennel, C. F.: Topside current instabilities, J. Geophys. Res., 76, 3055–3078, 1971.
LaBelle, J. and Kintner, P. M.: The measurement of wavelength in space plasmas, Rev. Geophys., 27(4), 495–518, 1989.
LaBelle, J., Kintner, P. M., Yau, A. W., and Whalen, B. A.: Large amplitude wave packets observed in the ionosphere in associa-tion with transverse ion acceleraassocia-tion, J. Geophys. Res., 91, 7113– 7118, 1989.
Louarn, P., Wahlund, J. E., Chust, T., de Feraudy, H., Roux, A.,
Holback, B., Dovner, P. O., Eriksson, A. I., and Holmgren, G.: Observations of kinetic Alfv´en waves by the Freja satellite, Geo-phys. Res. Lett., 21, 1847–1850, 1994.
Mishin, E. V. and Fiala, V.: Radiation of whistlers by the ion-acoustic turbulence in the ionosphere, J. Geophys. Res., 100(A10), 19 695–19 700, 1995.
Mozer, F. S., Ergun, R., Temerin, M., Cattell, C., Dombeck, J., and Wygant, J.: New features of time domain electric-field structures in the auroral acceleration region, Phys. Rev. Lett., 79(7), 1281– 1284, 1997.
Muschietti, L., Ergun, R. E., Roth, I., and Carlson, C. W.: Phase-space electron holes along magnetic field lines, Geophys. Res. Lett., 26, 1093–1096, 1999.
Newman, D. L., Goldman, M. V., Spector, M., and Perez, F.: Dy-namics and instability of electron phase-space tubes, Phys. Rev. Lett., 86, 1239–1242, 2001.
Nicholson, D. R.: Introduction to Plasma Theory, Wiley, New York, 1983.
Ott, E. and Farley, D. T.: Microinstabilities and production of short wavelength irregularities in the auroral F region, J. Geophys. Res., 80(34), 4599–4602, 1975.
Palmadesso, P. J., Coffey, T. P., Ossakow, S. L., and Papadopou-los, K.: Topside ionosphere ion heating due to electrostatic ion cyclotron turbulence, Geophys. Res. Lett., 1, 105–108, 1974. Paschmann, G., Haaland, S., and Treumann, R. T. (Eds.): Auroral
Plasma Physics, Kluwer, 2003.
Kontar, E. P. and P´ecseli, H. L.: Nonlinear wave inter-actions as a model for naturally enhanced ion acoustic lines in the ionosphere, Geophys. Res. Lett., 32, L05110, doi:10.1029/2004GL02218, 2005.
Rietveld, M. T., Collis, P. N., van Eyken, A. P., and Lvhaug, U. P.: Coherent echoes during EISCAT UHF Common Programmes, J. Atmos. Terr. Phys., 58, 161–174, 1996.
Rowland, H. L. and Palmadesso, P. J.: One-dimensional direct cur-rent resistivity due to strong turbulence, Phys. Fluids, 24(5), 832– 838, 1981.
Satyanarayana, P., Chaturvedi, P. K., Keskinen, M. J., Huba, J. D., and Ossakow, S. L.: Theory of the current-driven ion cyclotron instability in the bottomside ionosphere, J. Geophys. Res., 90, 2209–2218, 1985.
Sedgemore-Schulthess, F. and St.-Maurice, J. P.: Naturally en-hanced ion-acoustic spectra and their interpretation, Surv. Geo-phys., 22, 55–92, 2001.
Spangler, R. S., Scime, E. E., and Ganguli, G. I.: Parallel inhomo-geneous flow in a thermally anisotropic plasma: The electrostatic ion-acoustic branch, Phys. Plasmas, 9(6), 2526–2533, 2002. St-Maurice, J. P., Noel, J. M., and Perron, P. J.: An assessment
of how a combination of shears, field-aligned currents and col-lisions affect F region ionospheric instabilities, J. Plasma Phys., 73, 69–88, 2007.
Stasiewicz, K., Bellan, P., Chaston, C., Kletzing, C., Lysak, R., Maggs, J., Pokhotelov, O., Seyler, C., Shukla, P., Stenflo, L., Streltsoz, A., and Wahlund, J. E.: Small scale Alfv´enic structure in the aurora, Space Sci. Rev., 92, 423–533, 2000.
Stromme, A.: Anomalous ion spectra and ion upflow observed with the EISCAT Svalbard Radar, Cand. Scient. Thesis, University of Tromso, Tromso, 1999.
in-teractions in the polar ionosphere and its relation to naturally enhanced ion acoustic lines, Geophys. Res. Lett., 32, L05 103, doi:10.1029/2004GL0202, 2005.
Teodorescu, C., Reynolds, E. W., and Koepke, M. E.: Experimental verification of the shear-modified ion-acoustic instability, Phys. Rev. Lett., 88(18), 185 003, doi:10.1103/PhysRevLett.88.185003, 2002.
Teodorescu, C., Koepke, M. E., and Reynolds, E. W.: On the role of ion temperature anisotropy in the growth and propagation of shear-modified ion-acoustic waves, J. Geophys. Res., 108(A1), 1043, doi:10.1029/2002JA009395, 2003.
Tsunoda, R. T.: High latitude F region irregularities: a review and synthesis, Rev. Geophys., 26(4), 719–760, 1988.
Wahlund, J. E., Forme, F. R. E., Opgenoorth, H. J., Persson, M. A. L., Mishin, E. V., and Volokitin, A. S.: Scattering of elec-tromagnetic waves from a plasma: enhanced ion acoustic fluc-tuations due to ion-ion two-stream instabilities, Geophys. Res. Lett., 19, 1919–1922, 1992.
Wahlund, J. E., Opgenoorth, H. J., Forme, F. R. E., Persson, M. A. L., Haggstrom, I., and Lilensten, J.: Electron energization in the topside auroral ionosphere: On the importance of ion-acoustic turbulence, J. Atmos. Terr. Phys., 55, 623–645, 1993. Wahlund, J. E., Eriksson, A. I., Holback, B., Boehm, M. H.,