Grade 8 - 12 Skills Booklet
Natural Sciences / Life Sciences / Physical Sciences
Dainfern College
Table of Contents
1. Experimental Design:...1
2. The Scientific Method:...2
3. Recording Results:...4
4. Drawing Skills...8
5. Microscopy...9
6. Measuring quantities accurately...11
7. Lighting the Bunsen burner:...11
8. What to bring to a practical / practical exam:...12
9. Essay Writing Skills...12
10. Summary Skills...14
1. Experimental Design:
How to plan your scientific investigation: It refers to the method of thinking that the scientist uses to go about finding out things.
1.1. Observations are made. A Scientist observes that something happens in a certain way and therefore decides to investigate further.
1.2. Phenomena are identified and questions posed: You need to decide on an area of investigation and list a number of questions you would like to investigate.
1.3. Situations are analyzed and investigative questions formulated: This is where you decide which question you would like to investigate, you cannot choose something that would require very specialized
equipment and knowledge. Choose something that you can investigate at home.
1.4. Hypotheses and predictions are made: Try to forecast a possible solution. This can be proven right or wrong. It must be given as a statement. It is often referred to as an educated guess.
1.5. Data is collected: Before you carry out any investigation it is important that you first research your topic to gather valuable information and to determine where a similar investigation has already been
undertaken.
1.6. Investigative plans of action are formulated (Method): This must be a fair test. Only one variable should be investigated in any one experiment. Include exactly what you will need to measure and how you will go about measuring it.
1.7. Investigation is carried out: This is really fun.
2. The Scientific Method:
When asked to write up a practical you need to follow the Scientific Method.
a. Title: Each practical write up should have an appropriate title.
b. State the hypothesis:
This is an explanation capable of being tested by observations or experiments. It can be formulated from an inspired/ educated guess.
N.B. A hypothesis is to be written as a statement and never as a question. It refers to the relationship between two variables. The variables must be able to be measured.
c. Aim: states the object of the exercise in one or two sentences
d. Apparatus:
List the apparatus that will be required in the practical.
e. Method/Procedure:
Summary of what will be done in the practical to achieve the aim. It should be written in the passive, perfect tense. E.g. Heat the water and not the water was heated.
It must be written in point form and in a way that is easy to follow.
It must state exactly what is to be measured.
It must always state the results must be recorded in a table and that the experiment should be repeated to prove the reliability of the results.
The method must state what results will be collected, when they will be collected, how they will be measured, for how long they will be collected, how they will be recorded and how they will be used to reach a conclusion.
Any scientific procedure always has variables and controls.
Variables may be measured or varied during the experiment.
Controls must be kept constant and not allowed to change during the experiment. Controls are used to validate your results and compare your results against them.
The method must indicate how the variables will be controlled.
f. Results:
Displays the observations made in the practical using graphs, tables, diagrams or a short write up of your observations.
When making observations ensure that you state what you have observed or seen from the start to the end of the experiment.
g. Conclusion:
This is done once the practical has been completed and all the observations recorded calculations
performed. It is made after considering and, making deductions from the results. It is usually linked to the aim.
If asked to validate your hypothesis/conclusion you need to ALWAYS state data from your results.
h. Expansion:
Analyse the practical critically and make suggestions on how to expand or improve the method to get more accurate results:
Repeat 2 or more times to show that the results are reliable i.e. similar results are obtained each time the experiment is repeated. If different results are achieved the accuracy of the measuring method is low or there is an interfering variable that has not been controlled properly. The method needs to then be adjusted. If you only obtained one set of results you cannot check for inconsistencies.
Increase the precision and accuracy of the measurements. Use a mass meter to measure quantities instead of a teaspoon etc. Use a scale that measures mg instead of g.
Consider the purity of your reagents: tap water contains dissolved salts; rock salt is not pure sodium chloride etc.
i. Precautions:
To prevent handling errors e.g.:
Be careful not to contaminate the one substance with the other - i.e. wash apparatus each time after use.
If using a syringe, ensure that all the bubbles are expelled from the liquid in the syringe before taking the volume reading.
Measure volume at the bottom of the meniscus. To prevent injury e.g.:
Is protective equipment needed? (gloves, goggles, masks)
Are the reagents volatile, corrosive, flammable? They will require special handling. Ensure that you know the safety risks involved with the equipment and reagents you are using before you begin your experiment. All Laboratories contain a file of Materials Data sheets for your information.
j. How to Critique and experimental Design:
When asked to critique the design of an experiment you need to ask yourself whether the design is a FAIR TEST or not.
You then need to state the problems in the design and state how you could change the design to make it a FAIR TEST. See explanation of variables below.
Fair Test: In a fair test all the variables must be controlled and the same except for the variable being tested. This allows an accurate and reliable result to be drawn.
Definition of variables:
Variables are factors that may change during the course of the experiment. There are 3 different types of variables:
a. Independent/ manipulated/ input variable: They are deliberately manipulated and controlled by the biologist to note what effect they will have.
b. Dependent/responding/output variable: The variable that is being investigated. It is measured and will change in response to the independent variable.
c. The constant/fixed variables: All the other variables that could have any affect on the results on the experiment. They must be kept constant in order so it does not interfere with the results of the experiment.
Control:
3. Recording Results:
3.1. Tables:Tables are the easiest way of presenting numerical data.
The rows (across) and columns (down) represent the two variables of the experiment.
The heading must be descriptive and at the top of the table.
The manipulated / independent / input variable must be written in the first column.
The responding / dependent / output variable is written in the second and subsequent columns.
Plan your table carefully before drawing it out.
Always use a ruler when drawing up your table.
The headings for the columns and rows must contain: o Full information about the numbers being used.
o Units used (DO NOT INCLUDE UNITS IN THE BODY OF THE TABLE)
Example:
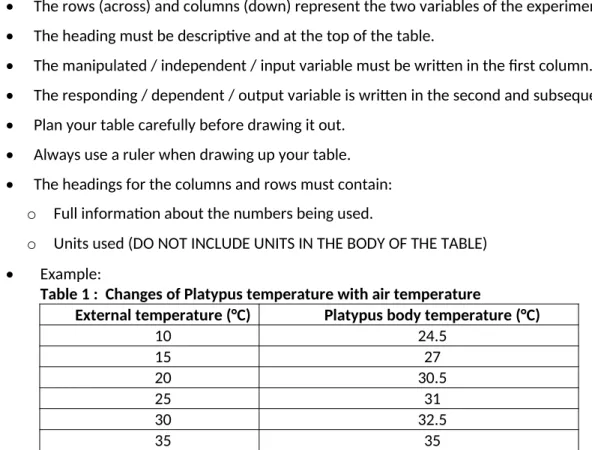
Table 1 : Changes of Platypus temperature with air temperature
External temperature (°C) Platypus body temperature (°C)
10 24.5
15 27
20 30.5
25 31
30 32.5
35 35
The relationship between the variables in a table is not easy to see. In order to make this clearer, the information in a table is often made more visual by constructing a graph.
3.2. Graphs
Graphs are very useful in Biology/Science, where they can be used to represent results very clearly. The different graphs are used depending on the sort of data being used.
Characteristics:
1. Horizontal (x-axis) is used to show the independent or manipulated or input variable.
2. Vertical axis (y-axis) is used to show the dependent or responding or output variable.
3. Each axis must be drawn in and labeled fully (quantity and units of measurement.)
4. The scale division must be carefully chosen – the final graph should fill as much of the graph paper as possible. Each scale division must be the same size and represent the same value.
5. Plot clearly and accurately.
a. Line graph:
o Most commonly used.
o Used for data that has a distinct manipulated and a distinct responding variable.
Represent the data below using a line graph:
The affect of external temperature on the body temperature of Platypus
Identifying trends in line graphs:
Draw a line of best fit: this is a smooth continuous line that does not have to go through all the points on the graph. Its purpose is to show you the shape of the graph or the trend in the data. It is also called a trend-line.
Analyse the shape of the graph
As x increase y increases As x increase y increases exponentially
y is directly proportional to x (This can only be said if the
trend-line is a straight trend-line that passes through the origin).
As x increases y decreases As x increases y decreases. This shape suggests inverse proportionality. To prove inverse
proportionality plot y vs 1/x
y is directly proportional to 1/x
y is inversely proportional x External temperature (°C) Platypus body temperature (°C)
10 24.5
15 27
20 30.5
25 31
30 32.5
35 35
y
ax
is
x axis
y
ax
is
x axis
y
ax
is
x axis
y
ax
is
x axis
y
ax
is
x axis
y
b. Histograms:
Used for data where the independent variable has the same unit but separate categories.
The bars touch each other, as they all represent similar data.
Use a histogram to present the following data:
Number of fish according to size class
Length of size class (mm) Number of fish
0 – 50 2
51 – 100 3
101 – 150 10
151 – 200 15
201 – 250 5
251 – 300 3
c. Bar Charts:
Used for data where the independent variable is not a number.
The bars are not related therefore there must be an equal sized gap between each bar.
Use a bar graph/chart to represent the information below:
Fat Content in some foods
Type of Food Grams of fat per kilogram food
Maize 20
Bread 10
Milk 32
Egg 100
Chicken 80
Beans 23
d. Pie Charts
Illustrates the proportions of an identifiable whole. The circle of the graph is divided into segments which indicate the relative proportions of the parts.
To find the angle of each sector: d = V x 360 T
Where d = angel of sector in degrees V = actual amount of variable
T = grand total
Always start at “12 o’clock”, with the angle for the largest proportion and work down to the smallest segment.
Label each segment.
Illustrate the information below using a pie chart.
The table below shows the blood groups of a sample of 100 000 people living in the British Isles
Blood group Number
O 51 000
A 36 000
B 10 000
An exception to the rule of plotting the independent variable on the X axis
Very occasionally it is necessary to draw a line graph where the independent variable is not on the X axis.
Example 1:
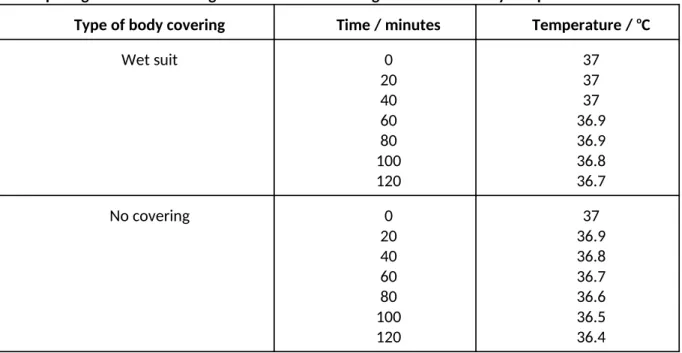
A line graph drawn for an investigation into the effect of using a wetsuit on the body temperature of someone kept in water. If two people are used and one person (the experiment) has a wetsuit and the other person (the control) does not have a wetsuit and they stay under water for 2 hours, with their body temperature being measured every 20 minutes for the duration of the investigation, then the table of results will look like this.
Table comparing the effect of using a wetsuit and not using a wetsuit on body temperature over two hours
Type of body covering Time / minutes Temperature / oC
Wet suit 0
20 40 60 80 100 120 37 37 37 36.9 36.9 36.8 36.7
No covering 0
20 40 60 80 100 120 37 36.9 36.8 36.7 36.6 36.5 36.4
The independent variable in this investigation is the presence or absence of a wet suit. When plotting a graph of this information, however, the only way to do it is to place time on the X axis, body temperature on the Y axis and have two lines - with a wet suit and without a wet suit. Draw a graph to illustrate the results recorded in the table above.
Example 2: Ohm’s law
Sometimes the value of the gradient of the graph is needed for the investigation. When investigating Ohm’s law the current depends on the voltage provided. Therefore the independent variable is voltage (V) and the dependent variable is current (I). However to obtain resistance (R) we needs to plot voltage vs current and not current vs. voltage because R = V/I.
V o lt ag e ( V ) Current (A)
4. Drawing Skills
Take note of the following important points:
Drawing:
You need to draw what you see, and not what you have learnt or what you think you should see!
A sharp HB pencil must be used for all diagrams.
Narrow continuous clear lines must be drawn, you may NOT sketch
Diagrams should not be smaller than half a page.
No shading is allowed.
Take note of accuracy of detail and proportion.
Labelling:
The caption for each illustration needs to be written below the diagram and include the following important point:
o The subject of the diagram, i.e. what you are drawing.
o The source of the diagram, i.e. where you are drawing from (live specimen, micrograph, slide etc.) o The view you are drawing (surface view, longitudinal section, cross section, etc.)
o Magnification ( x 200, x 0.25)
o You need to use the following wording: A Biological drawing of a…… drawn in …..view from…….. ( x…..)
Label lines should never cross and always be drawn using a ruler.
Labels to be written in pen and annotated in detail.
Labels should be written in small letters unless named after someone e.g. nucleus, Golgi apparatus
Scaling and magnification:
Magnification: The number of times a drawing is bigger or smaller than the actual size.
E.g. (x 2) means that the diagram is twice as big as the actual object, while (x 0,25) means that the diagram is a quarter of the size of the actual object.
Scale: These are indicated on the diagram and can be used to calculate the magnification of the diagram. E.g. 25 mm : 10 m
This means that every 25 mm on the diagram represents 10 micrometers (µm) in reality.
To calculate the magnification:
Magnification = Size of image/drawing/ micrograph OR Magnification = Length of scale line measured Size of object/ actual size. Length of scale line given
When applying either of these formulae, both lengths must be converted to the same unit.
Hint: Always measure in mm and multiply by 1000 to convert to micrometers (µm).
1000 µm = 1 mm
Magnification= 25 mm x 1000 = 25 000µm = 2500 X 10µm 10µm
5. Microscopy
All microscopes consist of a system of lenses arranged so that a magnified image of a specimen can be seen by the viewer.
Use of the Compound Microscope
The microscopes used at school level are monocular compound microscopes which use transmitted light, i.e. light that passes through the object you are looking at. There fore the specimen you look at must be thin enough for light to pass through.
Make sure you know the functions of the different parts of the microscope.
Functions 1.
2. 3. 4. 5. 6. 7. 8. 9. 10. 11. 12. 13.
12
13
Setting up the microscope
1. Plug in and switch on the lamp.
2. Adjust the revolving nosepiece so that the low power objective lens clicks into position.
3. Open the iris diaphragm to its fullest extent (it is fully open when the light shining through the hole in the middle of the stage is at its brightest).
4. Using the condenser knob, raise the condenser (if there is one) to its highest position and then adjust it so that the surface of the condenser is just below the upper surface of the hole in the middle of the stage.
5. Place your slide on the centre of the stage directly over the light. Clip the slide into place using the stage clips.
6. Adjust the position of the slide so that the specimen lies at the centre of the hole in the stage. You do not need to look down the ocular to do this.
Focusing the microscope
1. Adjust the coarse focus knob until the low power objective is as close to the slide as possible.
2. Look through the ocular with one eye (do not close the other eye!)
3. While looking through the ocular at the circle of light, turn the coarse focus adjustment knob until the specimen comes into focus.
4. Now turn the fine focus adjustment knob until the focus is at its sharpest.
5. Still looking through the ocular, adjust the condenser and/or diaphragm until you are happy with the light intensity.
6. To view the specimen at higher power, swing the lOX and then the 40X objective into position. Adjust the focus using the fine adjustment knob only.
7. Adjust the iris diaphragm for the best light for viewing.
N.B.
o If at any time you lose focus, return to the low power objective and begin again.
o Never remove a slide while a high power objective lens is in position Always turn to the low power objective, lower the stage and remove the slide.
Making a wet mount
Wet mounts are used for observing fresh specimens, by following the steps below:
1. Isolate the specimen.
2. Place the specimen in a small droplet of fluid e.g. water, on a microscope slide.
3. Gently lower a coverslip onto the droplet, using a dissecting needle. Avoid air bubbles.
4. Remove any excess liquid on or around the coverslip with absorbent paper.
Note: The specimen may be stained e.g. using a procedure called irrigation.
o A drop of stain is placed at the side of the coverslip of the mounted specimen, so that it comes into contact with the water underneath the coverslip.
o The water is then touched with a piece
of blotting paper at the other end of the coverslip.
6. Measuring quantities accurately
6.1. Measuring Mass: Before placing the object to be weighed on the pan, check that the balance reading is zero.
If using a triple beam balance, make sure the weighing arm has stabilised before taking your reading.
When weighing powder that may stick to the balance it is better to weigh by difference. o Place the powder in a light-weight container or on a piece of paper
o Tare the balance
o Place the container / piece of paper containing the sample on the balance and record the reading. o Transfer the powder to the volumetric glassware you are using.
o Place the empty container / piece of paper with residue on the balance and record the reading. o Subtract the two readings to obtain the mass of powder transferred.
6.2. Measuring Volume:
Volumetric glassware needs to clean, dry and at room temperature. Dirt will allow a film of liquid to
remain stuck to the glassware when transferring. Warm liquids expand and cold liquids contract. Volumetric glassware measures liquids at room temperature (25 °C) accurately.
When measuring volume using a measuring cylinder / burette / pipette / volumetric flask ensure that
you always read the volume at the bottom of the meniscus and remember to include the correct units. Make sure your eyes are level with the level of liquid to avoid the error of parallax.
Do not blow out the last drop of liquid in a pipette, gently touch the pipette to the surface of the liquid,
some of the liquid will be drawn out. The pipette is calibrated to compensate for the small volume that remains in the pipette after this.
1cm3 = 1 ml 1 dm3 = 1 L 1 dm3 = 1000 cm3
6.3 Measuring Temperature:
The thermometer must be place in the centre of the solution
Always stir the solution gently using the thermometer, before taking the reading.
Waite until the temperature stabilises before taking the reading.
Take the reading by holding the meniscus at eye level
Remember to include the units.
7. Lighting the Bunsen burner:
Important points to remember:
Position the Bunsen burner in the middle of the desk.
Ensure that all flammable substances are a good distance from the gas burner.
Light the match before turning the gas on. Strike the match away from yourself.
Adjust the air flute to get a blue flame.
When you have finished using the burner close the gas tightly.
8. What to bring to a practical / practical exam:
Pen, pencil, calculator, long ruler, sharpener, eraser, scissors You may NOT share apparatus during a practical.Ensure that you know how to use all the apparatus correctly and know the name of each piece of apparatus.
9. Essay Writing Skills
An essay gives an opportunity to communicate effectively as a real Biologist. Although factual content is important it is the way the facts are presented that counts the most. I.e. The theme must be developed effectively.
Essays check the following skills:
Comprehension and analysis
Selection of material
Synthesis of theme.
Communication.
Most marks are given for skills and not for content.
Characteristics of a good Biology essay:
It must be impersonal, with no emotions, use passive speech, i.e. “Research was done, “ rather than “ I did research.”
It must be factual with no waffle
Facts should follow a logical progression, therefore planning before hand is important.
Facts must be stated concisely. (Make sure all facts relate directly to the topic at hand.)
The theme of the essay must not be lost in descriptive details.
Format of a Good Biology essay:
Introduction: Summarise your topic in your own words and define the area that you are going to cover. DO NOT agree or disagree with a statement in your introduction.
Body: Contains the content of your essay in a logical sequence. It should be divided up into paragraphs.
Conclusion: This is a closing paragraph which rounds off the essay. It should only be a few sentences. It can be linked to the title or introduction.
Approach to essay writing:
Read the question carefully and highlight main ideas.
Underline the instruction words.
Select the relevant facts that relate to the main ideas: o Spend time brainstorming and planning your essay. o Organise your ideas into a logical sequence.
o Remember you can only write a skillful essay if it is well planned.
o Do not just give back theory, all facts must be applied to the main focus points of the essay
Write your essay.
Remember to develop the theme of the essay through out every paragraph.
Main Instruction Words:
Explain: present your work in a way that a person who knew nothing about the topic would learn from your essay.
Indicate: Prove a point with factual evidence.
Compare: point out similarities and differences.
Contrast: point out differences
Distinguish: point out characteristics which show a difference between things.
Define: supply an accurate meaning.
Describe: create a word picture which gives a clear and logical account of the topic.
Outline: give main ideas and facts to support each idea.
Discuss: Consider the topic from different points of view and supply evidence to support each view.
How will the essay be marked?
Essays in matric will be marked out of 60 marks.
There are 3 areas that the marker will assess.
Extended writing Piece for tests and exams – Life Sciences (Question 5) 6 sections :
1. Content: thoroughness (4) – how much of the content provided in the source material is used. eg. 10 instances covered and 2 extra for 4 marks. Use short paragraphs – one point made in each.
2. Content: Relevance (4) – content supports the question (has not missed the point, has no repetition or digression).
3. Supporting argument – i.e. for (4) – interpretation of the sources, could use for either argument.
4. Fairness i.e. argument against (3) - is often missing – a knowledge of the opposing point of view. Can be 1 strong point made or eg. 3 counter opinions given for 3 marks.
5. Position (1) - clear decision has been made or not.
6. Presentation (4) - use of tone, language (must be scientific), terminology, good paragraphing, quality of introduction and conclusion, answer is not just a sweeping generalisation.
How to complete the extended writing piece
1. Preferably, write the essay first, use careful planning (eg spider diagram), use half an hour to write the essay. OR…..
2. Read the stimulus material during reading time and draw up a mind map immediately when you are allowed to start writing. Once the mind map is basically done, put it aside and continue with the rest of the paper. During the course of the paper you may have ideas to refine the mind map. When you have finished the rest of the paper, the mind map should be as good as it can get it, and you should then simply put it into an essay form.
3. Introduction - state your opinion based on the sources.
4. Body of essay - other side’s opinion (give first)
Arguments can have religious reasons or reasons based on own experiences, especially when talking about ethics, or if it is found in the stimulus material. However, students must not get hooked on the religious point and spend the entire essay hammering away at it. Similarly, they should not be derogatory when dealing with a religious perspective. Students should not be fearful of this area, but should also not go overboard. Argument should remain logical.
the main part of the essay (about ½ the essay) is to support for own opinion
5. Conclusion - restate opinion (but word differently)
General comments:
Can reference a source (do not have to):
‘fact stated in paragraph……… (Source A)’ – makes it easier for marker to identify use of sources sufficiently.
Use a double page - thus marker does not have to constantly turn the page all the time.
Do not repeat the question exactly as stated in paper – use your own words.
Do not insinuate or ask rhetorical questions – the reader must make own assessment.
Do not use pronouns – eg. it, his, mine, our, their etc…
Stick to the point – do not waffle.
State own opinion unambiguously.
Link to source – short paragraphs – discussing one point each.
Link to topic at end of each paragraph – or reference source as stated above.
10.Summary Skills
Summaries are used to reduce the amount of information to be learned and increase the understanding of the information studied.
When summarizing the information needs to be broken down into separate groups and sub-groups.
Procedure:
Read through the information to be summarised.
Underline the main ideas of each paragraph.
Illustrate the main ideas in small simple sketches or flow diagrams, this helps you understand the information better.
Paraphrase the main ideas. (I.e. write them in your own words).
Look for ways in which to group the information.
Give each of the paragraphs a heading.
List the information in order of importance.
Fill in the small details onto your list.
Remember:
You need to make sure you understand the work before you summarise it.
Your summaries must be in your own words!
Do not rewrite the text book.
You may use a mind map or metacog to summarise your work.
Exercise: