Doctor of Psychology (PsyD) Theses and Dissertations
5-1-2016
Embedded Performance Measures Within the
Delis-Kaplan Executive Function System
Daniel Olsen
This research is a product of the Doctor of Psychology (PsyD) program at George Fox University.Find out moreabout the program.
This Dissertation is brought to you for free and open access by the Theses and Dissertations at Digital Commons @ George Fox University. It has been accepted for inclusion in Doctor of Psychology (PsyD) by an authorized administrator of Digital Commons @ George Fox University. For more information, please [email protected].
Recommended Citation
Olsen, Daniel, "Embedded Performance Measures Within the Delis-Kaplan Executive Function System" (2016).Doctor of Psychology (PsyD). 211.
Embedded Performance Measures Within the Delis-Kaplan Executive Function System
by Daniel Olsen
Presented to the Faculty of the
Graduate Department of Clinical Psychology George Fox University
In partial fulfillment
of the requirements for the degree of Doctor of Psychology
In Clinical Psychology
Embedded Performance Measures Within the Delis-Kaplan Executive Function System
Daniel Olsen
Graduate Department of Clinical Psychology at George Fox University
Newberg, Oregon
Abstract
It has become increasingly clear many patients do not manifest sufficient effort over the course of a neuropsychological evaluation (Horner, VanKirk, Dismuke, Turner, & Muzzy, 2014). While tests of memory and learning are considered to be the gold-standard in effort
measurement, they are vulnerable to coaching (Bianchini, Greve, & Love, 2003). Fortunately, interest in assessing effort through other cognitive domains has grown over the last few years. In the current study, participants were divided into two groups, simulators and controls. All
to use the Trail Making Test Validity Index (TMTVI) to delineate low effort groups from clinical populations and controls.
Table of Contents
Approval Page ... ii
Abstract ... iii
List of Tables ... vii
Chapter 1: Introduction ...1
Examinee Performance Validity ...1
Methods of Evaluation ...4
Trail Making Test ...5
Wisconsin Card Sort ...7
Verbal and Visual Fluency ...7
Delis-Kaplan Executive Function System ...8
Chapter 2: Method ...10
Participants ...10
Materials ...10
Demographic Questionnaire ...10
Informed Consent...11
TBI Facts Sheet ...11
TBI Case Vignette...11
Simulator Instructions ...11
Standard Reading Material ...11
Participant Post Assessment Survey ...12
Delis-Kaplan Executive Function System (D-KEFS)...12
Trail Making Test ...12
Visual Fluency ...13
Sorting ...14
Medical Symptom Validity Test (MSVT) ...14
Procedure ...15
Chapter 3: Results ...18
Chapter 4: Discussion ...28
Limitations ...31
Areas for Future Research ...32
Conclusion ...33
References ...34
Appendix A Demographics Survey ...42
Appendix B Informed Consent ...44
Appendix C Informed Consent ...46
Appendix D Traumatic Brain Injury Fact Sheet ...48
Appendix E Traumatic Brain Injury Vignette ...52
Appendix F Simulator Instructions ...54
Appendix G Post Questionnaire – Coached...56
Appendix H Participant Post Questionnaire ...57
Appendix I Administrator Post Assessment Survey ...58
List of Tables
Table 1 Demographic Data Summarized by Group ...10
Table 2 Descriptive Statistics for Standard Scores of Simulators and Controls ...21
Table 3 Analysis of Variance for Trail Making Test Simulators and Controls Standard Scores ..23
Table 4 Receiver Operating Characteristics for Significant TMT Variables ...24
Table 5 Coordinates of the ROC Curve ...25
Table 6 MSVT Scaled Scores by Group ...26
Table 7 Analysis of Variance Results MSVT ...26
Chapter 1
Introduction
Examinee Performance Validity
Until recently, neuropsychological assessment interpretation has been based on the presupposition the examinee invests his or her full effort throughout the length of the assessment battery and respond in an unbiased fashion (Kirkwood, 2012; Kirkwood, Kirk, Blaha, & Wilson, 2010). However, it has become increasingly clear many patients do not manifest sufficient effort over the course of a neuropsychological evaluation (Horner, VanKirk, Dismuke, Turner, & Muzzy, 2014). Carone, Iverson, and Bush (2010) and Iverson (2006) hypothesized multiple explanations as to why a patient may not demonstrate sufficient effort. They suggested the attitude of the patient may be apathetic toward the process and the results, and the participant may be afraid of what the assessment may reveal. Additionally, they hypothesized the participant may be suspicious of the process, or intentionally attempting to appear impaired. As a result of this awareness, a growing body of literature has begun to examine the deleterious impact variable effort has on the results of an assessment (Green & Flaro, 2003). Review of this literature confirms when an examinee’s effort is compromised either intentionally or
2010). Horner et al. (2014) followed patients for one year after they participated in a neuropsychological evaluation including stand-alone effort measures. After controlling for demographic, medical, and psychiatric variables, they found the participants who demonstrated inadequate effort had more visits to the emergency department, more inpatient hospitalizations, and longer stays at inpatient facilities.
The vast and expensive impact of invalid results is concerning considering the base rates for individuals demonstrating inadequate effort, compiled from multiple studies where
individuals were believed to be putting forth adequate effort (Chafetz, Abrahams, & Kohlmaier, 2007; Greve, Etherton, Ord, Bianchini, & Curtis, 2009; Larrabee G., 2003; Mittenberg, Patton, Canyock, & Condit, 2002). The compiled base rate of assessed adults who demonstrate
inadequate effort ranges from less than 10% in general medical settings to 40% in mild traumatic brain injury (TBI) forensic settings, and even higher in other contexts where secondary gain is a consideration. Considering a sizeable number of neuropsychology referrals stem from systems where the patients may be awarded a substantial financial settlement if they demonstrate legitimate or feigned cognitive impairment, this issue becomes all the more important (Slick, Sherman, & Iverson, 1999). Additionally, the importance of objective effort assessment has become increasingly well documented, as it has been discovered a clinician’s subjective
In the last 20 years, there has been a nearly 20% increase in the proportion of articles published in The Clinical Neuropsychologist and Archives of Clinical Neuropsychology on the topics of validity testing, effort, and malingering (Martin, P., Schroeder, R., & Odland, A., 2015). As a result of the increased awareness surrounding the impact of effort on assessment, there has been mounting interest in the development of measures that can detect variable effort or
fabricated cognitive impairment (Millis et al., 1995). Over the past two decades, the focus on identifying non-credible effort has contributed to a proliferation of well-validated measures for the assessment of effort among the adult population (Boone, 2007; Larrabee, 2007). These instruments are typically referred to as PVTs or Symptom Validity Tests (SVTs). The concerns over PVTs highlighted in the current literature have led examiners to include effort indices as a routine part of adult assessment (Green & Flaro, 2003). Sharland and Gfeller (2007) received surveys from 188 members and fellows of the National Academy of Neuropsychology, and found 84.2% of respondents stated they sometimes, often, or always include a measure of effort. Additional results from this survey suggested approximately 11.1% of respondents rarely
administer an effort measure and 4.8% of respondents never administer a measure of effort during a neuropsychological evaluation.
Concerns over invalid assessment results have not gone unnoticed. Many professional agencies including the National Academy of Neuropsychology and the American Academy of Clinical Neuropsychology released position statements suggesting a participant’s effort must be taken into consideration with the administration of a neuropsychological battery (Bush et al., 2005; Heilbronner, Sweet, Morgan, Larrabee, & Mills, 2009).
PVTs have traditionally been grouped into two categories: stand-alone measures and embedded measures. Stand-alone measures include instruments such as the Test of Memory Malingering (TOMM; Tombaugh, 1996), Green’s Word Memory Test (WMT; Green, 2005), and the Medical Symptom Validity Test (MSVT; Green, 2004). While stand-alone measures
typically report the strongest sensitivity and specificity, using only stand-alone effort measures throughout the battery bring along with them the associated problems of the increased time it takes to administer additional instruments and the added cost. However, these concerns can be ameliorated through the use of embedded measures of effort. Embedded measures are indices of effort derived from preexisting tests (Larrabee, 2012). Embedded measures increase the
efficiency of the assessment by providing an index of effort without adding to the length or cost of the evaluation. They also provide indices of effort over the course of the evaluation, thus serving to cross-validate other findings (Arnett, Hammeke, & Schwartz, 1995; Meyers & Volbrecht, 2003; Sherman, Boone, Lu, & Razani, 2002). Additionally, having an understanding of typical malingering profiles on common neuropsychological tests is important, as a
neuropsychologist may not always have access to stand-alone PVT data, such as when reviewing the work of a colleague (Suhr & Barrash, 2007). Unfortunately, the use of individual
performance measures largely persists despite the call from many researchers to begin incorporating multiple measures of effort into every standard battery (Greve, Binder, & Bianchini, 2009; Larrabee, 2008; Nelson et al., 2003).
purpose (Bianchini, Greve, & Love, 2003. Essig, Mittenberg, Peterson, Stranman, and Cooper (2001) conducted a survey of 473 attorneys and found approximately 65% of them spend between 15 minutes and 2 hours with their clients preparing them for a neuropsychological evaluation and approximately 19% explicitly discussed malingering detection. This requires neuropsychologists to have advanced measures available to assess effort, ones that may not be as obvious or easy to fool as others. Fortunately, interest in assessing effort through other cognitive domains has grown over the last years. A review of the literature suggests the scope of research has broadened to include tasks of attention (Henry, 2005; Ord, Boettcher, Greve, & Bianchini, 2010), verbal and visual fluency tasks (Demakis, 1999; van Gorp et al., 1999; Vickery et al., 2004), planning and organization tasks (Bernard, McGrath, & Houston, 1996), inhibition tasks (Lu, Boone, Jimenez, & Razani, 2004; van Gorp et al., 1999), visual spatial tasks (Whiteside, Wald, & Busse, 2011), and psychomotor speed tasks (Suhr & Barrash, 2007) as additional useful embedded measures of effort.
Trail Making Test
Researchers began by comparing scores from patients suspected of malingering to those from patients believed to be putting forth good effort (Powell, Locke, Smigielski, & McCrea, 2011). This research yielded strong evidence that patients believed to be putting forth good effort consistently completed the TMT A and B in faster times than those patients who were believed to be malingering (Goebel, 1983; Iverson, Lange, Green, & Franzen, 2002; O'Bryant, Hilsabeck, Fisher, & McCaffrey, 2003; Ruffolo, Guilmette, & Willis, 2000; Trueblood & Schmidt, 1993). Iverson and colleagues (2002) found when using a cutoff score of > 64 seconds on TMT A 15% of malingerers could be identified with > 90% specificity. Additionally, using a cutoff score of > 201 seconds on TMT B, 12% of malingerers could be identified with > 90% specificity.
Additional research has investigated the relationship between malingering and error rates and TMT A/B ratio scores; however, these studies have produced mixed results (Goebel, 1983; Iverson et al., 2002; O'Bryant et al., 2003; Ruffolo et al., 2000). When compared to patients with genuine brain damage, Goebel’s (1983) study was the first to find a relationship between lower TMT ratio scores and participants directed to manifest low effort. Corroborating results were produced by Ruffolo et al., (2000) and O’Bryant et al., (2003) also found differences using a sample of real-life litigants. However, two similar studies failed to produce similar results (Iverson et al., 2002; Martin, Hoffman, & Donders, 2003), making it unclear whether the TMT ratio is a reliable effort measure. Additionally, O’Bryant et al. (2003) concluded TMT error scores did not reliably differentiate individuals with low effort from those demonstrating good effort.
The Wisconsin Card Sorting Test (WCST; Bernard et al., 1996) is another measure previously investigated for use as an index of effort. However, the literature on this measure is sparse. Bernard et al. (1996) attempted to use the WCST to differentiate simulating malingerers from controls, a group of head-injured patients, and a group of patients with mixed etiologies. They hypothesized malingerers would complete fewer categories and would have higher
perseverative responses/errors. Results showed the number of categories completed was the only reliable indicator of low effort with 100% sensitivity and 92% specificity.
Verbal and Visual Fluency
Delis-Kaplan Executive Function System
Many of the aforementioned tests appear in similar form in the Delis-Kaplan Executive Function System, or the KEFS (Delis, Kaplan, & Kramer, 2001). However, within the D-KEFS, some of these measures have been expanded or changed to control for process variables that may contaminate results when trying to look for effort. For example, the Trails subtest on the D-KEFS is now divided into five components, accounting for such processes as visual scanning, motor speed, and set switching. Additionally, the verbal fluency subtest allows for greater accuracy in testing because the respondents’ answers are tracked in quadrants of time. This allows for the administrator to assess whether the participant responded in a similar pattern to peers.
To date, literature review revealed a lack of research using the D-KEFS to assess effort. It seemed like the next logical step to use subtests from the D-KEFS in an attempt to distinguish the performance of simulated malingerers from participants instructed to put forth good effort. For the current study the focus is on evaluating current subtests within the D-KEFS battery as viable embedded measures that allow a measure of effort along the continuum of the battery. D-KEFS provides several subtests similar to tests that are established as at least possible embedded measures.
This study sought to discover response bias on the D-KEFS among two major groups: a group of coached university student simulators and a group of non-coached/non-clinical
conditions, the three Verbal Fluency Test (VFT) conditions, and the two primary-measure Sorting Test (ST) conditions.
Chapter 2
Method
Participants
The sample for this study was recruited from George Fox University and consisted of 49 adults. Participants were randomly divided into two groups, simulators and controls.
Demographic data for the sample is summarized in Table 1.
Materials
Demographic Questionnaire. Each participant was asked to complete a questionnaire providing demographic information relevant to this study. The questionnaire screened for various medical and psychiatric disorders (See Appendix A for a copy of the questionnaire).
Informed Consent. Participants in each group received informed consent. Participants in the standard effort group were told they will receive a $10 gift card for putting forth full effort. Table 1
Demographic Data Summarized by Group
Age Education Gender Ethnicity
Group n Mean SD Mean SD M F EH A/PI MR ME F H
Controls 23 22.45 4.97 15.90 1.7
0 11 12 17 2 1 0 1 2
Simulators 26 20.75 3.31 14.50 1.7
9 7 19 19 2 3 1 0 1
Note. Age reported in years. M = Male. F = Female. EH = European heritage. A/PI = Asian/ Pacific Islander.
Participants in the coached effort group were told they will receive a $10 gift card for adequately faking cognitive impairment (See Appendices B and C for Informed Consent).
TBI Facts Sheet. Each participant in the coached group received a TBI Fact Sheet prior to administration. This sheet was composed of information about traumatic brain injury such as definition, classification, and effects of traumatic brain injury (See Appendix D).
TBI Case Vignette. In addition to the TBI Facts Sheet, participants in the simulator group received a case vignette detailing the experience of an individual who incurred a traumatic brain injury (See Appendix E for vignette).
Simulator Instructions. Simulators were given a set of instructions asking them to use the fact sheet and vignette to guide how they responded to the tests. Instructions asked the simulators to pretend they experienced a TBI as a result of a skiing accident. They were instructed to answer the items as they believe a person struggling from the effects of a brain injury would respond using the information provided to them as a guide. They were encouraged to respond in what they believe would be the best effort for a person with the TBI. (See
Appendix F for instructions).
Standard Reading Material. Participants in the standard effort group were given unrelated reading material to balance time compared to simulators. Reading material was composed of motivational content encouraging everyone to do their best at whatever they do (See Appendix G).
profile consistent with traumatic brain injury. Each post assessment survey also contained a question asking the administrator to estimate the level of effort they believed the participant put forth (Copies of these documents can be found in Appendices H and I).
Administrator Post Assessment Survey. Administrators completed a survey assessing their perception of the level of effort demonstrated by the participant (See Appendix I).
Delis-Kaplan Executive Function System (D-KEFS). The D-KEFS is a battery of tests that provide a comprehensive review of adult and pediatric higher-order thinking, also called executive functioning. The D-KEFS boasts a standardized sample of over 1,700 nationally demographically matched adults and children from ages 8 to 89 years old (Delis, Kaplan, & Kramer, 2001). The D-KEFS battery constructs of nine subtests, each assessing different
components of executive functioning. During the development of this battery Delis et al., (2001) utilized a process approach to provide information on the individual cognitive processes that are part of the larger executive functioning constructs being measured. The test may be administered in its entirety as a battery, or the administrator may select specific subtests according to the referral question and logistical constraints of the assessment case.
TMT report reliability coefficients of .36 to .73. Age appropriate validity data, as reported in the Technical Manual, include intercorrelations ranging from -0.62 to 0.83. No TBI specific
reliability/validity were available in the manual for this subtest.
The VFT is composed of three conditions including a letter fluency task, a category fluency task, and a category-switching task. For the first two conditions the examinee is asked to generate a list of words beginning with a specific letter or belonging to a specific semantic category under timed conditions. On the third condition the examinee is asked to produce a list of words under timed conditions but is asked to alternate between two semantic categories. Asking examinees to alternate between categories tests their ability to fluidly switch between two concepts. Age appropriate test-retest data for the VFT report reliability coefficients of .24 to .81. Age appropriate validity data as reported in the Technical Manual include
intercorrelations ranging from -0.95 to 0.79. No TBI specific reliability/validity were available in the manual for this subtest.
The ST is composed of two conditions including a free sort condition and a sort
recognition condition. During the free sort condition, the examinee is asked to sort six cards into two groups of three sharing a similar characteristic. The sorting process is repeated, giving the examinee the opportunity to demonstrate multiple sorting rules. During the sort recognition task, the examiner sorts the cards into two sets of three and asks the examinee to explain the
Technical Manual include intercorrelations ranging from -0.77 to 0.96. No TBI specific reliability/validity were available in the manual for this subtest.
Medical Symptom Validity Test (MSVT). The MSVT is a psychometrically sound instrument designed to evaluate effort and memory in both adults and children Green, (2004). Meta-analysis conducted by Sollman & Berry (2011) report Sensitivity = 70.0% (95% CI: 13.1 – 1.00), Specificity 91.3 (95% CI: 64.1 – 1.00), and hit rate 80.7 (95% CI: 52.1 – 1.00). The MSVT takes approximately 5 minutes to complete, not including the 10-minute delay between subtests. This makes the MSVT significantly faster to administer while retaining similar sensitivity, and boasting higher specificity than the Word Memory Test (Green, 2004). The MSVT is a forced-choice computerized assessment. It consists of two effort subtests and two memory subtests including Immediate Memory Recognition, Delayed Recognition, Paired Associates, and Free Recall. These subtests produce the primary effort indices including the Immediate Recognition (IR), Delayed Recognition (DR), and the Consistency (CNS).
During administration, 10 semantically related word pairs are displayed twice on a computer screen. The examinee is asked to differentiate the correct word from a distractor on both the Immediate Recognition and Delayed Recognition subtests. During these subtests, the examinee receives auditory stimuli providing corrective feedback on each of their responses. During the Paired Associate and Free Recall subtests, the participant is asked to spontaneously recall all of the words they can remember. Participants in this study were administered the MSVT in a standardized fashion.
Approval for this study was obtained from the Institutional Review Board (IRB) of George Fox University.
This study utilized a two group, blind administrator design, employing educated simulators to feign cognitive impairment. Participants were recruited from an undergraduate, primarily traditional, student body through courses such as general psychology and research design. Students were invited to participate by the principle investigator at the beginning of their classes. Literature by DeRight and Jorgensen (2015) suggests undergraduate volunteers
motivated only by research credit do not always put forth their full effort during participation. In an attempt to mitigate this potential area of limitation, deception was utilized. Participants were led to believe they would receive a gift card only if they were able to successfully put forth their full effort or “trick” the test into thinking they were impaired but not simulating.
Interested individuals signed up to receive additional information on the study. These individuals were contacted by the PI and an appointment for the assessment was arranged. An a priori random assignment protocol was developed so as participants signed up they were
randomly placed into coached and non-coached groups and randomly assigned to an administrator.
Participants arrived at a quiet testing location, at the graduate department of clinical psychology academic complex. Administrations were conducted on weekend days when the academic building was quiet and free from distraction. This location provided a discrete environment for all participants and was properly furnished to carry out the administrations.
The PI presented all participants with the informed consent document and allowed time for the participant to read it (See Appendices B and C). At this time, the PI fielded any questions asked by the participant. During the informed consent process, participants were notified of the chance to receive a gift card as remuneration for their participation. Individuals in the simulator group were told they would receive the gift card if they were successfully able to demonstrate cognitive impairment without appearing to put forth insufficient effort. Individuals in the control group were told they would receive the gift card if the results from the assessment demonstrated they put forth their best effort.
After completing the informed consent process, students were given time and asked to provide demographic information by completing the demographic questionnaire. At the top of the demographic questionnaire, students were asked to create their own five-digit numerical code to replace their name in order to protect their identity. This code replaced the participant’s name on each protocol. A master list containing the names and codes of each participant was kept by the principle investigator in a secured locked location.
participants in the control group were provided with innocuous reading material on the
importance of trying their best. Following this process, the PI asked the participant not to divulge the contents of the study to their peers and not to tell the administrator which group they are in. They were then led to the room where the administrator was waiting.
Administration was to be completed following standardized protocol as outlined in the D-KEFS examiner manual. All administrators gave the first condition of the MSVT then
administered the TMT conditions. This generally provided the appropriate delay before the second condition of the MSVT was administered. The VFT conditions were then administered and finally the ST conditions. The MSVT took approximately 5 minutes to complete, the TMT took approximately 10 minutes to complete, the VFT took approximately 10 minutes to complete, the ST took approximately 15 minutes to complete.
Following the administration of all MSVT and D-KEFS conditions, students were asked to fill out the post assessment survey. Participants were thanked for their participation and reminded not to disclose the specifics of the study. At this point they were also provided with the gift card. After the participant left, administrators completed their portion of the post assessment survey. Total time to train, administer tests, and complete associated paperwork was
approximately 60 minutes.
Chapter 3
Results
Participants in both the simulator (n = 26) and control groups (n = 23), rated their understanding of the instructions and recall of the instructions high during a post-assessment screening. Independent t-tests and Goodness of Fit Chi-Square analyses were computed to compare the two groups on demographic variables. Results indicated no statistically significant differences across age (t(47) = -1.42, p = 0.16), education (t(47) = -1.17, p = 0.25), gender (2 (1) = 2.94, p = 0.15) and ethnicity (2 (5) = 3.27, p = 0.66). Table 1 summarizes the demographic data for the two groups.
To control for possible confounding effects of head injury, eight participants (three controls, five simulators) reporting history of concussion and loss of consciousness were omitted from further analysis. The small number of participants in this group was not enough to act as a clinical sample. Furthermore, to divide these participants into simulator and control groups, there would have had to be more participants than the eight eliminated. Administrator error in
recording scores on the Sorting Test subtest precluded complete scoring. Trail Making Test (TMT) times were not recorded in three administrations and verbatim responses for the free-sorting portion of Sorting subtest were not always recorded. These errors account for the discrepancy in participant numbers across subtests.
the three subtests. Descriptive statistics for these variables can be found in Table 2. Significant multivariate effects were produced from the TMT scores (Pillai’s Trace= 0.62, F(7,30) = 6.95,
p < 0.01) indicating support to reject the null hypothesis that the two groups are the same. Insufficient evidence was found to reject the null hypotheses on Verbal Fluency subtest (Pillai’s
Trace= 0.31, F(10,25) = 1.13, p = 0.38) variables and Sorting subtest variables (Pillai’s Trace=
0.25, F(8,28) = 1.19, p = 0.34). Simulators performed significantly below controls on six out of the eleven TMT variables (Visual Scanning, Number Sequencing, Letter Sequencing, Number-Letter Sequencing, Motor Speed, and Combined Number + Number-Letter Sequencing). Group
differences for TMT variables are found in Table 3.
Receiver operating characteristic (ROC) statistics were conducted on the six significant variables from the TMT subtest to determine utility for predicting group assignment and sensitivity and specificity. All variables produced significant results (See Table 4). Sensitivity and Specificity cutoff scores of the single variables did not possess enough variability to be clinically useful. Therefore, a new index variable with greater variability between simulators and controls was required.
SE = 0.05, Asymptotic Significance <0.01, CI = 0.81 – 1.00), indicating excellent accuracy in classification. Using a cutoff score of -12, the TMTVI produced sensitivity of 71% and specificity of 100%. See Table 5 for analysis of the ROC curve.
Table 2
Descriptive Statistics for Standard Scores of Simulators and Controls
Simulators Controls D-KEFS Scores n Mean SD n Mean SD
Trail Making Test
Visual Scanning 21 4.71 3.33 17 11.00 1.87 Number Sequencing 21 5.81 4.58 17 11.24 2.31 Letter Sequencing 21 5.62 4.17 17 11.47 1.81 Number-Letter Sequencing 21 4.86 4.07 17 10.71 1.49 Motor Speed 21 6.76 4.61 17 12.06 0.75 Combined Number+Letter Sequencing 21 5.81 4.49 17 11.94 2.08 Switching vs. Visual Scanning 21 10.24 1.84 17 9.76 1.25 Switching vs. Number Sequencing 21 9.05 1.91 17 9.47 2.07 Switching vs. Letter Sequencing 21 9.24 2.34 17 9.24 1.75 Switching vs. Combined Number +
Letter Sequencing 21 9.05 1.80 17 8.76 1.72 Switching vs. Motor Speed 21 8.10 3.95 17 8.65 1.12 Verbal Fluency Test
Letter Fluency Total Correct 21 9.10 2.76 19 10.74 3.14 Category Fluency Total Correct 21 9.19 4.12 19 11.84 3.34 Category Switching Total Correct 20 8.85 3.13 19 10.79 3.33 Category Switching: Total Switching 21 10.14 2.85 19 11.47 2.55 Letter Fluency vs. Category Fluency 21 9.90 2.68 19 9.05 3.69 Sorting Test
Category Switching vs. Category
Fluency 21 9.76 2.61 19 8.95 3.46 First Interval: Total Correct 21 8.81 3.60 19 12.26 3.19 Second Interval: Total Correct 21 9.29 2.61 19 10.53 3.20 Third Interval: Total Correct 21 9.19 2.93 19 10.63 2.59 Fourth Interval: Total Correct 20 9.10 3.40 19 10.16 2.09 Category Switching: Percent
Table 2 cont.
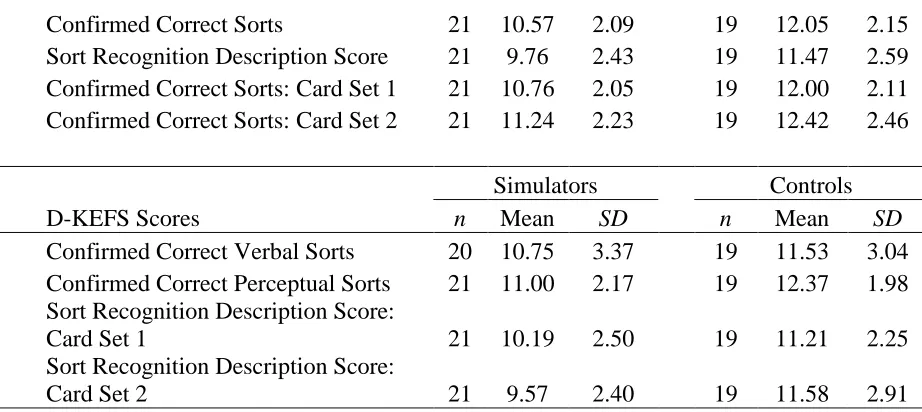
Confirmed Correct Sorts 21 10.57 2.09 19 12.05 2.15 Sort Recognition Description Score 21 9.76 2.43 19 11.47 2.59 Confirmed Correct Sorts: Card Set 1 21 10.76 2.05 19 12.00 2.11 Confirmed Correct Sorts: Card Set 2 21 11.24 2.23 19 12.42 2.46
Simulators Controls D-KEFS Scores n Mean SD n Mean SD
Confirmed Correct Verbal Sorts 20 10.75 3.37 19 11.53 3.04 Confirmed Correct Perceptual Sorts 21 11.00 2.17 19 12.37 1.98 Sort Recognition Description Score:
Card Set 1 21 10.19 2.50 19 11.21 2.25 Sort Recognition Description Score:
Card Set 2 21 9.57 2.40 19 11.58 2.91
Table 3
Analysis of Variance for Trail Making Test Simulators and Controls Standard Scores
MANOVA D-KEFS Scores F df p 2
Visual Scanning 48.02 1, 36 <.01 0.13 Number Sequencing 19.74 1, 36 <.01 0.08 Letter Sequencing 29.01 1, 36 <.01 0.10 Number-Letter Sequencing 31.60 1, 36 <.01 0.11 Motor Speed 21.83 1, 36 <.01 0.07 Combined Number+Letter Sequencing 26.93 1, 36 <.01 0.10 Switching vs. Visual Scanning 0.83 1, 36 0.37 0.00 Switching vs. Number Sequencing 0.43 1, 36 0.52 0.00 Switching vs. Letter Sequencing 0.00 1, 36 1.00 0.00 Switching vs. Combined Number + Letter
Table 4
Receiver Operating Characteristics for Significant TMT Variables
Results of
Receiver Operating Characteristic (ROC) Significant DKEFS Variables Area SE AS 95 % CI Visual Scanning 0.95 0.03 < .01 0.89 - 1.00 Number Sequencing 0.85 0.07 < .01 0.72 - 0.98 Letter Sequencing 0.90 0.05 < .01 0.80 - 1.00 Number-Letter Sequencing 0.90 0.05 <.01 0.79 - 1.00 Motor Speed 0.86 0.07 < .01 0.73 - 0.99 Combined Number+Letter Sequencing 0.89 0.06 < .01 0.77 - 1.00
Table 5
Coordinates of the ROC Curve
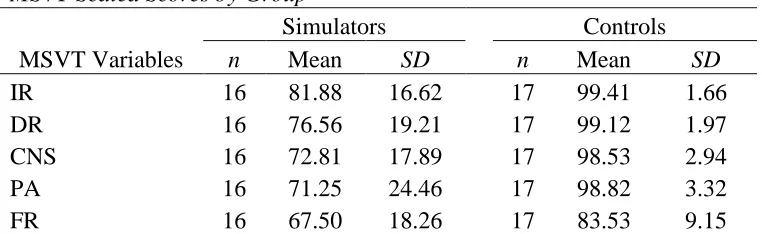
Table 6
MSVT Scaled Scores by Group
Simulators Controls MSVT Variables n Mean SD n Mean SD
IR 16 81.88 16.62 17 99.41 1.66 DR 16 76.56 19.21 17 99.12 1.97 CNS 16 72.81 17.89 17 98.53 2.94 PA 16 71.25 24.46 17 98.82 3.32 FR 16 67.50 18.26 17 83.53 9.15
Table 7
Analysis of Variance Results MSVT
MANOVA
MSVT F df p 2
IR 18.76 1, 31 <.01 0.01 DR 23.22 1, 31 <.01 0.02 CNS 34.23 1, 31 <.01 0.02 PA 21.23 1, 31 <.01 0.02 FR 10.36 1, 31 <.01 0.01
Table 8
Correlation Matrix for MSVT and TMT Index Variable
Indicator IR DR CNS PA FR
TMTV Index Variable IR 1.00 0.87** 0.89** 0.87** 0.78** 0.73** DR ---- 1.00 0.89** 0.86** 0.69** 0.73** CNS ---- ---- 1.00 0.85** 0.79** 0.76** PA ---- ---- ---- 1.00 0.74** 0.62** FR ---- ---- ---- ---- 1.00 0.45** Index
Variable ---- ---- ---- ---- ---- 1.00
Note. IR = Immediate Recall. DR = Delayed Recall. CNS = Consistency. PA =Paired Associates.
FR = Free Recall
Chapter 4
Discussion
Comprehensive neuropsychological evaluations, however informative, are also costly. As of the most recent survey, neuropsychologists reported reimbursement rates between 65.09% and 95.61% (Kanauss, Schatz, & Puente, 2005). Not only are the evaluations costly to the
neuropsychologist in terms of materials and professional time, they are also costly and taxing to the patient. Lengthy evaluations can be intellectually and emotionally fatiguing to the patient, a byproduct of which may include less-than optimal performance. Efficient, yet valid and reliable evaluations are only becoming more important in today’s healthcare system.
Embedded PVTs are one way of cross validating results with stand-alone effort measures without adding to the time required for costly battery administration (Arnett et al., 1995; Meyers & Volbrecht, 2003; Sherman et al., 2002). This study was designed to investigate potential embedded indices of performance validity within three subtests of the D-KEFS. Boone (2007) recommends the development of PVTs should begin with simulator studies, designs allowing for baseline sensitivity and specificity to be determined. If significance is found in these studies, it paves the way for further investigation. Additionally, it is recommended these studies employ multiple effort tests so relative sensitivity can be calculated. By employing a two group design and using a well-founded, stand-alone, PVT, this study accomplished both of these goals.
in this study is above the 80.7% reported in the meta-analysis conducted by Sollman & Berry, (2011), and well within the 95% confidence interval of 52% - 100%. In this study we expected to observe a high hit rate, given participants were drawn from a high-functioning university
population, were screened out for cognitive impairment, and were motivated to either put forth complete effort or simulate cognitive impairment.
Anecdotal report by simulators who were successful in passing one or more of the MSVT components indicated they focused on somatic symptoms during the assessment. They reported higher rates of rubbing their heads and eyes and reporting headaches and fatigue rather than focusing solely on cognitive deficits. The training materials provided to the simulators were constructed from resources available to the general public. Real world individuals attempting to simulate cognitive impairment could easily access this information and construct a feigning strategy similar to the ones created by participants of this study, including the behavioral
components. The issue of monitoring behavioral observations for performance validity has been addressed in the literature before, however, this remains an area primed for additional
investigation (Vanderploeg & Curtiss, 2001).
routinely overestimate the level of cognitive impairment seen in clinical populations (Green et al., 2001).
Results confirmed the expectation that simulators would perform significantly below controls on the five TMT conditions. However, when entered into ROC analysis, individual condition standard scores demonstrated limited variability. We believed lack of task variability made it difficult for to delineate between simulators and a clinical sample in future research. It was believed by aggregating the participant’s performance below the mean, we would identify individuals demonstrating global cognitive impairment, as is often seen in simulator performance (Green et al., 2001). Refinement of group differences on five TMT condition variables led to the discovery of the TMTVI. Considering the study’s relatively small sample size, the excellent AUC characteristic and statistical significance of this measure is encouraging. The TMTVI cutoff score of -12 produced sensitivity of 71% and specificity of 100%. In this investigation, minimizing the number of controls incorrectly identified as simulators was a priority, thereby sacrificing sensitivity. Others who are willing to increase type 2 error may prefer to increase the cutoff score. As can be observed from Table 5, there is a gap in AUC coordinates between -12.00 and -5.50. Additional investigation of this aggregate index would help to fill the gap between these coordinates and provide additional cutoff scores that can be evaluated for clinical utility.
ways to feign impairment may be missed by the TMTVI, thus utilization of multiple measures of effort during a neuropsychological assessment continues to be a high standard of practice.
Lack of statistical significance between simulators and controls on verbal fluency variables is inconsistent with Demakis (1999) and Vickery et al. (2004). However, these results are consistent with the findings of van Gorp et al. (1999) and the summary conclusions presented in Boone (2007). It is possible simulators were unaware even healthy individuals typically slow down over the course of the task and instead maintained an average pace of reporting words across the four, 15-second periods of time available in the fluency tasks. This would have led to similar raw scores and thereby similar standard scores amongst simulators and controls. While simulators may have attempted to appear impaired on this measure, results suggest their strategy was inadequate to prove convincing as a group.
Similarly, performance on Sorting test variables lacked clinical utility in discriminating simulators from controls. Inaccurate recording of responses by administrators led to invalid variables, precluding formal statistical analysis. While we would have expected to see variables suggestive of global impairment in simulator performance, we also would have expected to see significantly lower performance on tasks typically requiring less cognitive load, such as
recognition and the number of perceptual sorts during the free sorting condition.
Limitations
time that worked for the principal investigator, the administrator, and the participant. Having additional time to complete the research may have provided additional access to students in other courses, making the sample larger. Another characteristic of the sample that reduces the
generalizability of these results is the overall demographic homogeneity of the sample. As noted above, some literature suggests undergraduate students tend to demonstrate suboptimal effort when participating in research (DeRight & Jorgensen, 2015) and this must be acknowledged as a potential limitation. However, even with coaching and additional monetary incentive to follow directions, most of these high functioning individuals were unable to successfully avoid detection.
Another limitation to this study involves the loss of data that may have provided additional variables for analysis. The loss of ST variables significantly reduced the sensitivity and clinical utility of that subtest to detect simulators. Additionally, it raises the question of other potential areas of administrator error. Protocol review and procedural debriefing of standardized procedures with administrators indicated there did not appear to be any additional violations of standardized administration.
Areas for Future Research
Now that significant differences have been established between controls and simulators on the TMTVI, future research should continue investigating the index’s clinical utility.
There are also parts of this project that would benefit from replication. Additional investigation into the ST of the D-KEFS would evaluate this task’s utility to detect sub-optimal effort. It may also be useful to increase the sample size to fill out the ROC curve and broaden the sample demographics to increase the generalizability of the results.
Conclusion
References
Arnett, P., Hammeke, T., & Schwartz, L. (1995). Quantitative and qualitative performance on Rey's 15-Item Test in neurological patients and dissimulators. The Clinical
Neuropsychologist, 17-26.
Benton, A., Hamsher, K., & Sivan, A. (1994). Multilingual Aphasia Examination (3rd ed.). Iowa City, IA: AJA Associates.
Bernard, L., McGrath, M., & Houston, W. (1996). The differential effects of simulating
malingering, closed head injury, and other CNS pathology on the Wisconsin Card Sorting Test: Support for the "pattern of performance" hypothesis. Archives of Clinical
Neuropsychology, 11, 231-245.
Bianchini, K., Greve, K., & Love, J. (2003). Definite malingered neurocognitive dysfunction in moderate/severe traumatic brain injury. The Clinical Neuropsychologist, 17, 574-580. Boone, K. (Ed) (2007). Assessment of feigned cognitive impairment: A neuropsychological
perspective. New York, NY: Guilford Press.
Bush, S., Ruff, R., Troster, A., Barth, J., Koffler, S., Pliskin, N., … & Silver, C. (2005). Symptom validity assessment: Practice issues and medical necessity NAN Policy and Planning Committee. Archives of Clinical Neuropsychology, 419-426.
Carone, D., Iverson, G., & Bush, S. (2010). A model to approaching and providing feedback to patients regarding invalid test performance in clinical neuropsychological evaluations.
The Clinical Neuropsychologist, 24, 759-778.
Delis, D., Kaplan, E., & Kramer, J. (2001). Delis-Kaplan Executive Function System (D-KEFS). San Antonio, TX: PsychCorp.
Demakis, F. (1999). Serial malingering on verbal and nonverbal fluency and memory measures: An analogue ingestigation. Archives of Clinical Neuropsychology, 14, 401-410.
DeRight, J., & Jorgensen, R. (2015). I just want my research credit: frequency of suboptimal effort in a non-clinical healthy undergraduate sample. The Clinical Neuropsychologist, 101-117.
Egeland, J., & Langfjaeran, T. (2007). Differentiating malingering from genuine cognitive dysfunction using the Trail Making Test-ratio and Stroop interference scores. Applied Neuropsychology, 14, 113-119.
Essig, S., Mittenberg, W., Peterson, R., Stranman, S., & Cooper, J. (2001). Practices in forensic neuropsychology: Perspectives of neuropsychologists and trial attorney. Archives of Clinical Neuropsychology, 16, 271-291.
Faust, D., Hart, K., & Guilmette, T. (1988). Pediatric malingering: The capacity of children to fake believable deficits on neuropsychological testing. Journal of Consulting and Clinical Psychology, 578-582.
Faust, D., Hart, K., Guilmette, T., & Arkes, H. (1988). Neuropsychologists' capacity to detect adolescent malingerers. Professional Psychology: Research and Practice, 508-515. Goebel, R. (1983). Detection of faking on the Halstead-Reitan neuropsychological test battery.
Journal of Clinical Psychology, 39, 731-742.
Green, P. (2005). Manual for the Word Memory Test (Revised). Edmonton, Canada: Green's Publishing.
Green, P., & Flaro, L. (2003). Word Memory Test Performance in Children. Child Neuropsychology, 189-207.
Green, P., Rohling, M., Lees-Haley, P., & Allen , L. (2001). Effort has a greater effect on test scores than severe brain injury in compensation claimants. Brain Injury, 1045-1060. Greve, J., Binder, L., & Bianchini, K. (2009). Rates of below-chance performance in
forced-choice symptom validity tests. The Clinical Neuropsychologist , 534-544.
Greve, K., Etherton, J., Ord, J., Bianchini, K., & Curtis, K. (2009). Detecting malingered pain-related disability: Classification accuracy of the Test of Memory Malingering. The Clinical Neuropsychologist, 1250-1271.
Guilmette, T., Faust, D., Hart, K., & Arkes, H. (1990). A national survey of psychologists who offer neuropsychological services. Archives of Clinical Neuropsychology, 5, 373-392. Heilbronner, R., Sweet, J., Morgan, J., Larrabee, G., & Mills, S. (2009). American Academy of
Clinical Neuropsychology Consensus Conference Statement on the neuropsychological assessment of effort, response bias, and malingering. The Clinical Neuropsychologist, 1093-1129.
Henry, G. (2005). Probable malingering and performance on the test of variables of attention.
The Clinical Neuropsychologist, 19, 121-129.
Iverson, G. (2006). Ethical issues associated with the assessment of exaggeration, poor effort, and malingering. Applied Neuropsychology, 13, 77-90.
Iverson, G., Franzen, M., & Lovell, M. (1999). Normative comparisons for the Controlled Oral Word Association Test following acute traumatic brain injury. The Clinical
Neuropsychologist, 13, 437-441.
Iverson, G., Lange, R., Green, P., & Franzen, M. (2002). Detecting exaggeration and malingering with the Trail Making Test. The Clinical Neuropsychologist, 398-406. Kanauss, K., Schatz, P., & Puente, A. (2005). Current trends in the reimbursement of
professional neuropsychological services. Archives of Clinical Neuropsychology, 341-353.
Kirkwood, M. (2012). Overview of tests and techniques to detect negative response bias in children. In E. S. Sherman & B. L. Brooks (Eds.), Negative response bias: Overview of tests and techniques (pp. 136-161). New York, NY: Oxford University Press.
Kirkwood, M., Kirk, J., Blaha, R., & Wilson, P. (2010). Noncredible effort during pediatric neuropsychological exam: A case series and literature review. Child Neuropsychology, 604-618.
Lange, R., Iverson, G., Brooks, B., & Rennison, V. (2010). Influence of poor effort on self-reported symptoms and neurocognitive test performance following mild traumatic brain injury. Journal of Clinical and Experimental Neuropsychology, 961-972.
Larrabee, G. (2003). Detection of malingering using atypical performance patterns on standard neuropsychological tests. The Clinical Neuropsychologist, 410-425.
Larrabee, G. (2008). Aggregation across multiple indicators improves the detection of
malingering: Relationship to likelihood ratios. The Clinical Neurpsychologist, 666-679. Larrabee, G. (2012). Performance validity and symptom validity in neuropsychological
assessment. Journal of the International Neuropsychological Society, 625-630. Lezak, M., Howieson, D., & Loring, W. (2004). Neuropsychological assessment. New York,
NY: Oxford University Press.
Lu, P., Boone, K., Jimenez, N., & Razani, J. (2004). Failure to inhibit the reading response on the Stroop Test: A pathognomonic indicator of suspect effort. Journal of Clinical and Experimental Neuropsychology, 26, 180-189.
Martin, T., Hoffman, N., & Donders, J. (2003). Clinical utility of the Trail Making Test ratio score. Applied Neuropsychology, 10, 163-169.
Martin, P., Schroeder, R., & Odland, A. (2015). Neuropsychologists’ validity testing beliefs and practices: A survey of north american professionals. The Clinical Neuropsychologist, 29,
741-776.
Meyers, J., & Volbrecht, M. (2003). A validation of multiple malingering detection methods in a large clinical sample. Archives of Clinical Neuropsychology, 261-276.
Millis, S., Putnam, S., Adams, K., & Ricker, J. (1995). The California Verbal Learning Test in the detection of incomplete effort in neuropsychological evaluation. Psychological Assessment, 463-471.
Nelson, N., Boone, K., Dueck, A., Wagener, L., Lu, P., & Grills, C. (2003). Relationships between eight measures of suspect effort. The Clinical Neuropsychologist, 263-272. O'Bryant, S., Hilsabeck, R., Fisher, J., & McCaffrey, R. (2003). Utility of the Trail Making Test
in the assessment of malingering in a sample of mild traumatic brain injury litigants. The Clinical Neuropsychologist, 17, 69-74.
Oldershaw, L., & Bagby, R. (1997). Children and deception. In R. Rogers, Clinical assessment of malingering and deception (pp. 153-166). New York, NY: The Guilford Press. Ord, J., Boettcher, A., Greve, K., & Bianchini, K. (2010). Detection of malingering in mild
traumatic brain injury with the Conners’ Continuous Performance Test-II. Journal of Clinical and Experimental Neuropsychology, 32, 380-387.
Powell, M., Locke, D., Smigielski, J., & McCrea, M. (2011). Estimating the diagnostic value of the Trail Making Test for suboptimal effort in acquired brain injury rehabilitation patients. The Clinical Neuropsychologist, 25, 108-118.
Rabin, L., Barr, W., & Burton, L. (2005). Assessment practices of clinical neuropsychologists in the United States and Canada: A survey of INS, NAN, and APA Division 40 members.
Archives of Clinical Neuropsychology, 20, 33-65.
Reitan, R., & Wolfson, D. (1985). The Halstead-Reitan Neuropsychological Test Battery. Tucson, AZ: Neuropsychology Press.
Sharland, M., & Gfeller, J. (2007). A survey of neuropsychologists’ beliefs and practices with respect to the assessment of effort. Archives of Clinical Neuropsychology, 22, 213-223. Sherman, D., Boone, K., Lu, P., & Razani, J. (2002). Re-examination of a Rey Auditory Verbal
Learning Test/ Rey Complex Figure discriminate function to detect suspect effort. The Clinical Neuropsychologist, 242-250.
Slick, D., Sherman, E., & Iverson, G. (1999). Diagnostic criteria for malingered neurocognitive dysfunction: Proposed standards for clinical practice and research. The Clinical
Neuropsychologist, 13, 545-561.
Sollman, M., & Berry, D. (2011). Detection of inadequate effort on neuropsychological testing: A meta-analytic update and extension. Archives of Clinical Neuropsychology, 774-789. Suhr, J., & Barrash, J. (2007). Performance on standard attention, memory, and psychomotor
speed tasks as indicators of malingering. In G. Larrabee, Assessment of malingered neuropsychological deficits (pp. 80-99). New York, NY: Oxford University Press. Tombaugh, T. (1996). Test of Memory Malingering (TOMM). North Tonawanda, NY: Multi
Health Systems.
Trueblood, W., & Schmidt, M. (1993). Malingering and other validity considerations in the neuropsychological evaluation of mild head injury. Journal of Clinical and Experimental Neuropsychology, 587-590.
van Gorp, W., Humphrey, L., Kalechstein, A., Brumm, V.L., McMullen, W., Stoddard, M., & Panchana, N. (1999). How well do standard clinical neuropsychological tests identify malingering? A preliminary analysis. Journal of Clinical and Experimental
Vanderploeg, R., & Curtiss, G. (2001). Malingering assessment: Evaluation of validity of performance. NeuroRehabilitation, 245-251.
Vickery, C., Berry, D., Dearth, C., Vagnini, V., Baser, R., Cragar, D., & Orey, S. (2004). Head injury and the ability to feign neuropsychological deficits. Archives of Clinical
Neuropsychology, 19, 37-48.
Appendix A
Demographics Survey
Participant Number (create a five-digit code): _____________________ Please complete the following information about yourself:
1. Date of birth: ____________ (mm/dd/yy) 2. Age: ___________ years, __________ months 3. Ethnicity: ______________________
4. Gender: ____________________
5. Current year of education: ___________________ 6. Major: ____________________
7. Have you ever been diagnosed with a concussion? Yes No
a. If yes, how long ago did it occur? ________ years, _________ months b. If yes, how long did you have difficulty thinking and concentrating?
______ days, ______ hours, ______ Minutes.
Have you ever experienced loss of consciousness (not due to substances)? Yes No
c. If yes, how many times have you experienced loss of consciousness as a result of head injury? ____________ times.
d. If yes, how long ago did the first experience occur? ________ years, _________ months
8. Are you currently experiencing feelings of sadness? Yes No
9. Are you currently experiencing low motivation? Yes No.
10.Have you recently experienced feelings of intense fear with shortness of breath and racing heartbeat?
Yes No
Please rate the following experiences using a 1-4 scale to indicate frequency: 1 = Never, 2 = Rarely, 3 = Occasionally, 4 = Consistently.
If you are interested in receiving information about the outcome of this study please provide your email address:
E-mail address:______________________________________________
Issue: Rating: Issue: Rating
Seizures Diabetes
Trouble with memory Thyroid problems Hyperactivity Prolonged fatigue Trouble with concentration Difficulty with balance Impulsivity Finding the right word Poor decision making Heart problems
Suspended from elementary school Quick temper Expelled from school Headaches Repeated a grade in elementary
school
Difficulty getting enough sleep
Appendix B
Informed Consent
Embedded Performance Measures Within the Delis-Kaplan Executive Function System
I agree to participate in a study that requires me to complete a series of tests that will evaluate different ways of thinking such as memory, verbal performance, visual sorting, and decision making. I will be administered three subtests from the Delis-Kaplan Executive Functioning System (D-KEF) and the Medical Symptom Test. I understand that this testing will take approximately one hour and may require up to two sessions.
I understand that all information gathered and test results are for research purposes only, and the doctoral student administering the tests will protect my identity and privacy in any and all learning experiences in which this information is used. I understand that there are some circumstances that can limit this confidentiality, which include, but are not limited to: (a) a statement of intent to harm myself or others, (b) statements indicating harm or abuse of children or vulnerable adults, and (c) a subpoena from a court of law.
I understand that I will have the opportunity to take part in a discussion with the doctoral student administering the test regarding the procedures involved. I understand that there is no cost associated with participating in this study. This study has been assessed for risk and approved by the George Fox University Institutional Review Board.
I understand that I am expected to put forth my best effort while participating in these activities. I understand that these can measure how hard I am trying, and if the tests show that I put forth my best effort I will be awarded a $20 gift card. I understand that by participating I may experience feelings of frustration and stress, and may feel tired. I understand that I may take breaks at any time, and I may also withdraw my involvement at any point with no explanation necessary and without consequence.
If you are willing to participate, please sign below to indicate your consent to participate in this study. Thank you for supporting this important research.
Sincerely,
Daniel H. Olsen, M.A., Principle Investigator Graduate Department of Clinical Psychology George Fox University
By signing indicate that I understand and accept the conditions outlined above, and agree to be a participant in the study entitled Embedded Performance Measures Within the Delis-Kaplan Executive Function System
______________________________ ______________________________ Printed Name Signature
______________________________ Date
______________________________ ______________________________ Printed name (Witness) Witness’ Signature
Appendix C
Informed Consent
Embedded Performance Measures Within the Delis-Kaplan Executive Function System
I agree to participate in a study that requires me to complete a series of tests that will assess many different ways of thinking such as memory, speed tests, and decision making. I understand that this testing will take approximately one hour and may require up to two sessions. I also agree to participate in completing a brief clinical interview.
I understand that all information gathered and test results are for research purposes only, and the person administering the tests conducting the interview will protect my identity and privacy in any and all learning experiences in which this information is used. I understand that there are some special circumstances that can limit this confidentiality, which include, but are not limited to: (a) a statement of intent to harm myself or others, (b) statements indicating harm or abuse of children or vulnerable adults, and (c) a subpoena from a court of law.
I understand that I will have the opportunity to take part in a discussion with the person administering the test regarding the procedures involved. I understand that there is no cost associated with participating in this study. I understand that this study has been assessed for risk and approved by the George Fox Institutional Review Board. I understand that by participating I may experience feelings of frustration and stress, and may become fatigued.
I understand that I am expected to pretend to have a cognitive disability. I understand that the activities I will be participating in are sensitive to how hard I am working, and I am to attempt to fool the tests into thinking I am impaired but still trying hard. I understand that if I am able to trick the tests and perform as though I have a cognitive impairment while putting forth good effort I will receive a $20 gift card. I understand that I may take breaks at any time and I may also withdraw my involvement at any point with no explanation necessary and without consequence.
If you are willing to participate, please sign below to indicate your consent to participate in this study. Thank you for supporting this important research.
Sincerely,
Daniel H. Olsen, M.A., Principle Investigator Graduate Department of Clinical Psychology George Fox University
By signing indicate that I understand and accept the conditions outlined above, and agree to be a participant in the study entitled Embedded Performance Measures Within the Delis-Kaplan Executive Function System
______________________________ ______________________________ Printed Name Signature
______________________________ Date
______________________________ ______________________________ Printed name (Witness) Witness’ Signature
Appendix D
Traumatic Brain Injury Fact Sheet
Adapted from http://www.mayoclinic.org/diseases-conditions/traumatic-brain-injury, and
http://www.traumaticbraininjury.com/
What is it?
Traumatic brain injury, often referred to as TBI, occurs when an outside mechanical force
causes brain dysfunction such as a violent blow or jolt to the head or body. An object penetrating
the skull, such as a bullet or shattered piece of skull, also can cause traumatic brain injury. As
with other injuries, the individual is typically functioning well before the injuring event.
However, after the injury there is an abrupt change in the individual’s abilities.
Since our brain defines who we are, the consequences of a brain injury can affect all
aspects of our lives, including our personality. Symptoms may appear right away or may not be
present for days or weeks after the injury. One of the consequences of brain injury is that the
person often does not realize that a brain injury has occurred.
Brain injuries do not heal like other injuries. Recovery is a “functional” recovery, based
on mechanisms that remain uncertain. No two brain injuries are alike and the consequence of two
similar injuries may be very different.
Mild traumatic brain injury may cause temporary dysfunction of brain cells. More serious
traumatic brain injury can result in bruising, torn tissues, bleeding and other physical damage to
Effects
Most people are unaware of the scope of TBI or its overwhelming nature. TBI is a
common injury and may be missed initially when the medical team is focused on saving the
individual’s life. Before medical knowledge and technology advanced to control breathing with
respirators and decrease intracranial pressure, the pressure in the fluid surrounding the brain, the
death rate from traumatic brain injuries was very high. Although the medical technology has
greatly advanced, the effects of TBI are significant.
TBI is classified into two categories: mild and severe. A brain injury can be classified as
mild if loss of consciousness and/or confusion and disorientation is shorter than 30 minutes.
While brain scans are often normal, the individual can experience cognitive problems such as
difficulty thinking, memory problems, attention deficits, mood swings and frustration. These
injuries are commonly overlooked. Even though this type of TBI is called “mild”, the effect on
the family and the injured person can be devastating.
Severe brain injury is associated with loss of consciousness for more than 30 minutes
and memory loss after the injury or penetrating skull injury longer than 24 hours. The deficits
range from impairment of higher level cognitive functions to comatose states. Survivors may
have limited function of arms or legs, abnormal speech or language, loss of thinking ability or
emotional problems. The range of injuries and degree of recovery is varies widely and is
individualistic.
The effects of TBI can be profound. Individuals with severe injuries can be left in
long-term unresponsive states. For many people with severe TBI, long-long-term rehabilitation is often
necessary to maximize function and independence. Even with mild TBI, the consequences to a
job, social and community interaction. Some signs or symptoms may appear immediately after
the traumatic event, while others may appear days or weeks later.
Mild traumatic brain injury
The signs and symptoms of mild traumatic brain injury may include:
Physical symptoms
Loss of consciousness for a few seconds to a few minutes
No loss of consciousness, but a state of being dazed, confused or disoriented
Headache
Nausea or vomiting
Fatigue or drowsiness
Difficulty sleeping
Sleeping more than usual
Dizziness or loss of balance
Sensory symptoms
Sensory problems, such as blurred vision, ringing in the ears, a bad taste in the mouth or
changes in the ability to smell
Sensitivity to light or sound
Cognitive or mental symptoms
Memory or concentration problems
Mood changes or mood swings
Moderate to severe traumatic brain injuries
Moderate to severe traumatic brain injuries can include any of the signs and symptoms of
mild injury, as well as the following symptoms that may appear within the first hours to days
after a head injury:
Physical symptoms
Loss of consciousness from several minutes to hours
Persistent headache or headache that worsens
Repeated vomiting or nausea
Convulsions or seizures
Dilation of one or both pupils of the eyes
Clear fluids draining from the nose or ears
Inability to awaken from sleep
Weakness or numbness in fingers and toes
Loss of coordination
Cognitive or mental symptoms
Profound confusion
Agitation, combativeness or other unusual behavior
Slurred speech
Appendix E
Traumatic Brain Injury Vignette
Adapted from Ogden (2005)
Rachel was a tall, attractive, 14-year-old female adolescent who acted more mature than her age. Rachel was referred because of difficulties she had been experiencing following a mild closed traumatic brain injury (TBI) two months earlier. Rachel’s doctor and mother were concerned because her problems were emotional as well as cognitive and had been “dragging on” for many weeks. As Rachel commented, “No one really believes my problems are because of my head injury anymore because I seem so normal and healthy on the outside. Sometimes even I think the head injury never happened, and I am going crazy.” The skepticism of friends, family, and even the medical profession about an organic cause for Rachel’s problems typifies the attitude of many sufferers and rehabilitation specialists call it “the unseen injury.”
Before her accident, Rachel was the top student in her class at school; she enjoyed music, art, swimming, aerobics, and skiing. Rachel planned to graduate from high school early, and attend the university to study fine art. Her mother, younger sister, and friends perceived her to be an extrovert. As her best friend, Louise, commented, “Rachel was always involved in something exciting.” She was popular at school and she and her Mom were close. Her younger sister, Jody, was also considered exceptionally talented, and at the age of 12 she was already an accomplished violinist. The girls’ parents were divorced and their father lived in New Zealand.
a little confused, but after resting for 10 minutes she was able to stand up and ski the short distance to the base facilities. She was checked by the ski patrol staff who said she may have had a brief concussion and should rest and not ski again for a few days. Louise and her parents reported that Rachel seemed confused and was unable to remember much for about 4 hours after the accident. After a night’s sleep, Rachel felt somewhat better and was no longer confused, although she did complain of a continuous headache. After a checkup by her family doctor, Rachel rested for the week of school vacation left before returning to school at the beginning of the final term of the year.
Three days after starting school, she returned home in the early afternoon, distressed because she could not concentrate and could not get rid of her headache. From this time on her school performance deteriorated, and art was the only subject with which she could cope. The art room was quiet, and the students worked at their own pace. On her doctor’s suggestion, she reduced her school hours to three per day and slept in the afternoon. She still could not keep up with math and soon dropped the class, At home she was irritable, sad, lacked energy, and spent her evenings in her room listening to music. Her mother and friends tried to encourage her to socialize but with little success.
Two months after her head injury Rachel was still demonstrating problems with attention, memory, and drawing tasks, which was surprising given her love for artistically oriented