R E S E A R C H
Open Access
Automatic segmentation of coronary angiograms
based on fuzzy inferring and probabilistic
tracking
Zhou Shoujun
1, Yang Jian
2, Wang Yongtian
2, Chen Wufan
1** Correspondence: [email protected]
1School of Biomedical Engineering, Southern Medical University, Guangzhou, 510515, China
Abstract
Background:Segmentation of the coronary angiogram is important in computer-assisted artery motion analysis or reconstruction of 3D vascular structures from a single-plan or biplane angiographic system. Developing fully automated and accurate vessel segmentation algorithms is highly challenging, especially when extracting vascular structures with large variations in image intensities and noise, as well as with variable cross-sections or vascular lesions.
Methods:This paper presents a novel tracking method for automatic segmentation of the coronary artery tree in X-ray angiographic images, based on probabilistic vessel tracking and fuzzy structure pattern inferring. The method is composed of two main steps: preprocessing and tracking. In preprocessing, multiscale Gabor filtering and Hessian matrix analysis were used to enhance and extract vessel features from the original angiographic image, leading to a vessel feature map as well as a vessel direction map. In tracking, a seed point was first automatically detected by analyzing the vessel feature map. Subsequently, two operators [e.g., a probabilistic tracking operator (PTO) and a vessel structure pattern detector (SPD)] worked together based on the detected seed point to extract vessel segments or branches one at a time. The local structure pattern was inferred by a multi-feature based fuzzy inferring function employed in the SPD. The identified structure pattern, such as crossing or bifurcation, was used to control the tracking process, for example, to keep tracking the current segment or start tracking a new one, depending on the detected pattern.
Results:By appropriate integration of these advanced preprocessing and tracking steps, our tracking algorithm is able to extract both vessel axis lines and edge points, as well as measure the arterial diameters in various complicated cases. For example, it can walk across gaps along the longitudinal vessel direction, manage varying vessel curvatures, and adapt to varying vessel widths in situations with arterial stenoses and aneurysms.
Conclusions:Our algorithm performs well in terms of robustness, automation, adaptability, and applicability. In particular, the successful development of two novel operators, namely, PTO and SPD, ensures the performance of our algorithm in vessel tracking.
Background
Accurate extraction of the coronary artery tree from coronary angiograms is important for the diagnoses, treatment, and clinical study of various coronary artery diseases. In particular, computer-assisted analysis can improve the performance of quantitative eva-luation. It can reduce the inter- and intra-observer variations in determining the sever-ity of coronary artery stenosis [1]. An efficient vessel extraction algorithm also enables the detection of coronary artery motion, as well as the reconstruction of 3D vascular structures from a single-plan or biplane angiographic system [2].
Anatomical structures, such as blood vessels, nerves, and bronchi, present themselves as line-liked structures in 2D images or as tubular structures in 3D images. Over the past 10 years, a variety of approaches have been developed for vessel segmentation from 2D and 3D medical images [3], which typically differ in terms of basic strategies or imaging modalities. Common segmentation approaches employ multiscale filters, morphological segmentations, deformable models, front propagation methods, track-ing-based methods, and ridge traversal-based methods. Although many of these approaches are promising for vessel segmentation, developing fully automated, faster, robust, and accurate vessel segmentation algorithms remains highly challenging because of the complexity of vascular structures as well as large variations in image intensities and noise.
Tracking-based methods [4-9] exhibit a natural advantage in extracting arterial axis lines in the angiographic images because of their relative simplicity, as well as their adaptability to variations in vessel diameters. In addition, their ability to capture detailed quantitative descriptions of vessel axes, diameters, and boundaries, leads to high levels of accuracy. Traditional tracking-based methods, however, are guided by simple local features that limit their utility because of difficulties in efficiently integrat-ing advanced features into canonical expressions for guidintegrat-ing the trackintegrat-ing. Therefore, the use of minimum cost functions or multi-scale filters [10-13] to construct the track-ing operator poses several advantages in the segmentation of coronary angiograms; this approach, however, may also be problematic when meeting bifurcations or vessel crossings because it can follow only the path with the strongest response.
In this work, we propose a fully automatic tracking-based method that can adapt to varying vessel curvatures and diameters resulting from arterial stenoses or aneurysms. It can also walk across intensity gaps along the longitudinal vessel direction, and man-age vessel bifurcations and crossings.
Methods
vessel segments beginning from this artery element in subsequent tracking. The track-ing algorithm stops when all points on the list of source data are tracked.
During the process mentioned above, local features and measures, such as the Gabor response, vessel path, skeleton-line, and directional consistency, were also analyzed to integrate the relational vessel attributes for probabilistic vessel tracking and structure pattern identification. The PTO is designed to incorporate local features and measures to determine candidate artery elements along the same vessel segment. These candi-dates were selected particularly from the overlapping region between the binarized ves-sel regions and a sampling disk centered at the current artery element under consideration. The size of the sampling disk corresponds to the current vessel dia-meter, thus rendering the PTO adaptive to varying vessel diameters in case of arterial stenoses or aneurysms. Simultaneously, the SPD works to infer the vessel structure pattern, such as the distal end, segment, bifurcation, and crossing. To complete struc-ture pattern identification, the vessel feastruc-ture profile scanned from a circle around the current artery element was analyzed and a fuzzy inferring function was applied. In par-ticular, multiple features such as vessel feature, direction continuity, and Gabor responses at the peaks of the vessel feature profile were integrated into the fuzzy infer-ring function for pattern identification.
Vessel feature and direction maps
The intensity profile across the longitudinal direction of the vessel may highlight an elevation or even a slight intensity dip at the center, depending on the contrast between vessels and background. On the other hand, the profile along the longitudinal direction of the vessel can be smooth [Figure 2(b)]. Accordingly, the multiscale detec-tion or enhancement of vessel structures can be completed by convolving angiographic imageI(x) [wherex = (x,y)] with normalized second-order Gaussian derivativesG(x; sf) at different scales sf. The use of a Gaussian filter is important in reducing the
influence of noise, properly shaping the line profile and ensuring a large second deriva-tive across the vessel.
In 2D cases, let∇2 I(x,sf) be a Hessian matrix combined with Gaussian convolution
for angiographic image I(x). It can be written as
∇ = − ⋅
∂
∂ ∂ ∂ ∂∂ ∂
∂ ∂ ∂ ∂∂ ⎛
⎝ ⎜ ⎜ ⎜ ⎜
⎞
⎠ ⎟ ⎟ ⎟ ⎟
2 2
2 2
2 2
I x x x y
y x y y G
f f f
( ,x ) ( ,x )
⎧⎧
⎨ ⎪ ⎪
⎩ ⎪ ⎪
⎫
⎬ ⎪ ⎪
⎭ ⎪ ⎪
∗I( )x (1)
whereG(x;sf) denotes a Gaussian filter with standard deviationsf.
The bright line structure on a dark background can be reflected by a Hessian matrix with a large negative eigenvalue l1 and a small eigenvaluel2 of positive or negative
sign; that is l1< 0 and |l2|≪ |l1|. Various response functions have been proposed in
previous studies [11-13]. We provide a similar response function to extract the vessel structures by thresholding the eigenvalue map using a low threshold |rl|, expressed in
Z( ,xf)=⎪⎨⎧ln((x,f) )+c <r
⎩⎪
1 1
0 else
(2)
where cis a constant. Note thatl1 is negative in our case, with r = − 2f . This response equation provides a vessel discriminant function at scalesf. To integrate
mul-tiscale responses corresponding to different scales at each location x, we select the maximum response across multiple scales,i.e.
Z Z f f n
∧
= =
( )x max( ( ;x )), 1,..., (3)
where s1 andsnare the minimum and maximum scales, determined according to
the range of vessel diameters in the angiographic images. In this paper, 14 scales were used. For convenience, the resulting vessel features are normalized to 0[1] in this paper. Vessel feature map Z∧( )x (Figure 2 (a3-a4)) may also be binarized for extracting the vessels, and may further be thinned to obtain the skeletal lines representing the vessels.
The vessel direction map is estimated using the best detected scale. First, the maxi-mum of absolute eigenvalue |l1| is obtained at each location x by |opt( ) | maxx = f |1( ;xf) |. Assuming that the eigenvector corresponds tolopt(x) is
vopt(x), the direction orthogonal tovopt(x) is then selected as the vessel direction at x.
For convenience, we again usev2 to represent the estimated vessel direction map later
in this paper.
Therefore, using this step of multiscale analysis, we obtain three separate maps from the original angiographic images, namely, a vessel feature map, a vessel direction map, and a map of skeleton lines. Next, an initial seed point x0 is automatically detected
from a point within the thinned vessel skeleton-lines, as well as with maximum vessel feature intensity Z∧(x )
Probabilistic tracking of coronary artery
A dynamic mechanism was designed for our tracking framework. First, a list for source points (called source-list) was maintained to keep the initial seed point, as well as the vessel bifurcations that were detected during the vessel tracking procedure. In addition, a second list of crossings (called crossing-list) was designed to keep the possible cross-ings of two vessels. Then, a sampling disk with about half the size of the vessel dia-meter was used in the PTO to automatically track the artery segments (or branches) one at a time, beginning from the seed point and stopping at the vessel termination. During the tracking, the proposed SPD functioned simultaneously to report the local vessel pattern as bifurcation, crossing, segment, or termination. All detected vessel bifurcations were stored one at a time at the top of the source-list and were later used as subsequent starting points for tracking their respective artery segments (or branches). Finally, the vessel PTO and the SPD stop tracking and identifying vessels once all vessels have been tracked and registered.
Tracking criterion
The tracking mechanism was designed based on the criterion ofcontinuity properties of luminance, position, and diameterof the general coronary artery in the angiographic images. The appropriate incorporation of these properties into the PTO enables suc-cessful management of the cases of vessel gap (caused by nonuniformity of the contrast medium or inappropriate thresholding in the preprocessing step) and arterial lesion (such as stenosis or aneurysm).
Description of PTO
Our PTO performs automatically along the coarse vessel path extracted from the ves-sel feature map. It begins or stops tracking an artery segment (or branch), depending on the structure pattern detected at current artery elementet. The tracking problem at
simple artery positions, with no bifurcations, crossings, or terminations, is to determine the next artery element et+1 in the vessel path. Each artery elementethas four
asso-ciated attributes, namely position xt, vessel feature Z
t
∧
(x ), direction vectorjt=v2(xt),
and vessel diameter dt. These attributes guide the vessel tracking algorithm. For
effi-ciency, a sampling disk centered at the current artery element etwas used to search
for a set of candidate elements {(x , (x ), , ) | [ ,..., ]} t
i t i
ti ti s
Z d i N
+ + + +
∧
∈
1 1 1 1 1 from the
overlapping region between the sampling disk and the binarized vessel feature map. From artery element ttot+1, the probabilistic tracking can be formulated by a maxi-mum posterior probability (MAP), expressed as
x x x
∧
+
∈ +
= t
i N t
i t
t
P 1
1 1
arg max ( | )
[ ,..., ] (4)
The sequent modeling was based on the aforementioned continuity properties of the artery vessel. During tracking vessel length [Figure 3(a)], three local terms were used to constrain the candidates based on vessel feature continuity, longitudinal direction continuity, and diameter continuity. The first term, Z
t i
∧
+
(x 1), was acquired from the
described in aforementioned sections. Given vector Vti+1 pointing from current posi-tion xtto candidate point xti+1, a deflection of vessel direction ti+1= ∠Vti+1− ∠t
[Figure 3(a)] yields a means of the longitudinal continuity. In the case of vessel cross-ing or parallelcross-ing with each other (especially for thin vessels), the third term of dia-meter continuity enables the tracking of the current vessel segment/branch to proceed without being affected by neighboring vessels. Given dti+1 and dtas the vessel
dia-meters, respectively at candidate point xti+1 and current artery elementxt, increment
∇dti+1=|dti+1−dt| yields the measure of diameter continuity. Altogether, the estima-tion of the optimal candidate gives emphasis to the continuity properties, which is also the basic idea for probabilistic tracking. In the following paragraph, we provide further discussion to mathematically model.
First, the relationship between the sampling instance and the posterior probability can be described as
Z∧ ti+ ti+ ∇dti+ t P ti+ t ⎛
⎝
⎜ ⎞
⎠
⎟ →
(x 1); ; 1 1 x (x 1|x ) (5)
All feature measures in the left of the abovementioned expression are normalized before participation in the estimation of probability. In particular, maximal vessel fea-ture Z∧
max and maximal diameterdmaxare determined from allNscandidate points in the sampling disk, and are used to normalize the respective measures. Note that in practice, estimated vessel direction ∠jtcan be reversed; thus, it should be considered
in the normalization of ti
+1. Given normalized measures QZ(xti+) |= −Z(xit+) /Zmax|
∧ ∧
1 1 1 , and Qd ti dt d
i
(x +1)= ∇ +1 max, their probabilities can be respectively written as:
q
Z t
QZ ti Z t Z( ti )
,
exp ( )
,
x + = ⋅ − x +
⎛ ⎝ ⎜ ⎜⎜ ⎞ ⎠ ⎟ ⎟⎟ 1 1 2 2 1 2 2
(6:1)
q
t
Q ti t t i ( ) ,
exp ( )
,
x + = ⋅ − x +
⎛ ⎝ ⎜ ⎜⎜ ⎞ ⎠ ⎟ ⎟⎟ 1 1 2 2 1
2 2 (6:2)
q
d t
Q d ti
d t d t
i
( )
,
exp ( )
,
x + = ⋅ − x +
⎛ ⎝ ⎜ ⎜⎜ ⎞ ⎠ ⎟ ⎟⎟ 1 1 2 2 1 2 2
(6:3)
where sZ,t,sθ,t, andsd,tare the standard deviations, which can be estimated by
cal-culating the variances of the corresponding measures in allNscandidates. For example,
sZ,tis estimated as
Z t Z ti
Z i
N
N s Q Q
S , = ⎡⎣ ( + )− ⎤⎦ =
∑
1 1 2 1 x (7)where QZ is the average measure obtained by QZ Ns QZ ti i Ns = + =
∑
1 1 1(x ). By
integrat-ing all distribution functions in Eq. (6), the optimal estimation of artery elementet+1
can be obtained by
et t q q q
i N
z ti ti d
t i s + + = + + = ∧ = ⋅ ⋅ + 1 1 1 1 1 1
x x x x
x
arg max ( ( ) ( ) (
, ,...,
tti+1)) (8)
the vessel tracking, the candidates running into the gaps can be crossed out by the continuity terms, thus enabling PTO to continue working. On the other hand, in case candidates run into the regions of the artery lesion, the PTO still carries on, even with large variations in vessel diameter.
Artery diameter estimation
Considering that the blood vessels have measurable abnormalities in diameter, inten-sity, and tortuointen-sity, the artery diameter of candidate xti+1 should be estimated adap-tively by analyzing its 1-D vessel feature profile orthogonal to the vessel direction. All candidates sitting along the sample profile have the same vessel diameter estimated (as described next). For example, in Figure 3(b), another candidate xtj+1 sitting at the peak of the profile has the same vessel diameter as xti+1. The profile can be repre-sented by transversal line Cti+1 with a single pixel width, as shown in Figure 3(b). Can-didates xti+1 and xt
j
+1 have the same profile, and thus the same diameter.
The feature values in the particular profile can be obtained from vessel feature map
Z∧ . The vessel diameter on this profile can be measured through the convolution of the normalized second derivative of the 1-D Gaussian function with the profile. Stan-dard deviation sin the 1-D Gaussian function should be adjusted during the vessel diameter estimation. Standard deviation ∧ that results in the largest response among all convolution results with the use of different standard deviations is finally selected as the estimated diameter for all candidates sitting on the same profile. Using this method, we can estimate vessel diameter dti+1 for candidate xti+1.
This vessel diameter estimation process proceeds automatically without user interaction. The relevant diameter estimation results are demonstrated in the experimental section.
Inferring structure pattern of artery vessel
When the PTO works on current artery elementxt, the SPD should also work in parallel
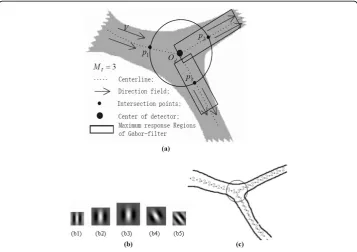
to report the structure pattern to guide the PTO. Our SPD performs in the following manner. First, a circular pattern detector is centered on current artery elementxt. It
then acquires the circular cross-section profile from vessel feature map Z∧ .
Subse-quently, it captures local vessel measures, including the number of peaks in profile (Mt),
the azimuth vector directing from the detector center to every peak (pm), and the Gabor
response on each peak (go.m). Finally, it returns the structure pattern inferred by a fuzzy
inferring operator using the fuzzy membership degrees of multi-feature fuzzy subsets.
Detecting the peaks of the vessel-feature profile
The pattern detector samples of vessel features Z∧ along the circular cross-section
pro-file are centered at current artery element xtwith radius rt=a·dt/2. Generally, the
range of parameter ain a Î [1,1.5] is preferred for better measurement because in this case, the radius of circular pattern detector is a little bit larger than half of vessel diameter dtof current artery elementxt; thus, the structure aroundxtcan be
adap-tively and completely captured. The resulting vessel feature profile is called circular template T(x,r,t), which consists of a fixed number (e.g., 150) of vessel features sampled
over the circumference of a circle (xt, rt). The same number of vessel features Z∧ is
feature map Z∧ is defined in discrete domain, the bilinear interpolation is used for
sampling features from Z∧ when generating circular templateT
(x,r,t).
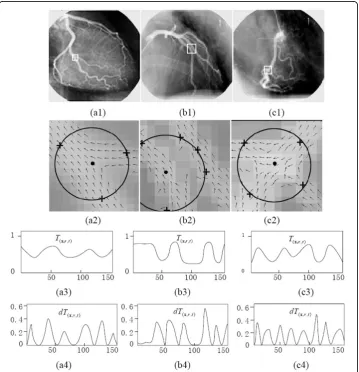
The sampling process is demonstrated in Figure 4, in which the vessel feature pro-files are sampled by the circular templates (T(x,r,t)) in 4(a2)-4(c2). The typical profiles
are shown in 4(a3) - 4(c3). To detect the peaks in each profile, first-order derivative dT(x,r,t)ofT(x,r,t)is computed through the circular convolution ofT(x,r,t)with the
first-order derivative of the 1-D Gaussian filter. Figures 4(a4) - 4(c4) shows the magnitude profile of the resulting first-order derivative |dT(x,r,t)|. The local minima of the
deriva-tive magnitude correspond to the maxima or minima of the vessel feature profile along T(x,r,t). The peaks of the profile corresponding to maxima can be detected according to
the derivative signs. For example, a peak of the profile corresponds to the sign transi-tion of the first-order derivative from positive to negative. In this manner, we can detect all peaks along with their locations [e.g., z{pm= (xm, ym), m= 1,...,Mt}], where
Mtis the total number of peaks.
Figure 4Using the circular pattern detector to characterize the vessel structures, in the cases with bifurcation, paralleling, and crossing patterns. (a1)-(c1) are original images and the respective regions of interest. (a2)-(c2) are the corresponding direction maps overlaping with circular pattern detectors. (a3)-(c3) are the corresponding vessel-feature profiles on the circular templateT(x,r,t). (a4)-(c4) are the
The resulting peaks provide the SPD vessel with several important properties, such as their positions, vessel features, vessel directions, as well as their relationships with the center of pattern detector (xt). To better infer the pattern of the vessel structure, more relevant metric
features, such as the Gabor features described in the next section, should be extracted.
The Gabor responses at locations of the peaks
Considering that the peaks of the circular profile provide useful information for struc-ture identification, we first discuss how to infer the case in which two points (apart less than a few pixels) are located at the same vessel axis line. This case may also be called “co-vessel.” To detect whether peak point pm= (xm, ym) and detector center
(Od) are located in the same segment of the vessel, the Gabor filter operator [14,15]
was used for local description. As a function of orientation, frequency, and scale, the operator can characterize the dominant attributes at peak point pm= (xm,ym). Note
that this responds strongly to the isolated vessel strip, but exhibits a weaker or no response to the noise.
Given the relationship between the Gabor filter scale and the frequency with 2s= 2πf=T, several masks by the Gabor operator can be defined by the real component of the Gabor function with a size of T ×T. The masks of different scales are shown in Figure 5(b). Thus, to characterize local attributes, such as direction and “co-vessel” at a peak point, we merely need to compute the responses of several Gabor masks, and retain only the related parameters corresponding to the maximum response. Although none of these parameters are invariant to common image transformation, such as scal-ing and rotation, only one set of parameters corresponds to maximum responsegmax
at the considered position. Given vector Vo,mdirecting from the detector center to the
peak position (xm, ym), the following response measurego,mrepresents the degree with
which peak pm = (xm, ym) belongs to the same vessel axis line of the center point of
the pattern detector
o m V m m
g G o m x y
, , / ,
max
arg | , ( , ) |
= 1 max ∠ (9)
Where 0 <go.m< 1. With an image sized 512 × 512, the size of the mask (s) is equal
to the vessel diameter, which ranges from 3 to 14 pixels. Therefore, the resulting mea-surego,mreflects the relationship between peakpmand the detector center. For
exam-ple, the resulting measure go,mat peakpmis lower if mask orientation Vo,mdoes not
accord with the local vessel direction, that is, there is no“co-vessel”existing between the peak point and the detector center.
The multi-feature based fuzzy inferring function (FIF)
Four types of patterns can be inferred, namely, vessel termination (i = 1), artery seg-ment (i = 2), bifurcation (i = 3), and crossing point (i = 4), where variablei denotes the index for the ordinal structure pattern of the artery vessel. With effects from noise and pseudo edge, the number of peaks in each of these four types of patterns might be higher than the actual one. For example, by comparing the circular cross-section pro-file of different cases (Figure 4), we can observe that more than two peaks might occur in the profile of the artery segment, and more than three or four peaks might occur in the profile of the bifurcations or crossings, respectively. Without loss of generality, the circular pattern detector detects the number of peaks from the ordinal structure pat-tern according toMt≥1,Mt≥2,Mt≥ 3 andMt≥4 [Figure 5(a)]. Thus, the number
Mtcan be regarded as a pseudo pattern of the artery structure. On the other hand,
each peakpmhas two metric features important to pattern identification: vessel feature
Z pm
∧
( ) at peak pm, and response measure go,m of Gabor mask function
G V xm ym
o m
∠ , , / , ( , ). The relationship between the pattern detector and the metric features for a typical artery bifurcation is shown in Figure 5(a).
In the following section, the fuzzy subsets are defined for all metric features, as well as for number of peaksMt. They will then be integrated for pattern inferring of pointxt.
Definition 1: In the region Ω ={ ,∧ , , | ≤ ≤ ;∧ , ∈[ , ]}
, ,
pm Zm o m Mt 1 m M Zt m o m 0 1 , given that fuzzy subsets Fm Z,∧ andF
m,gcorrespond to the metric features of peakpm,
and fuzzy subset FMi
t,xt corresponds to thei-th pseudo pattern at current position xt,
the membership degrees of these fuzzy subsets can be defined by the standard Gaus-sian function as
m Z m
Z Z m
Z
o m
, exp ,
( max )
; exp ( max )
∧ ∧ ∧ = − − ⎛ ⎝ ⎜ ⎜ ⎜ ⎞ ⎠ ⎟ ⎟ ⎟ = − − 2 2 2 2 , 2 2 2 2 2 2 ⎛ ⎝ ⎜ ⎜ ⎞ ⎠ ⎟ ⎟ = − − ⎛ ⎝ ⎜ ⎜ ⎜ ⎞ ;
exp ( )
,
Mit t
Mt i Mt x ⎠⎠ ⎟ ⎟ ⎟ ≥ ⎧ ⎨ ⎪ ⎪ ⎩ ⎪ ⎪
Mt i
0 else
where. Z Z m m
∧ ∧
=
max max ., gmax = maxm go,m, andm = 1,...,Mt. The above
expres-sions, m Z,∧ andμm,g, represent the respective degrees of membership of two metric
features at current position xt, which are used to ensure that each peak pmis located
at the center of the vessel. Meanwhile, Mi t,xt provides the membership degree of the
pseudo pattern based on the number of peaks. According to the abovementioned membership degrees, the structure patterns of current position xtcan be inferred by
the following definition.
Definition 2:In the same regionΩ, givenJi(xt) the fuzzy subset of the structure
pat-tern belonging to the i-th pattern at current positionxt, the relationship between fuzzy
setJi(xt) and the fuzzy sets of the metric features is given by
Ji t F F F
m M
m Z m M
m Mi
t t
t t
( ) { } { } { }
, , ,
x = x
= ∧ =
1 1
(11)
The membership degree of Ji(xt) is given by:
Ji
t m
M
m Z m M
m Mi
t t
t t
(x )= ∧( , )∧ ∧( , )∧ ,x
=1 =1
(12)
where it is shown that the direct inferring of the local vessel structure can be hardly implemented using Ji(xt)>T with threshold Ta. Therefore, the optimal pattern inference should be based on the principle of maximum membership degree and can be expressed as
Ji
t i J i t 0 1 4
(x )= ∨[ (x )]
= (13)
which infers the artery structure at current position xtbelonging to thei0-th pattern.
When the detector center is near the vessel node (e.g., bifurcation or crossing), the resulting node position can be ambiguous; for example, a few of the redundant posi-tions may possibly be the node posiposi-tions because of the similarity of their metric fea-tures to those of the actual node. To solve this problem, a second local maximum operation is performed to obtain a preferable node position. Givennredundant posi-tions near the bifurcation, with the membership degrees {Ji3(xt1),..., and Ji3(xnt)},
the preferable one should be located at
x x
x ∧ =
=
arg max ( ( ))
, ,...,
t
kk n J
i tk 1
3
(14)
In Figure 5(c), the numbers 2 and 3 represent the two structure patterns determined in the corresponding locations by the proposed pattern detector. Pattern detection result is used to guide the vessel tracking process.
Manipulation of vessel tracking process and organiztion of tracking results
Appropriate termination conditions for vessel tracking are important to achieving bet-ter tracking performance. Our vessel tracking algorithm stops tracking the current artery segment or branch once one of the following conditions is satisfied: (1) a new vessel bifurcation is detected, which should be dealt with appropriately; (2) vessel fea-ture Z
t
∧
+
as when a value is slightly higher than the background (this threshold is set as 0.05 in this paper); (3) the current path overlaps with a vessel path previously detected, except when a crossing point on the vessels has been detected and recorded in advance; (4) the source-list is empty and no new node is found; and (5) the new point is outside the image field. In all cases except for vessel crossing, the last valid vessel point is marked as a termination point, and the algorithm starts tracking the other vessel with the seed point placed at the top of the source-list.
The artery segment is a vessel length with two end-points at two nodes, or at an ori-gin point and a node, whereas the artery branch is a distal vessel with a distal point. Either the artery segment or branch is composed of artery elements. Considering these artery elements arranged at intervals (or with“look-ahead distance”) of less than the radius of the sampling disk, polylines are used to connect the artery elements by linear interpolation. The generated polylines are treated as an approximation of vessel center-lines, and have high probability inside the binarized vessel structures.
Results
The proposed algorithm was tested on both simulated images and real image sequences with stenosis vessel and aneurysm. To obtain images with acceptable quality, the cranial and caudal angles, as well as the ray dose, were adjusted so that the X-rays travel a moderate distance. Our vessel tracking algorithm was implemented in MATLAB 7.0 on a Pentium IV PC (with CPU 2.8 G and 512 M memory).
Our algorithm was first tested on various simulated artery vessel images to adjust its parameters. Actual images were used to evaluate the actual performance of the algo-rithm by comparing the algoalgo-rithm-segmented structure and vessel length of the entire artery network with those produced by expert cardiologists. The tracking algorithm has several distinguishing characteristics: (a) it is robust to the starting position detected; (b) it can detect and identify a larger area of the artery tree without any man-ual intervention; and (c) it can accurately distinguish the narrows resulting from the gaps in the vessel feature map or those caused by real vessel stenosis.
In our algorithm, total computational time T consisting of two major components T1,T2, and one minor component T3, were spent on preprocessing (36.7 s), tracking
(15.7 s), and connecting artery elements (1.4 s), respectively.
General effects of vessel segmentation are listed in the first column of Table 1, where the results of right coronary artery (RCA) and the left coronary artery (LCA) in the real angiographic images are compared separately. In Table 1, L∑and L denote the length of algorithm-segmented vessels (in pixels) and the total vessel length delineated by expert cardiologists, respectively. The percentage of the detected artery segments (DAS %) and the extracted vessel length (EVL %), as well as the identification ratio (IR %) of the arterial structure was computed to evaluate the performance of our algo-rithm. In particular, the IR % is defined as the percentage of the correct parts of vessel length in the entire length of algorithm-segmented vessels. As openly reported in lit-erature, the DAS % produced by Haris et al. [16] reached 90%, while the EVL % pro-duced by Schrijver et al. [4] was less than 78%. On average, our algorithm can reach 94.7% for DAS % and 88.1% for EVL %.
Arterial vessel simulation and algorithm evaluation
Simulated data were created for the arterial segment [Figure 6(b)] and the simulated arterial tree (SAT) [Figure 6(c)]. In particular, various levels of Gaussian smoothing were applied to simulate the spatial blurring in an X-ray projection. The SAT in Figure 6(c) was generated to simulate artery characteristics, such as curving, overlapping, and bifurcating. For these simulated images, all information related to vessel segments, cen-terline, and local structure are known beforehand. We can analyze the algorithm char-acteristics given that various levels of white Gaussian are added to these images.
The performance of our algorithm can first be evaluated using the simulated images, such as vessel segments A to F. Given an initial seed point at the left end of the vessel segment in A, B, E, and F of Figure 6(b), the PTO can automatically track vessels and measure their diameters. The measured diameters along the vessel are consistent with varying morphology, such as stenoses and aneurysms. The resulting mean errors are listed in Table 2, whereLx denotes the length of the simulated arterial segment,e0and
eddenote the mean error of the resulting vessel centerlines and diameters, respectively.
Under zero-level Gaussian noise, the mean errors of estimated centerlines and dia-meters of stenosis or aneurysm vessels are no more than 0.02 and 0.04, respectively. In case of close proximity (such as C) and local gap (such as D), the tracking results depend on distance dP between two neighboring vessels and gap-widthwG,
respec-tively. Suppose that r1 andr2, and rDdenote the radii of two neighboring vessels and
the radius of the detector, respectively. To enable the algorithm to operate through the vessel despite influence from the neighboring vessel and the gaps, the limiting distance and gap-width would bedP≥(r1+r2)/2 andwG<rD, respectively. The entire length of
the skeleton lines of the SAT is 948 pixels, and is entirely involved in the testing. The results of structure identification on the SAT and real angiograms are provided in the following sections.
Experiments on structure pattern inferring
Two experiments were performed on simulated and real images to test the capability of our algorithm to infer the structure patterns in the artery tree. The performances
Table 1 Statistical results on artery tracking and structure identification in real angiographic images Images, Num. EVL (%) IR (%)
L¯ L∑ Average identification rate of bifurcation (N¯b/
W¯b,i=3)
Average identification rates
of different patterns (%)
b= 1 b = 2 b = 3 b = 4 b = 5 Total i= 1 i= 2 i= 3 i= 4
SAT, 1 99.8 99.6 950 948 1/1 2/2 2/2 3/4 0/0 8/9 100 100 88.9 75
LCA, 128 87.2 98.3 1868 1629 1.00/ 1.00 2.00/ 2.00 7.11/ 7.22 5.13/ 6.12 0.32/ 1.34 15.56/ 17.68
98.9 98.7 88.0 72.8
RCA, 32 91.7 99.1 947 868 1.00/ 1.00 3.10/ 3.15 2.65/ 2.70 0.30/ 0.33 0.01/ 0.02 7.05/ 7.20
98.3 99.5 97.9 77.5
Mean 88.1 98.5 1677 1477 1.00/ 1.00 (100%) 2.22/ 2.23 (99.6%) 6.22/ 6.32 (98.4%) 4.16/ 4.96 (83.9%) 0.26/ 1.08 (24.1%) 13.86/ 15.58 (89.0%)
98.8 98.9 90.0 73.7
Note:L∑and L¯ denote the length of algorithm-segmented vessels and the total vessel length, respectively.Nb/Wb
denotes the rate of bifurcation identification., whereNb
denotes the number of correctly detected bifurcations for the
b-th level vessel branch, whileWb
Figure 6The simulations of arterial vessels: (a) the local coordinate system of vessel simulation; (b) the simulated arterial segments; (c) the SAT.
Table 2 Parameters and mean errors in testing of the phantoms of arterial segments
A B C D E F
SV 1 1 1 1 1 1
SB 0 0 0 0 0 0
sB 3.2 3.2 3.2 3.2 4.0 3.2
Lm 13 13 13, 6 13 9 15
Lr 13 5 13, 6 13 18 10
Lx 120 120 120, 125 120 120 120
sw 0 0 0 0 0 0
e0 0.01 0.01 0.01,0.02 0.01 0.02 0.02
on identification of all four different patterns, as well as separate performances on the detection of bifurcation are reported.
The first experiment was conducted on the SAT image. Based on results of estimated membership degrees Ji(Xt) in Eqs. (13) and (14), the attributes of all interesting points in Figure 6(c) can be well characterized by our algorithm. Overall, the captured membership degrees corresponded well to four different structure patterns, such as the membership degree distribution between N1-N4 in Figure 7. For vessel overlapping cases, such as local superposition between the two vessel segments N2-N4-N5-D and N1-N4-N5-C, the structure ambiguity (between N4and N5) might be difficult to resolve using only a single-view projection, although it might be resolved by observing vessel motion or radius information from sequence images as done by human obser-vers while reading cine-angiograms. In short, our multi-feature based fuzzy inferring method is capable of accurately estimating the structure patterns from 2D images.
The second experiment was performed on actual angiogram images selected from the angiogram sequences. The related results are provided in the second and third col-umns of Table 1. The lower level of the arterial structure can be inferred with higher IR %, and the recognizable vessels can reach up to the fifth level at best. In practice, the cardiovascular surgeon is often interested in the vessels below the fourth level; thus, the performance of our algorithm is promising. The second column of Table 1 also displays the rate of bifurcation identification (Nb/Wb). Here,Nbdenotes the num-ber of correctly detected bifurcations for theb-th level vessel branch, whileWb(≥Nb) denotes the total number of the detected bifurcations, including the incorrectly detected ones.
Experiments on vessel tracking and measurement
We also evaluated the respective contributions of the probability terms of the continu-ity properties given in Eq. (6) to the vessel tracking. By rewriting Eq. (8) as
x∧t+1= f q( ,qZ,qd), three different types of PTO, namely, x
∧
+ =
t 1 f q( ), x∧t+1= f q( ,qZ), and x
∧
+ =
t 1 f q( ,qZ,qd), can be constructed. Their respective results are compared in Figure 8, where the paths traced in the same sub-image were obtained by the same PTO. Figures 8(b1) and 8(b2) show that the direction constraint term in Eq. (6.2) can effectively compel the sampling disk and the pattern detector to move ahead, but it can often be lost in edges, pseudo contours, neighboring vessels, or
even noise. By incorporating the vessel feature term, that is, using x∧t+ =
Z f q q 1 ( , ), the vessel tracking result can be improved, as shown in Figures 8(c1) and 8(c2). Using all terms together, that is, using x∧t+ =
Z d f q q q
1 ( , , ), the vessel tracking result can be further improved; this is reflected as the smooth and accurate tracking paths detected in Figures 8(d1) and 8(d2). In addition, if only the vessel feature or diameter term is used, the tracking model almost stops near the initial seed position. These visual results are not shown here.
Figures 8(c1) and 8(c2) also yield a typical case in which the algorithm can success-fully manage the close proximity or crossing of vessels, as well as varying vessel curva-tures, which validates a number of attractive characteristics of the PTO. For example, the algorithm can run across the local vessel gap, proceed along the current vessel branch in spite of crossing, and successfully manage arterial stenoses and aneurysms.
Thediameterestimation errors at the artery elements are less than 0.23 pixels on aver-age. The results of the axis line estimation along the artery segments in the SAT image indicate that more errors appear near the nodes, with 1.36 pixels on average. These results show that the axis line estimation error at the nodes is controlled within a limited extent. For actual angiograms, we compared the automatically extracted arterial axis lines with the standard arterial centerlines delineated by an expert cardiologist. We also obtained good results, with a mean error of 0.17 pixels and the maximum error close to half of the respective vessel radius. These errors are produced by noise, as well as large curvatures or abnormal morphologies at the locations of vessel nodes.
Vessel stenosis
We tested a simple method to determine the position and severity of coronary artery stenosis in the given images, which can be used as an additional evaluation criterion for our tracking algorithm. Our algorithm was able to detect the arterial stenosis. An exam-ple in which the diameter of arterial stenosis is tracked and measured is shown in Figure 9. According to stenosis evaluation using the grading scheme of the visual analysis of the American Heart Association [17], %-LENGTH stenosis is estimated as %-LENGTH stenosis = (1-Lr/Lm) × 100%, whereLrandLmare the estimates of the minimal diameter
of the stenotic part of a vessel and the mean diameter of the nonstenotic part,
Figure 8Comparison of the results of vessel-tracking using the PTO based on different continuity terms. (a1) & (a2) two original images. (b1) & (b2) using the PTO simply based onqθ. (c1) & (c2) using the PTO based onqθandqz. (d1) & (d2), using the PTO based on complete terms. (e1) & (e2), measuring the
respectively. During tracking and detection, the vessel length of interest begins or termi-nates when %-LENGTH is 25% higher or lower than the minimum classified value. The vessel length of interest can be described by the rectangular sash in Figure 9.
In the testing, 35 angiograms with 40 stenosis positions were used to evaluate the correctness of stenosis identification, in which all the standard vessel stenoses, as well as their severities were provided beforehand by the expert cardiologist. As a result, 33 stenosis objects are correctly detected and the number of false negatives and false posi-tives are seven and one, respectively. The average correctness rate of stenosis severity identification reaches 68.3%, in comparison with the given stenosis severity levels.
Discussion
In this paper, we analyzed image data and vessel structures within X-ray projections. A structure distinction exists between the crossing and bifurcation of vessel segments. Two crossing vessel segments have no spatial structure connection, whereas vessel bifurcations (which in general produce three vessel segments) have a structural con-nection among them. Vessel bifurcation enables low-level vessel segment separation to two high-level ones at the bifurcation point where these vessel segments have different features in their diameters and direction continuity. However, in single-view X-ray pro-jection, two spatial overlapping vessel segments may appear connected to each other at a crossing-point, where the vessel segments maintain their respective features of dia-meter and direction continuity near the point. The abovementioned vessel continuity of different cases can address, in part, 2D structure ambiguity.
In our algorithm, three parameters can be adjusted to achieve better segmentation results. These include threshold value rlin the vessel function Eq. (2), the radius of sampling disk rS, and the radius of pattern detector rD. These parameters can be
adjusted according to the overall performance integrated from the three percentages, DAS %, EVL %, and IR %. For instance, parameter rlmay be optimized according to
lim
r r
DAS r EVL r IR r
r DAS r EVL r IR
→
+ +
⋅ + +
’
( ) ( ) ( )
( ( ) ( ) (
Δ Δ Δ
Δ rr))→0
The optimization for parameters rS andrD can be conducted similarly. Using the
simulated images with different levels of noise, we can determine the optimal values for these three parameters. In the absence of noise,rlis computed as r = − 2f ; parameters rS and rD turn out to be equal, that is, rS = rD, and are both equal to
current diameter dtof the vessel under tracking.
In the experiments, the time spent in tracking depends on the length of the detected vessel, look-ahead distance st, and vessel diameterdt. Look-ahead distancestis
deter-mined by the diameter of the sampling disk, which is designed to vary with the dia-meter of current vesseldt. The ranges of these parameters are 1≤st≤7 (pixels) and 3 ≤dt≤15 (pixels), respectively, which agree with the required relationship 1≤st≤dt/2.
Similarly, more artery elements can result in more computational time.
The rate of bifurcation identification (Nb/Wb) in the second column of Table 1 is related to EVL % and independent of IR % because the IR% is calculated only by the detected vessel points. In addition, the IR % of bifurcation and crossing are relatively lower than that of other structure patterns, which is mostly caused by the structure ambiguity in the 2D image acquisition. According to the testing on SAT, the error ratio is correlated with the effects of image noise and the diameter of the detector.
Based on the results on 40 stenosis objects, the application for the diagnosis of ste-nosis severity levels do not appear to be very reliable because of the use of single-view projection images. The accurate quantification and analysis of stenotic lesions is actu-ally very complicated and has been elaborately discussed by Sato et al. in [18]. The importance of designing an acquisition system for acquiring“good”images, in which stenotic lesions can be displayed clearly, rather than simply analyzing the given images by common clinic systems, is therefore important.
Conclusions
We developed a vessel tracking framework for the segmentation and measurement of the arterial tree in angiographic images, and applied it to actual clinical data. Based on the var-ious evaluation results using both simulated and actual data, our algorithm demonstrates a very impressive performance in tracking and measuring artery trees. The particular advan-tages include efficient handling of vessel nodes, such as bifurcation or crossing; distin-guishing between bifurcations and crossings, and automatically locating their positions; and automatic adaptation to varying vessel diameters in the coronary artery. These advan-tages were made clear with the introduction of our tracking strategies.
Acknowledgements
This work was partly supported by the National Basic Research Program of China (Grant No. 2010CB732505) and the National Science Foundation of China (Project No. 60772120, and Project No. 60902103). We would like to thank the Cardiac Center of Beijing Chaoyang Hospital and the Radiology Department of Tianjin General Hospital for clinical assistance and providing coronary angiogram data.
Author details
1
School of Biomedical Engineering, Southern Medical University, Guangzhou, 510515, China.2Department of Optic electronics engineering, Beijing institute of technology, Beijing, 100081, China.
Authors’contributions
ZS carried out the studies on image pre-processing, modeling of vascular structure inferring and tracking, and drafting the manuscript. CW conceived of the study, and participated in its design and coordination, and helped in the drafting of the manuscript. YJ carried out the data acquisition and simulated the coronary artery tree. WY checked the paper writing. All authors read and approved the final manuscript.
Competing interests
The authors declare that they have no competing interests.
Received: 16 February 2010 Accepted: 20 August 2010 Published: 20 August 2010
References
1. Kawarada O, Yokoi Y, Morioka N, Nakata S, Higashiue S, Mori T, Iwahashi M, Hatada A:Carotid stenosis and peripheral artery disease in Japanese patients with coronary artery disease undergoing coronary artery bypass grafting.Circ J 2003,67:1003-1006.
2. Jian Y, Yongtian W, Yue L, Songyuan T, Wufan C:Novel Approach for 3-D Reconstruction of Coronary Arteries From Two Uncalibrated Angiographic Images.IEEE Trans Image Process2009,18(7):1563-1572.
3. Kirbas C, Quek FKH:A review of vessel extraction techniques and algorithms.ACM Comput Surv2004,36(2):81-121. 4. Schrijver M, Slump CH:Automatic segmentation of the coronary artery tree in angiographic projections.Proceedings
of ProRISC2002, 449-464.
5. Behrens T, Rohr K, Stiehl HS:Robust segmentation of tubular structures in 3-D medical images by parametric object detection and tracking.IEEE Transactions on Systems, Man, and Cybernetics - Part B, Cybernetics2003,33(4):554-561. 6. Olabarriaga SD, Breeuwer M, Niessen WJ:Minimum cost path algorithm for coronary artery central axis tracking in
CT images.In proceedings of MICCAI2003,2879:687-694, LNCS.
7. Al-Kofahi KA, Can A, Lasek S, Szarowski DH, Dowell-Mesfin N, Shain W, Turner JN, Roysam B:Median-based robust algorithms for tracing neurons from noisy confocal microscope images.IEEE Trans Inf Technol Biomed2003,
7(4):302-17.
8. Wink O, Niessen WJ, Viergever MA:Multiscale vessel tracking.IEEE Trans Med Imaging2004,23(1):130-133. 9. Tolias YA, Panas SM:A fuzzy vessel tracing algorithm for retinal images based on fuzzy clustering.IEEE Trans Med
Imaging1998,17(2):263-273.
10. Lorenz C, Carlsen I-C, Buzug TM, Fassnacht C, Weese J:Multi-scale line segmentation with automatic estimation of width, contrast and tangential direction in 2-D and 3-D medical images.CVRMED-MRCAS’971997,1205:233-242. 11. Sato Y, Nakajima S, Shiraga N, Atsumi H, Yoshida S, Koller T, Gerig G, Kikinis R:3D multi-scale line filter for
segmentation and visualization of curvilinear structures in medical images.Medical Image Analysis1998,
2(2):143-168.
12. Frangi AF, Niessen WJ, Vincken KL, Viergever MA:Multiscale vessel enhancement filtering.Medical Image Computing and Computer-Assisted Intervention - MICCAI’981998,1496:130-137.
13. Krissian K, Malandain G, Ayache N, Vaillant R, Trousset Y:Model based detection of tubular structures in 3-D images. Computer Vision and Image Understanding archive2000,80:130-171.
14. Moreno P, Bernardino A, Santos-Victor J:Model based selection and classification of local features for recognition using Gabor filters.Lecture Notes in Computer Science, Image Analysis and Recognition2006,4142:181-192. 15. Moreno P, Bernardino A, Santos-Victor J:Gabor parameter selection for local feature detection.Lecture Notes in
Computer Science, Pattern Recognition and Image Analysis2005,3522:11-19.
16. Haris K, Efstratiadis SN, Maglaveras N, Pappas C, Gourassas J, Louridas G:Model-based morphological segmentation and labeling of coronary angiograms.IEEE Trans Med Imaging1999,18(10):1003-1015.
17. Austen WG, Edwards JE, Frye RL, Gensini GG, Gott VL, Griffith LS, McGoon DC, Murphy ML, Roe BB:A reporting system on patients evaluated for coronary artery disease.Circulation1975,51(4):5-40.
18. Sato Y, Araki T, Hanayama M, Naito H, Tamura S:A viewpoint determination system for stenosis diagnosis and quantification in coronary angiographic image acquisition.IEEE Trans Med Imaging1998,17(1):121-137.
doi:10.1186/1475-925X-9-40