www.ann-geophys.net/30/811/2012/ doi:10.5194/angeo-30-811-2012
© Author(s) 2012. CC Attribution 3.0 License.
Annales
Geophysicae
On the role of ozone in long-term trends in the upper
atmosphere-ionosphere system
J. Laˇstoviˇcka
Institute of Atmospheric Physics ASCR, Bocni II, 14131 Prague, Czech Republic
Correspondence to: J. Laˇstoviˇcka ([email protected])
Received: 6 December 2011 – Revised: 9 March 2012 – Accepted: 5 April 2012 – Published: 8 May 2012
Abstract. Origin of long-term trends in the thermosphere-ionosphere system has been discussed since the beginning of trend studies. The two most prioritized explanations have been those via long-term increase of atmospheric concentra-tion of greenhouse gases and long-term increase of geomag-netic activity throughout the 20th century. Secular changes of the Earth’s main magnetic field play an important role in trends in a limited region. Recently, Walsh and Oliver (2011) suggested that the long-term cooling of the upper thermo-sphere (above 200 km) may be due largely to the strato-spheric ozone depletion. Here, we show that the role of ozone is very important in the mesosphere and lower thermosphere but not in the upper thermosphere. The suggestion of Walsh and Oliver (2011) is based on historical (before 1988) data from Saint-Santin radar, whereas more recent data do not support their conclusion.
Keywords. Ionosphere (Ionosphere-atmosphere interac-tions; Mid-latitude ionosphere)
1 Introduction
The primary driver of long-term trends in the upper atmo-sphere (mesoatmo-sphere and thermoatmo-sphere) and ionoatmo-sphere is predominantly considered to be the increasing concentration of greenhouse gases, particularly of CO2, e.g. Laˇstoviˇcka et
al. (2006a). However, there are also other drivers of trends that play an important role, like long-term changes of geo-magnetic activity, secular changes of the Earth’s geo-magnetic field, probably long-term changes of activity of atmospheric waves coming from below, and in the mesosphere and lower thermosphere and related part of the ionosphere long-term changes of (stratospheric) ozone concentration (e.g. reviews by Laˇstoviˇcka, 2009, or Qian et al., 2011). In order to
elim-inate strong effect of the solar cycle on calculated trends, data are corrected for solar activity and, therefore, long-term changes of solar activity cannot affect the reported long-term trends in the thermosphere and ionosphere.
There had been some discussions whether carbon diox-ide or geomagnetic activity is the leading trend driver in the ionosphere. Probably the geomagnetic activity was dominant in the past, whereas now the greenhouse gases (i.e. carbon dioxide) are the main trend driver (e.g. Laˇstoviˇcka, 2009; Qian et al., 2011). Recently, Walsh and Oliver (2011) came to conclusion that the long-term cooling of the thermosphere may be due largely to the stratospheric ozone depletion, and the greenhouse cooling may well not be detectable with cur-rent data sets. This conclusion is based mainly (even though not only) on analysis of the limited (even though very valu-able) data set of ion temperature measurements by the Saint-Santin incoherent scatter radar, in France, from heights of about 200–500 km. The purpose of our short contribution is to show that Walsh and Oliver (2011) overestimate the role of ozone due to limited data set used, and that even if ozone may play some role, other trend drivers, including the increas-ing concentration of greenhouse gases dominate over ozone in driving trends at thermospheric altitudes of about 200– 500 km, studied by Walsh and Oliver (2011). Ozone seems to play a very important but not dominant role in trends in the mesosphere and lower thermosphere (MLT region) (e.g. Laˇstoviˇcka, 2009; Qian et al., 2011).
2 Evidence on the role of ozone in the MLT region
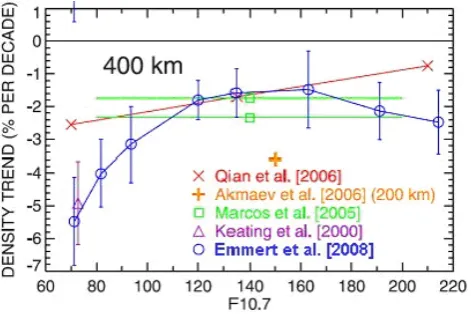
Fig. 1. Summary of various observational (Keating et al., 2000;
Marcos et al., 2005; Emmert et al., 2008) and model (Akmaev et al., 2006; Qian et al., 2006) results on long-term trends in the ther-mospheric neutral density. Adopted from Emmert et al. (2008).
the maximum effect of stratospheric ozone depletion, which amplifies greenhouse thermal contraction of the upper at-mosphere, at heights near 110 km, i.e. in the lower sphere, and it seems to be detectable well into the thermo-sphere. This model probably somewhat overestimates trends in atmospheric density, since it provides at 200 km remark-ably stronger trend in density than observations (Fig. 1), but the existence of some influence of ozone is indisputable.
The altitude 110 km corresponds to maximum of the iono-spheric E-region. Therefore, trends in the E-region critical frequency foE, which corresponds to the maximum E-region electron density, should be affected by trends in ozone. Bre-mer and Peters (2008) showed that the longitudinal variations of deviations of foE trends and total ozone trends from zonal mean trends (ionosondes and ERA-40 in 30–75◦N) reveal very good anti-correlation, both for winter and summer with a slight phase shift. This effect, which is more pronounced in winter, is evidence of ozone influence on E-region trends.
At lower heights in the ionosphere, an analysis of long-term variations of the low frequency reflection height near 81 km and the total ozone content from Arosa revealed sim-ilarity in trends in the sense that, in the period of the mid-latitude ozone decrease of 1980–1995, the trend in reflec-tion heights was steeper (Bremer and Peters, 2008). Un-fortunately, there is very limited observational information about trends in ozone concentration in the mesosphere and mesopause region, which also could affect trends in the MLT region. However, nothing like stratospheric ozone depletion is expected to occur in the mesosphere, and effect of meso-spheric ozone changes on MLT region trends is probably less important.
The role of stratospheric ozone in long-term trends in the mesosphere, lower thermosphere and E-region ionosphere is crucial. Midlatitude stratospheric O3concentration has been
decreasing since about 1979–1980, with a turnaround of the
trend at about 1995–1997 at northern middle latitudes (e.g. Harris et al., 2008) and later also in other regions. Thus, at present the ozone changes affect trends in a way opposite to that in the 1980s. This should result in some modification of trends, e.g. in mesospheric and mesopause region temper-atures and as observations document, this is the case (e.g. Qian et al., 2011; Beig, 2011). Berger and L¨ubken (2011) confirmed substantial modification of mesospheric tempera-ture trends by ozone. They are the first authors who success-fully simulated, by model LIMA, not only qualitatively but even quantitatively the change of temperature trends at 50 km (∼stratopause) from negative to none or slightly positive af-ter 1997. They attributed this change of temperature trend to the upper stratospheric ozone behaviour.
Summarizing, we may say that stratospheric ozone changes play a very important role in long-term trends in the MLT region, even though the dominant role is still played by greenhouse gases (essentially CO2), except for stratopause
and maybe lower mesosphere temperature in periods of dra-matic changes of ozone concentration, when the ozone influ-ence appears to be dominant.
3 Ozone effect on the upper thermosphere and F-region ionosphere
How is it possible, with influence of ozone changes in the up-per thermosphere and F-region ionosphere, to have altitudes of about 200–400 (500) km? At the F1 region maximum al-titudes near 200 km, no relation between longitudinal depen-dence trends in foF1 and total ozone has been observed (Bre-mer, 2008), contrary to that observed in the E-region. This illustrates decreasing role of ozone with increasing height in the ionosphere above the E-region maximum, in accord with decreasing role of ozone trends in thermospheric den-sity trends with increasing height, as simulated by Akmaev et al. (2006).
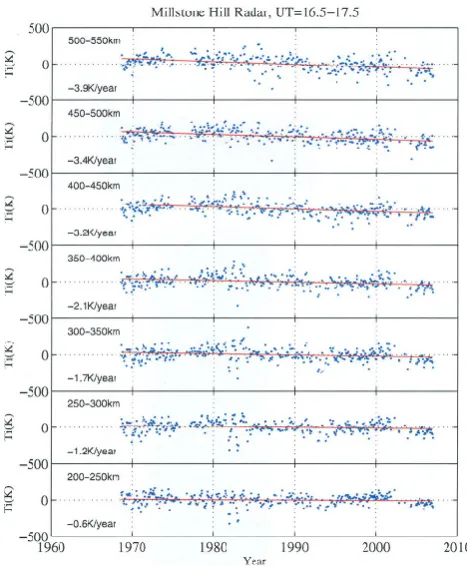
Walsh and Oliver (2011) used a data set of ion temper-ature measurements by the Saint-Santin incoherent scatter radar, in France, from heights of about 200–500 km. These data, which cover the period 1966–1987, reveal a weak (if any) negative trend before 1979 and much stronger nega-tive trend after 1979/1980. This breakpoint coincides with breakpoint in the northern midlatitude ozone trend (e.g. Har-ris et al., 2008). Unfortunately, the Saint-Santin data set does not cover the other northern midlatitude breakpoint in 1995– 1997, when the northern midlatitude ozone trend turned to opposite. However, another midlatitude incoherent scatter radar is located at Millstone Hill, and its data cover the period 1968–2006 including both breakpoints.
slightly weaker but with much smoother height profile com-pared to Saint-Santin. These trends are shown for the F-region in Fig. 2. Zhang et al. (2011) found also the first break-point but slightly later, in the early 1980s, but scatter of data does not allow more accurate determination than somewhere between 1981–1984 (Fig. 2). However, when the ozone trend turned to an opposite one in the mid-1990, such a change did not happen in the ion temperature trend. This trend was for the period 1995–2006, again negative and almost doubled compared with the 1968–2006 trend (Zhang et al., 2011); the mid-1990s breakpoint is undetectable in ion temperature data, in spite of a larger change of ozone trends than in 1979– 1980. This finding strongly supports the greenhouse origin and opposes the ozone origin of ion temperature trends.
Walsh and Oliver (2011) showed that for Saint-Santin the trends were much stronger in daytime than in nighttime; they used this finding as evidence supporting predominantly ozone origin of trends. Millstone Hill trends have been stud-ied only for noontime; calculations for other local times are under way. Zhang et al. (2011) found different values of ion temperature for summer and winter, but no difference between summer and winter temperature trends. They also found stronger cooling trends under solar cycle minimum conditions, which is consistent with behaviour of trends in thermospheric density and with larger relative role of CO2
versus NO in radiative cooling of the thermosphere during solar minimum; this finding supports dominant greenhouse, not ozone origin of trends. Zhang et al. (2011) claim that their trends generally agree with expected response to increasing concentration of greenhouse gases.
Walsh and Oliver (2011) referred to Danilov (2009), who found that the correlation between daytime and nighttime values of foF2 showed a clear change in trend (from no trend to a systematic trend) in the vicinity of 1980. In other pub-lications Danilov found similar change of trends at about 1980 in other properties of foF2 and hmF2. However, af-ter adding data from the late 1980s and 2000s (until 2005– 2007), Danilov (2011) came to conclusion that in the early 2000s this behavior is violated and no more observed in re-cent years. However, no change related to ozone breakpoint in the mid-1990s has been observed.
[image:3.595.309.543.61.345.2]Well-established trends appear to be in thermospheric den-sities at heights of 200–600 km, where observational and model trends fairly well agree even quantitatively (e.g. Em-mert et al., 2008). They are based on analysis of long-time series of atmospheric drag of many space objects. Saun-ders et al. (2011) analyzed a smaller data set (41 satellites) with a method different from that of Emmert et al. (2008) and obtained density trends similar to that of Emmert et al. They also calculated the ratio of the observed densities to the model NRLMSISE-00 densities (model driven by solar in-put, no trend included), shown in Fig. 3. This ratio revealed a negative trend as expected and a pronounced decrease in the last extreme solar minimum but no “ozone” breakpoints around 1980 or mid-1990s. Solomon et al. (2010) confirmed
Fig. 2. Ion temperature (Ti) data and trend at various heights in the
F-region above 200 km. The data points are a result after removing terms of background, F10.7, and ap. The red line is fit to data points to give the long-term trend value (marked at the bottom left corner in each panel). Adopted from Zhang et al. (2011).
that the density depletion in the last solar minimum was caused by unusually low decrease of solar extreme ultravi-olet radiation. This decrease is not captured by solar indices and, therefore, model values are higher than observed values and a decrease of ratio is observed.
Fig. 3. Observed NRLMSISE-00 density ratios within the altitude bins of 400 and 520 km, 1970–2009. Adopted from Saunders et al. (2011).
Fig. 4. Global average log-density residuals at 400 km, annual
(cir-cles) and daily values as a function of time, 1967–2007. Linear trend is shown. (a) Ratio of observed density to NLRMSISE-00. (b) Ra-tio of observed density to model GAMDM. Adopted from Emmert et al. (2008).
4 Discussion and conclusions
Over the whole period of studies of long-term trends in the mesosphere-thermosphere-ionosphere system discus-sions and controversies on origin/main driver of observed trends have been continuing. In the past the two most prior-itized explanations were those via long-term increase of at-mospheric concentration of greenhouse gases and long-term increase of geomagnetic activity throughout the 20th century (e.g. Laˇstoviˇcka, 2009). In a few regions, particularly in the low latitude Southern America, an important role has also been played by secular changes of the Earth’s main magnetic field (e.g. Qian et al., 2011). Noctilucent clouds may be af-fected by long-term changes of mesospheric water vapour concentration, of which not much is known. Quite recently, Walsh and Oliver (2011) argued for the dominant role of stratospheric ozone changes in trends in the upper thermo-sphere and upper ionothermo-sphere.
The absence of the second breakpoint in the thermospheric density data as well as in ion temperature data excludes the stratospheric ozone changes as possible driver of trends in the upper thermosphere and upper ionosphere. The stratospheric ozone changes are of high importance for trends at MLT re-gion heights, and in this rere-gion the second “ozone” break-point is well pronounced. Saint-Santin measurements termi-nated in 1987; therefore, Walsh and Oliver (2011) could not investigate behaviour of ion temperatures around the mid-1990s ozone breakpoint. Their conclusion on primary role of ozone in trends at upper thermospheric heights based on lim-ited data set was logical, but more recent data show that it is not the case.
[image:4.595.50.286.300.589.2]found a breakpoint in the semidiurnal tide in the mesopause region winds at higher middle latitudes near 1980. Data on foE, presented by Bremer and Peters (2008), allow interpre-tation with a breakpoint near 1980, as well. However, Port-nyagin et al. (2006) and Merzlyakov et al. (2009) showed that the prevailing wind and semidiurnal tide in the mesopause region in the midlatitude Northern Hemisphere as well as in Antarctica changed the trend (mostly to opposite one) near 1990. Laˇstoviˇcka et al. (2010) found trend breakpoint in ∼1990 for stratospheric winds and foE at the same latitudes where it was found for mesopause region winds. However, this change around 1990 happened neither in ozone (break-point 1995–1997), nor in thermospheric density or ion tem-perature. Thus, the more recent breakpoint in winds (which are closely related to atmospheric wave activity) is not re-flected in thermospheric/ionospheric trends, which makes as-sumption of wind/atmospheric wave activity as the origin of ionospheric trend change near 1980 questionable. Further in-vestigations are necessary.
In conclusion we may say that changes in the stratospheric ozone concentration play a very important role in long-term trends in the mesosphere and lower thermosphere, but the long-term trends in the upper thermosphere and the F-region ionosphere are dominated by other trend drivers, at present probably mainly by the increasing concentration of green-house gases (carbon dioxide) with little role of ozone, if any. In the past the ionospheric trends were probably dominated by long-term changes in geomagnetic activity (e.g. reviews by Laˇstoviˇcka, 2009, or Qian et al., 2011).
Last but not least, it is necessary to mention that ozone changes are very important for trends at decadal time scale but essentially unimportant at centennial time scale. One hundred years after the beginning of anthropogenic ozone de-cline, the stratospheric ozone will very probably be recovered or at midlatitudes even over-recovered due to greenhouse ef-fect; thus, the overall impact of ozone changes on trends at centennial time scale will be essentially none, compared to effect of greenhouse gases.
Acknowledgements. This work was supported through grant P209/10/1792 from the Grant Agency of the Czech Republic.
Editor-in-Chief M. Pinnock thanks two anonymous referees for their help in evaluating this paper.
References
Akmaev, R. A., Fomichev, V. I., and Zhu, X.: Impact of middle-atmospheric composition changes on greenhouse cooling in the upper atmosphere, J. Atmos. Solar-Terr. Phys., 68, 1879–1889, doi:10.1016/j.jastp.2006.03.008, 2006.
Beig, G.: Long-term trends in the temperature of the meso-sphere/lower thermosphere region: 1. Anthropogenic influences, J. Geophys. Res., 116, A00H11, doi:10.1029/2011JA016646, 2011.
Berger, U. and L¨ubken, F.-J.: Mesospheric temperature trends at mid-latitudes in summer, Geophys. Res. Lett., 38, L22804, doi:10.1029/2011GL049528, 2011.
Bremer, J.: Long-term trends in the ionospheric E and F1 re-gions, Ann. Geophys., 26, 1189–1197, doi:10.5194/angeo-26-1189-2008, 2008.
Bremer, J. and Peters, D.: Influence of stratospheric ozone changes on long-term trends in the meso- and lower thermosphere, J. Atmos. Solar-Terr. Phys., 70, 1473–1481, doi:10.1016/j.jastp.2008.03.024, 2008.
Danilov, A. D.: Critical frequency foF2 as an indicator of trends on thermospheric dynamics, J. Atmos. Solar-Terr.Phys., 71, 1430– 1440, 2009.
Danilov, A. D.: Variations in foF2 and hmF2 at the end of the 1990s and the beginning of the 2000s, Geomagn. Aeron., 51, 321–328, 2011.
Donaldson, J. K., Wellman, T. J., and Oliver, W. L.: Long-term change in thermospheric temperature above Saint Santin, J. Geo-phys. Res., 115, A11305, doi:10.1029/2010JA015346, 2010. Emmert, J. T., Picone, J. M., and Meier, R. R.: Thermospheric
global average density trends 1967–2007, derived from orbits of 5000 near-Earth objects, Geophys. Res. Lett., 35, L05101, doi:10.1029/2007GL032809, 2008.
Harris, N. R. P., Kyr¨o, E., Staehelin, J., Brunner, D., Andersen, S.-B., Godin-Beekmann, S., Dhomse, S., Hadjinicolaou, P., Hansen, G., Isaksen, I., Jrrar, A., Karpetchko, A., Kivi, R., Knudsen, B., Krizan, P., Lastovicka, J., Maeder, J., Orsolini, Y., Pyle, J. A., Rex, M., Vanicek, K., Weber, M., Wohltmann, I., Zanis, P., and Zerefos, C.: Ozone trends at northern mid- and high lati-tudes – a European perspective, Ann. Geophys., 26, 1207–1220, doi:10.5194/angeo-26-1207-2008, 2008.
Keating, G. M., Tolson, R. H., and Bradford, M. S.: Evidence of long term global decline in the Earth’s thermospheric densities apparently related to anthropogenic effects, Geophys. Res. Lett., 27, 1523–1526, 2000.
Laˇstoviˇcka, J.: Global pattern of trends in the upper atmosphere and ionosphere: Recent progress, J. Atmos. Solar-Terr. Phys., 71, 1514–1528, doi:10.1016/j.jastp.2009.01.010, 2009.
Laˇstoviˇcka, J., Akmaev, R. A., Beig, G., Bremer, J., and Emmert, J. T.: Global change in the upper atmosphere, Science, 314, 1253– 1254, 2006a.
Laˇstoviˇcka, J., Mikhailov, A. V., Ulich, Th., Bremer, J., Elias, A. G., Ortiz de Adler, N., Jara, V., Abarca del Rio, R., Foppiano, A. J., Ovalle, E., and Danilov, A. D.: Long-term trends in foF2: A comparison of various methods, J. Atmos. Solar-Terr. Phys., 68, 1854–1870, 2006b.
Laˇstoviˇcka, J., Krizan, P., and Kozubek, M.: Long-term trends in the middle atmosphere dynamics at northern middle latitudes – one regime or two different regimes?, Atmos. Chem. Phys. Discuss., 10, 2633–2668, doi:10.5194/acpd-10-2633-2010, 2010. Marcos, F. A., Wise, J. O., Kendra, M. J., Grossbard, N. J.,
and Bowman, B. R.: Detection of long-term decrease in ther-mospheric neutral density, Geophys. Res. Lett., 32, L04103, doi:10.1029/2004GL021269, 2005.
Portnyagin, Yu. I., Merzlyakov, E. G., Solovjova, T. V., Jacobi, Ch., K¨urschner, D., Manson, A., and Meek, C.: Long-term trends and year-to-year variability of mid-latitude mesosphere/lower ther-mosphere winds, J. Atmos. Solar-Terr. Phys., 68, 1890–1901, doi:10.1016/j.jastp.2006.04.004, 2006.
Qian, L., Roble, R. G., Solomon, S. C., and Kane, T. J.: Calcu-lated and observed climate change in the thermosphere, and a prediction for solar cycle 24, Geophys. Res. Lett., 33, L23705, doi:10.1029/2006GL027185, 2006.
Qian, L., Laˇstoviˇcka, J., Solomon, S. C., and Roble, R. G.: Progress in observations and simulations of global change in the upper atmosphere, J. Geophys. Res., 116, A00H03, doi:10.1029/2010JA016317, 2011.
Saunders, A., Lewis, H., and Swinerd, G.: Further evidence of long-term thermospheric density change using a new method of satellite ballistic coefficient estimation, J. Geophys. Res., 116, A00H10, doi:10.1029/2010JA016358, 2011.
Solomon, S. C., Woods, T. N., Didkovsky, L. V., Emmert, J. T., and Qian, L.: Anomalously low extreme-ultraviolet irradiance and thermospheric density during solar minimum, Geophys. Res. Lett., 37, L16103, doi:10.1029/2010GL044468, 2010.
Walsh, P. L. and Oliver, W. L.: Is thermospheric long-term cool-ing due to CO2 or O3?, Ann. Geophys., 29, 1779–1782,
doi:10.5194/angeo-29-1779-2011, 2011.