Available Online at www.ijpret.com
60
INTERNATIONAL JOURNAL OF PURE AND
APPLIED RESEARCH IN ENGINEERING AND
TECHNOLOGY
A PATH FOR HORIZING YOUR INNOVATIVE WORK
SOFT CORE FPGA PLATFORM FOR BLOOD GLUCOSE MEASUREMENT
J. S. PARAB, R. S. GAD, G. M. NAIK
Electronics Department, Goa University, Talegao Plateau, Goa. Accepted Date: 27/02/2014 ; Published Date: 01/05/2014
\
Abstract:The authors in this article have highlighted the novel soft core FPGA based digital spectrophotometer system for glucose measurement non -invasively. Authors selected the NIR region for glucose prediction since glucose shows good spectral signatures in this region. Before testing the designed system on human tissue we have developed an practical model which resembles the actual human tissues spectra having shown in figure 2 by mixing the proportions of 5 variants normally interfere with glucose. 13 calibration samples were prepared by carefully weighing masses and mixing the 5 variants in different proportion as found in normal human tissue. The spectra's were recorded on spectrophotometer. The most common materials used in FTIR spectrophotometer as sample accessories are NaCl that are hygroscopic and therefore ill-suited for use in connection with aqueous solutions. Hence we have designed an novel multi reflector mirror system for Schimatzu FTIR 8400 having the spectral range from 400-5000 cm-1 to direct the sample beam towards the prepared chemical human tissue (later will be replaced with Actual human tissue: Hand or Finger) and scattered light is then collected by another mirror inclined at 45 degress and directed towards the detector of FTIR. The detected spectra’s are then passed through an Partial Least square regression (PLSR) technique running on FPGA platform to estimate the concentration of glucose in human blood.
Keywords: Biomedical instrumentation, non-invasive, soft-core, Glucose Analysis, PLSR.
Corresponding Author: J. S. PARAB
Access Online On:
www.ijpret.com
How to Cite This Article:
Available Online at www.ijpret.com
61 INTRODUCTION
Over the last century, human behavior and lifestyle have changed, resulting in a dramatic increase of diabetes over the world. Diabetes itself may not be a serious disease but the long-term complications associated with the disease like eye damage which leads to blindness, kidney damage, loss of feeling in the extremities, nerve damage, slow healing of wounds, amputations of toes, feet or legs; and often most seriously cardiovascular disease. Because of the demand for glucose monitoring due to the surge of the ‘diabetes’ disease, many technological players put their efforts to design a user friendly module either in invasive or non-invasive mode.
Based on the survey done by the International Diabetes Federation (IDF) on October 2009, it is estimated that 285 million people around the world have diabetes. This total is expected to rise to 438 million within 20 years. Diabetes is the sixth leading cause of death in the United States and a leading cause of heart disease and stroke. In 2005, 1.1 million people died from diabetes. Almost 80% of deaths occurring from diabetes in low and middle income countries. Almost half of deaths occur in people under the age of 70 years. Due to increase in the diabetes at such an alarming rate, all the countries should take necessary initiative to reduce the onset of this disease.
The market demands for glucose monitoring due to the surge of the ‘diabetes’ disease, many technological players put their efforts to design a user friendly module either in invasive or non-invasive mode. The non-non-invasive Glucometer compared to its counterpart has bright future taking into consideration the epidemic breakdown of the disease diabetics. Also the epidemic is life style associated and poses a threat to the world’s community. Significant efforts have been made by several scientific groups and companies in the past few decades to develop a biosensor for noninvasive blood glucose analysis. Different optical approaches were proposed to achieve this goal. These approaches include polarimetry [1], Raman spectroscopy [2], near-infrared (NIR) absorption and scattering [3], and photo acoustics [4].It is evident that there is a need for good instrumentation development to monitor blood glucose non-invasively. Thus
the problem was formulated to develop various skills leading to blood glucose analysis using NIR spectroscopic technique.
1.1Near Infrared Spectroscopy:
Available Online at www.ijpret.com
62 NIR absorption property of tissue varies with tissue constituents especially water, fat, collagen, and their combination ratio. Most biological soft tissues have a relatively low light absorption property in the visible and NIR spectral regions. This spectral region is known as a “tissue optical window” or “therapeutic window”[5].Outside this region, light is greatly absorbed by tissue pigments (such as haemoglobin and melanin).
1.2 NIR Absorption of Water & Glucose
Water, the major component of biological tissues, accounts for 60% to 80% of total body mass[6].The water content varies with tissue type and it is age and gender-dependent. Water is considered to be one of the most important chromophores in tissue spectroscopic measurements because of its high concentration in most biological tissue. The absorption spectrum of water is shown in Figure 1 over the wavelength range 1000nm – 2500 nm[7].
Figure 1: Water Absorbance spectra
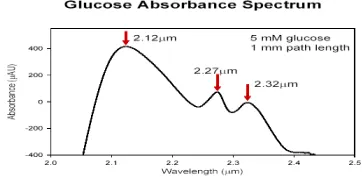
Figure 2: Absorption spectra of glucose
Available Online at www.ijpret.com
63 CCH, OCH). Thepresence of the CCH, OCH ring deformation component conferssome glucose specificity on these bands.
2.Method of Glucose Analysis:
There are various modules required to build the spectrophotometer like Sources, Detector and Accessories for IR Spectroscopy, monochromator, signal conditioning & signal processing. The most common materials used in FTIR spectrophotometer as sample accessories are NaCl that are hygroscopic and therefore ill-suited for use in connection with aqueous solutions. Hence we have designed an multi reflector mirror system for digital spectrophotometer controlled by softcore FPGA platform having the spectral range from 400-5000 cm-1 to direct the sample beam towards the human tissue such as index finger and scattered light is then collected by another mirror inclined at 45 degress and directed towards the detector of detectors connected to optical power meter.
2.1 Material for Sample Holders
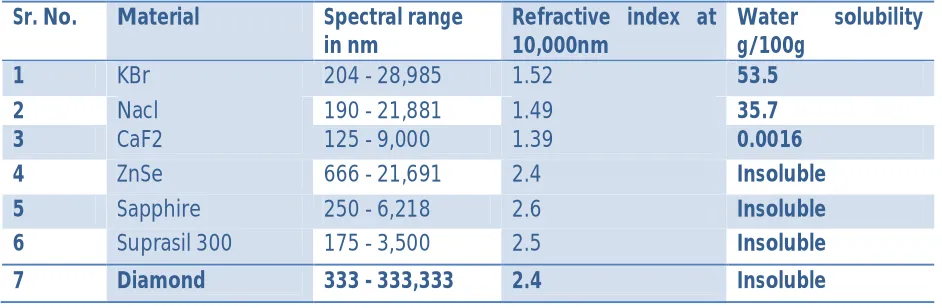
Various window materials and sample accessories (Table 1) used as in FT-IR spectrometers must be transparent to IR radiation. The most common materials are salts that are hygroscopic and therefore ill-suited for use in connection with aqueous solutions. The most commonly used window material for measurements on aqueous solutions is ‘CaF2’ which is sparingly dissolved
by water and has an index of refraction which is close to that of water. In the NIR spectral range, quartz and sapphire windows may be employed. They have the advantage of being hard and chemically inert.
Table 1: Infrared materials for windows.
Sr. No. Material Spectral range in nm
Refractive index at 10,000nm
Water solubility g/100g
1 KBr 204 - 28,985 1.52 53.5
2 Nacl 190 - 21,881 1.49 35.7
3 CaF2 125 - 9,000 1.39 0.0016
4 ZnSe 666 - 21,691 2.4 Insoluble
5 Sapphire 250 - 6,218 2.6 Insoluble
6 Suprasil 300 175 - 3,500 2.5 Insoluble
Available Online at www.ijpret.com
64 2.2 Actual Spectrophotometer Design
The design consists of QTH source is of 600 Watts output power. The reason why we have selected QTH source is that it has a spectral range from 0.35 µm to 2.5 µm. The range in which we are interested to carry out the experiment for glucose analysis is from 2.0 µm to 2.5 µm and QTH source supports that spectral range.
The monochromator can be designed for the required resolution. The monochromatic light output from the monochromator is then coupled to the sample in sample holder, which is then replaced with human tissue such as pinnae, index finger etc and the transmitted light is coupled back to the dual channel photometer. The InGaAs thermal cooled detector is used which has sensitivity of pico-watts.
The designed spectrophotometer as shown in Figure 3 to record the spectral information, we have designed the entire unit around the Altera CYCLONE II FPGA.
Figure 3: Digital spectrophotometer
The monochromatic light output is then coupled to human tissue (sample) such as palm, pinna, earlobe etc via a fiber bundle and light transmitted is coupled to thermal-cooled InGaAs detector, which is connected to dual channel photometer from Newport. Here Newport photometer is controlled by Altera NIOS II processor. Newport photometer 2935 has the sensitivity to detect the pico-watts power. The main reason behind the designing of the above discussed spectrophotometer is that it is difficult to carry out the infrared spectroscopy experiments for the aqueous sample (such as blood) due to the unavailability of the sample holders. The sample holder like KBr, NaCl and CaF2 are soluble in water which cannot be used
Available Online at www.ijpret.com
65 Least square regression (PLSR) technique which is running of Altera FPGA . Monochromator and power meter is controlled by the same Cyclone II FPGA used for signal processing.
2.3 Altera NIOS II soft core for Non-Invasive Glucometer
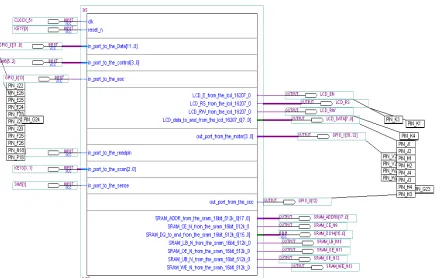
As the complexities of systems increases in embedded designing, there is an increasing need for tools that provide a higher level of abstraction – empowering the domain experts to use DSPs in building embedded systems rather than spending precious time at the prototyping stage, learning tedious tool chains. It was found that the utility of the said approach is limited due to non-availability of the soft IP core from the manufacturers for PLS regression techniques. Therefore the total design was shifted to ALTERA domain. The ALTERA boards like DE2 & DSP development boards having Cyclone II target which support the 32 bit NIOS – II softcore processor. The NIOS-II has its own small entities like ROM, TIMER, SDRAM, SRAM, FLASH support as shown in Figure. 5. The entire soft core system for recoding spectras and glucose prediction is shown in figure 6.
Figure. 5: NIOS II soft core processor
Available Online at www.ijpret.com
66 The acquired data can be processed using PLS algorithm in ‘C language’ for computing the unknown concentration of the variants. We have tested the designed system for multivariate analysis by running SIMPLE PLS C algorithm to estimate the level of blood glucose .We have also tested the same designed system for various Matrix manipulation for application involving curve fitting, finding square root of numbers, mean of numbers, sorting numbers, finding the solutions of quadratic equations, matrix transpose, finding determinant, multiplication, interpolation.
3. PLSR Model Validation:
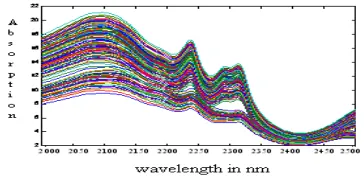
PLSR Model finds good use in the multivariate spectroscopic data. PLSR is an extension of the multiple linear regression models. Therefore PLSR is mostly used as an exploratory analysis tool to select suitable predictor variables and to identify outliers. We have developed PLSR model based on SIMPLS algorithm in C language and ported on FPGA platform to estimate the glucose concentration. We have validated the PLSR model and the prediction results were within the acceptable ranges. The resultant spectra of all blood constituents in the range 2000 nm to 2500 nm will have the form shown in Figure 7. The result obtained after passing these detected spectra’s through PLSR model were closer to the actual value of Glucose concentration.
Figure 7: samples Template for the PLSR m.
Results: FPGA platform designed around Altera DE2 board having target as CYCLONE II (EP2C6) to estimate the level of blood glucose in human body Non-Invasively by using the NIR radiation in the range 2.0um to 2.5um.The PLSR model based on SIMPLS algorithm is also developed in C language and ported on NIOS II platform to estimate the glucose concentration.
Available Online at www.ijpret.com
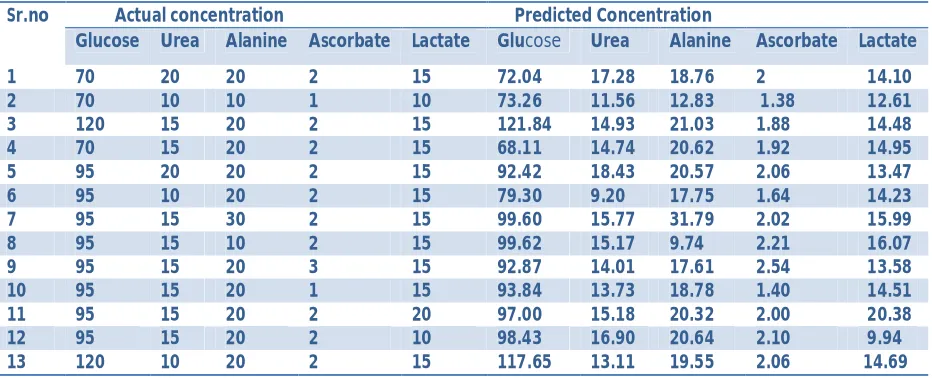
67 Table I : comparison of predicted and actual concentration
Sr.no Actual concentration Predicted Concentration
Glucose Urea Alanine Ascorbate Lactate Glucose Urea Alanine Ascorbate Lactate
1 70 20 20 2 15 72.04 17.28 18.76 2 14.10
2 70 10 10 1 10 73.26 11.56 12.83 1.38 12.61
3 120 15 20 2 15 121.84 14.93 21.03 1.88 14.48
4 70 15 20 2 15 68.11 14.74 20.62 1.92 14.95
5 95 20 20 2 15 92.42 18.43 20.57 2.06 13.47
6 95 10 20 2 15 79.30 9.20 17.75 1.64 14.23
7 95 15 30 2 15 99.60 15.77 31.79 2.02 15.99
8 95 15 10 2 15 99.62 15.17 9.74 2.21 16.07
9 95 15 20 3 15 92.87 14.01 17.61 2.54 13.58
10 95 15 20 1 15 93.84 13.73 18.78 1.40 14.51
11 95 15 20 2 20 97.00 15.18 20.32 2.00 20.38
12 95 15 20 2 10 98.43 16.90 20.64 2.10 9.94
13 120 10 20 2 15 117.65 13.11 19.55 2.06 14.69
Table II: RMSE Analysis for glucose
Sample RMSE +5% CI RMSE -5% CI RMSE
Experimental 4.143 3.981 4.3520
Figure. 8: RMSE analysis of five variants
Available Online at www.ijpret.com
68 CONCLUSIONS:
As NIR spectroscopy continues to be developed for blood glucose measurement, it is critical to assess model accuracy, precision and validation on the basis of clinically acceptable criteria. Multivariate statistical modeling methods have been applied to near-infrared (NIR) spectral data to discriminate glucose concentrations. Specifically, performance levels are compared for principal component regression (PCR) and partial least-squares regression (PLSR) models based on their standard errors of prediction (SEP). Only the data between 2000 nm and 2500 nm were used for calibration model development and validation. The prediction error can be minimized if the intra, inter constituents chemistry is known by means of various pathways triggered by the ambient conditions in the process of catabolism of glucose.
REFERENCES:
1. Rabinovitch B, March WF, Adams RL, “Noninvasive glucose monitoring of the aqueous humor of the eye. Part I. Measurement of very small optical rotations”, Diabetes Care, Vol 5, No. 3,pp254-258, 1982.
2. Goetz MJ Jr, Cote GL, March WE, Erckens R, Motamedi M, “Application of a multivariate technique to Raman spectra for quantification of body chemicals”, IEEE Trans Biomed Eng 42(7), 728-731, 1995.
3. Pan S, Chung H, Arnold MA, Small GW, “Near-infrared spectroscopic measurement of physiological glucose levels in variable matrices of protein and triglycerides”, Anal Chem, 68(7), pp1124-1135, 1996.
4. MacKenzie HA, Ashton HS, Spiers S, Shen Y, Freeborn SS, Hannigan J, Lindberg J, Rae P, “Advances in photoacoustic noninvasive glucose testing”, Clin Chem 45(9), pp1587-1595, 1999.
5. R. R. Anderson and J. A. Parrish, “The optics of human skin”, J. Invest. Dermatol. , 1981, vol. 77, pp.13-19.
6. Elaine N. N. Marieb, “Human Anatomy And Physiology”, Benjamin-cummings Publishing Company, 1995, ISBN: 805343229.
7. George M. Hale and Marvin R. Querry, “Optical Constants of Water in the 200-nm to 200-µm Wavelength Region”, Applied Optics,1973,vol. 12(3), pp. 555-563.