Available Online at www.ijpret.com 357
INTERNATIONAL JOURNAL OF PURE AND
APPLIED RESEARCH IN ENGINEERING AND
TECHNOLOGY
A PATH FOR HORIZING YOUR INNOVATIVE WORKEPILEPSY DETECTION USING STATISTICAL FEATURES ON EEGSIGNAL
SWAPNIL A. TALE, PROF. S. S. MHASKE, DR. C. M. JADHAO
MGI-COET, Shegaon
Accepted Date: 15/03/2016; Published Date: 01/05/2016
\
Abstract: EEG (Electroencephalograph) is a technique for identifying neurological disorders. Epilepsy
is a disorder of the central nervous system characterized by loss of consciousness and convulsions.
EEG is the recording of electrical activity of the brain signals that can be used to diagnose the
epilepsy condition. In this paper, we propose a novel method using best statistical features that are
well suited for detecting and localization of important epileptic events from noisy recorded seizure
EEG signals. We have achieved promising results that demonstrate efficiency and simplicity that can
be used in clinical studies as an automatic decision support tool. Thus reduce the physician’s
workload and provide accurate diagnosis of epileptic seizures.
Keywords—Electroencephalogram; Epilepsy; mean; max; least significant value; standard deviation;
variance.
Corresponding Author: MR. SWAPNIL A. TALE Access Online On:
www.ijpret.com
How to Cite This Article:
Swapnil A. Tale, IJPRET, 2016; Volume 4 (9): 357-364
Available Online at www.ijpret.com 358 INTRODUCTION
The EEG (Electroencephalogram) signal indicates the electrical activity of the brain[1]. They are highly random in nature and may contain useful information about the brain state. Electroencephalography is a graphic representation of the difference in voltage between two different cerebral locations plotted over time. [2][3]The scalp EEG signal generated by cerebral neurons is modified by electrical conductive properties of the tissues between the electrical source and the recording electrode on the scalp, conductive properties of the electrode itself, as well as the orientation of the cortical generator to the recording electrode.
The existence of the electrical activity of the brain (i.e. the electroencephalogram or EEG) was discovered more than a century ago by Caton. After the demonstration that the EEG could be recorded from the human scalp by Berger in the 1920s, it made a slow start before it became accepted as a method of analysis of brain functions in health and disease. It is interesting to note that this acceptance came only after the demonstration by Adrian and Mathews (1934) that the EEG, namely the alpha rhythm, was likely generated in the occipital lobes in man, and was not art factual.
Epilepsy is a brain disorder in which clusters of nerve cells, or neurons in the brain sometimes have abnormal signal. In the epilepsy, the normal pattern of neurons activity becomes disturbed causing strange sensation, emotion, behavior and loss of consciousness (Engel, 1989; Robert, 2005). Epilepsy is a disorder due to many possible causes. Anything that disturbs the normal pattern of neuron activity may result in illness, brain damage, or abnormal brain development[4]. EEG scan is a common diagnostic test for epilepsy and can detect abnormalities in the brain electrical activity. People with epilepsy frequently have changes in their normal pattern of brain wave, even though they arenotexperiencingaseizure. EEGplaysanimportant role in the diagnosis of epilepsy.
II. METHODS AND ACQUISITION
Available Online at www.ijpret.com 359 The data used are a subset of the EEG data for both healthy and epileptic subjects. EEG signals from two different groups are analysed: non patient and patient. The EEg segments were selected and cut out from continuous multi-channel EEG recordings after visual inspection for artifacts, e.g., due to muscle activity or eye movements[5]. EEGs from 20 patients were selected. Here segments were selected from all recording sites. By loading this data to the MATLAB software and by developing appropriate program we have extracted some features of that data. We are working on the EEG signal data of 10 epileptic patients and 10 non patients. We have extracted the EEG signal of 17 different lobes of eachpatient. We have taken 911 samples of each lobe for better accuracy[6]. The machine used for recording the electrical activities of brain was from the Neuro physician with Neuro plus software was used to record and process on the EEG signal.
B) Features Extraction
We have extracted 5 features of the EEG signal of each lobe wise channels[7][8]. It gives us the better accuracy for comparing the behavioral change in the EEG signal of epileptic patients and non-epileptic patients. The features we have extracted are given below:
A) Mean
B) Standard deviation
C) Variance
D) Least significant value
Available Online at www.ijpret.com 360 (A)Mean:
The mean of the data set is the arithmetic average of the elements in a data set obtained by adding all the values and dividing it by the number of values. In case of the data if in the form of frequency distribution, then the mean of frequency distribution data can be define as
𝜇 =1
𝑛∑ 𝑓𝑖𝑥𝑖 = ∑ 𝑝𝑖𝑥𝑖 𝑛 𝑖=1 𝑛 𝑖=1 (B) Variance:
The variance of data set is the arithmetic average of squared differences between the mean. Again, when we summarize a data set in frequency distribution, the variance of frequency distribution is given by,
Variance=𝜎2 =1
𝑛∑ 𝑓𝑖(𝑥𝑖− 𝜇) n
i=1
(c)Standard Deviation:
The standard deviation (STD) of a data set in a frequency distribution can be define by the equation,
STD=√1
𝑛∑ 𝑓𝑖(𝑥𝑖 − 𝜇) n
i=1
(D) Least significant value:
It is the minimum value in the given data set[9].The lowest possible value of the function at minimum point in a given data set is called Least significant value.
(E)Max:
The highest possible value or the most significant value in a given data set is called maximum value (MAX).
III. RESULT
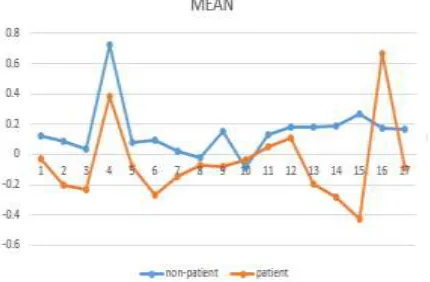
Available Online at www.ijpret.com 361 Table 1: Results of three features (average value, least significant value, max) for patient and
non-patient
LSV MAX AVG value
NP P NP P NP P
c3 -24.6 -24.9 20.18 27.9 0.1216 -0.026
c4 -25.9 -31.3 25.8 32.9 0.0886 -0.203
cz -27.8 -35.6 24.02 44.9 0.0371 -0.229
f3 -63.2 -65.8 44.2 67.1 0.7226 0.3827
f4 -17.6 -23.4 20.08 19.6 0.0758 -0.08
f7 -37.8 -25.3 33.33 37 0.0931 -0.272
f8 -19.4 -39.1 13.16 30.5 0.021 -0.145
fz -20.2 -28.3 16.78 22 -0.02 -0.076
fp1 -17.8 -110 15.81 45.1 0.1508 -0.082
fp2 -21.5 -54.7 15.27 36.6 -0.086 -0.034
p3 -33.2 -33.1 30.39 36.7 0.1322 0.0483
p4 -39.3 -46 32.22 52.8 0.1808 0.1059
pz -39.5 -31.3 34.11 34.6 0.1771 -0.198
t3 -20.8 -30.3 22.03 44.1 0.1869 -0.283
t4 -38.3 -29.6 24.35 29.5 0.2691 -0.429
t5 -30.4 -46.2 25.99 42.4 0.1731 0.6682
t6 -20.3 -27.1 18.97 29.1 0.1694 -0.089
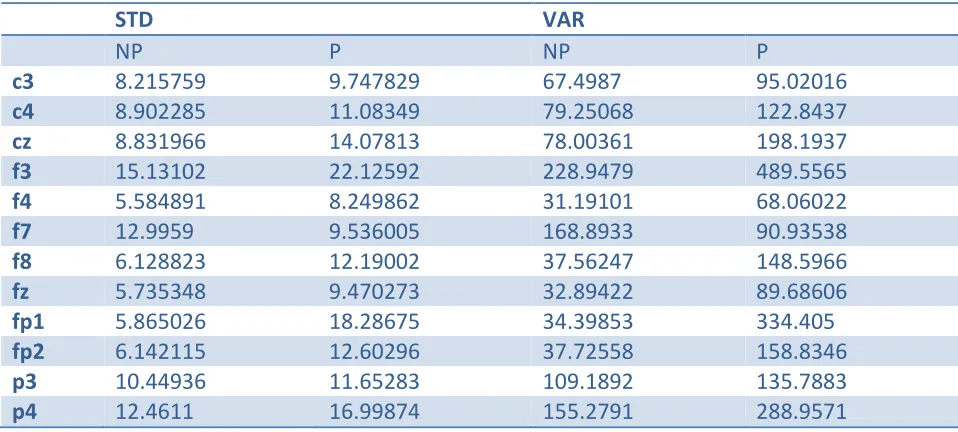
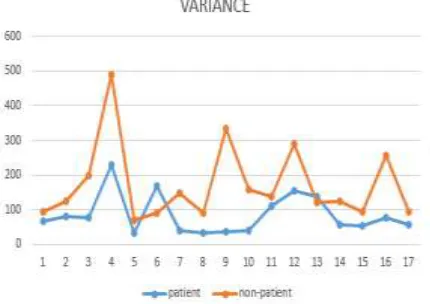
Table 2: Results of two features (standard deviation and variance) for patient and non-patient
STD VAR
NP P NP P
c3 8.215759 9.747829 67.4987 95.02016
c4 8.902285 11.08349 79.25068 122.8437
cz 8.831966 14.07813 78.00361 198.1937
f3 15.13102 22.12592 228.9479 489.5565
f4 5.584891 8.249862 31.19101 68.06022
f7 12.9959 9.536005 168.8933 90.93538
f8 6.128823 12.19002 37.56247 148.5966
fz 5.735348 9.470273 32.89422 89.68606
fp1 5.865026 18.28675 34.39853 334.405
fp2 6.142115 12.60296 37.72558 158.8346
p3 10.44936 11.65283 109.1892 135.7883
Available Online at www.ijpret.com 362
pz 11.75773 10.97875 138.2443 120.533
t3 7.580958 11.2051 57.47092 125.5543
t4 7.210116 9.644769 51.98577 93.02157
t5 8.822898 15.9541 77.84353 254.5332
t6 7.392236 9.624498 54.64515 92.63097
Figure 1: Graph for the max value of epileptic and non-epileptic patient
Available Online at www.ijpret.com 363 Figure 3: Graph for the least significant value of epileptic and non-epileptic patient
Figure 4: Graph for the standard deviation value of epileptic and non-epileptic patient
Available Online at www.ijpret.com 364 IV. CONCLUSION AND FUTURE WORK
This paper proposes an overview of the seizuredetection algorithms based on the analysis of EEG. The basic structure of the project is constructed in two main components, feature extraction and epilepsy detection. In this paper Statistical parameters are employed as a feature for seizure detection. The high observable difference in graphs values of the extracted feature during a seizure and normal EEG signal made it a good feature for seizure detection. For future work this system can be used along with linear classifier/SVM classifier for high accuracy. Also the time required for the computation of this features is less, thereby resulting in increased performance of system in terms of time.
V. REFERENCES
1. Seizure http://en.wikipedia.org/wiki/seizure
2. Ben li,neural engineering, Kamran lia selah , “biological signal classification and analysis” 3. Teen’s guide to epilepsy http://www.epilepsy.ca/eng/content/teens.html
4. N. Dheepa,” automatic seizure detection using higher order moments & ann” (lcaesm -2012) 5. N. Bogaarts, e. D. Gommer, d. M. W. Hilkman, v. H. J. M. Van kranen-mastenbroek, And j. P. H. Reulen, “eeg feature pre-processing for neonatal epileptic seizure detection, IEEE 2014 6. Simon tousseyn, “automatic selection of epileptic independent fmri components”, IEEE 2012 7. Chua, k. C., chandra, v., u, rajendra, acharya., lim, c.m. “analysis of epileptic eeg signals using higher order spectra” j med eng technology; IEEE 2009.
8. Ananthram swamia, “bibliography on higher-order statistics”, signal processing 60 (1997) 65-126, IEEE 1997