Optimization of Polymer Concentration for Designing of Oral Matrix Controlled
Release Dosage Form
S. Budiasih
1,2*, Jiyauddin K.
1,2, Logavinod N.
1,2,
M. Kaleemullah
2, Jawad A.
1,2, Samer A. D.
1,2, Fadli A.
1,
Eddy Y.
11Unit of Research, School of Pharmacy, Management & Science University, 40100 Shah Alam, Selangor Darul Ehsan, Malaysia. 2
Unit of Pharmaceutics, School of Pharmacy, Management & Science University, 40100 Shah Alam, Selangor Darul Ehsan, Malaysia.
Article Information Received 25 July 2014
Received in revised form 30 Oct 2014 Accepted 3 Nov 2014
Abstract
Patient’s compliance can be enhanced by using extended release drug delivery systems which
allow decreasing the number of daily doses, and helping to maintain uniform drug levels and
increase the safety margin for high-potency drugs. Hydroxypropyl methylcellulose (HPMC) is the
most commonly used hydrophilic polymer for the preparation of oral controlled drug delivery
systems. This research was conducted with the aim of developing matrix based oral controlled
release tablets for the drug diclofenac sodium using different viscosity grades of HPMC (K15M)
and to compare the drug release characteristics with those of a commercial product, Voltaren®
SR 100. Similarity factor (f2), values in between test formulation and marketed preparation was
calculated to choose the best formulation. The release kinetics from various matrices was also
studied. Increasing in polymer content reduced the rate of drug release. At the same polymer
content in the matrix, the drug release was most sustained with tablets prepared using HPMC
(K15M). Out of all the formulations studies, matrix tablets containing 40% of HPMC (K15M)
showed comparable dissolution profile to that of the marketed preparation as indicated by a
similarity factor value of (f2) 88.30%. The release of drug from marketed preparation and matrix
with HPMC (K15M) 40% was found to be a diffusion drug mechanism as per Higuchi equation. Keywords:
Diclofenac sodium HPMC (K15M) Dissolution Drug kinetics studies f2 value
*
Corresponding Author: E-mail: [email protected] [email protected] Tel.: 006-016-6328358 006-017-4250618
1 Introduction
Treatment of a disease in most cases requires maintaining a desired
drug plasma concentration level over a prolonged period of time. The
most common approach to minimizing patient non-compliance is by
using extended release drug delivery systems to decrease the
number of doses.
The development of oral controlled release dosage forms came to
restrict systems to certain regions and to improve the therapeutic
effect of the drug1. Hydrophilic matrix systems are among the most
widely used for the preparation of controlled drug release dosage
forms2,3. The concentration and viscosity grade of the polymer can
modify the drug release rate4,5.
Diclofenac sodium (Figure 1) being a class II drug within the
bio-pharmaceutics classification system (BCS) is sparingly soluble in
water but freely soluble in methanol, soluble in ethanol and is slightly
soluble in acetone. It is usually prescribed as once-a-day controlled
release tablets for management of painful arthritis conditions to
reduce the inflammation and thereby reduce pain. An effort was
therefore made to develop simple and effective controlled release
Diclofenac sodium tablets using a polymer matrix system with
uniform in vitro release properties. Hydroxypropyl Methylcellulose
(HPMC) is the most commonly and successfully used hydrophilic
retarding agent for the preparation of oral controlled drug delivery
systems6. As reported by Ford et al (1985) as the proportion of the
polymer in the formulation increases, the gel formed is more likely to
diminish the diffusion of the drug and delay the erosion of the
matrix7.
The objective of the present study was to develop matrix based oral
controlled release dosage form for the drug Diclofenac sodium using
different concentration of Hydroxypropyl methylcellulose (HPMC)
and to compare the drug release characteristics with those of a
UK Journal of Pharmaceutical and Biosciences
Available at www.ukjpb.com
UK J Pharm & Biosci, 2014: 2(5); 55 commercial product, Voltaren® SR 100.
Figure 1 Structure of Diclofenac sodium
2 Materials and Methods
2.1 Materials
Diclofenac sodium supplied by CCM UPHA Pharmaceuticals
Manufacturing (M) Sdn. Bhd. while Voltaren® SR100, used as
reference was purchased from a local pharmacy. HPMC (Methocel
K15M Premium) Lactose, Magnesium stearate, Talcum, Aerosil 200
and Povidone 30 procured from Pharmaniaga Manufacturing Berhad
(Selangor, Malaysia).
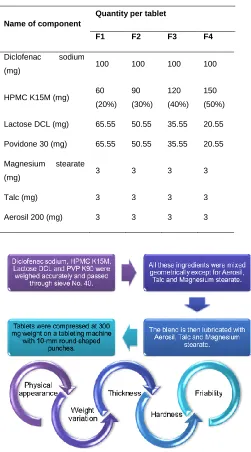
2.2 Preparation of matrix control release tablets
Diclofenac sodium matrix tablets were prepared by using direct
compression method with a 10 mm round concave punch at constant
hardness. Various concentrations 20, 30, 40 and 50% of HPMC
(K15M) polymer were used for the formulations of the series of
tablets containing a constant amount of Diclofenac sodium by
varying the composition of excipients. The composition of the
formulations prepared is as shown in Table 1 and Figure 2
respectively.
2.3 Evaluations of the prepared matrix tablets
2.3.1 Weight variation
Weight variation was calculated as per method descried in USP. 20
tablets were weighed individually and the average weight is
calculated. The requirements are met if the weights of not more than
2 of tablets differ by more than 7.5 mg and no tablets differ in weight
by more than double that percentage.
2.3.2 Tablets hardness
The hardness of 10 tablets was examined by using hardness tester
(Guoming® YD-1 Tablet Hardness Tester). The point of fracture of
the tablet was taken as the crushing strength of the tablets.
2.3.3 Thickness
The thickness was determined using a vernier caliper. Ten individual
tablets of each formulation were used.
Table 1 Composition of matrix tablet formulations
Name of component
Quantity per tablet
F1 F2 F3 F4
Diclofenac sodium
(mg) 100 100 100 100
HPMC K15M (mg) 60 (20%)
90
(30%) 120
(40%) 150
(50%)
Lactose DCL (mg) 65.55 50.55 35.55 20.55
Povidone 30 (mg) 65.55 50.55 35.55 20.55
Magnesium stearate
(mg) 3 3 3 3
Talc (mg) 3 3 3 3
Aerosil 200 (mg) 3 3 3 3
Figure 2 Formulation and Physical characterization of
Diclofenac sodium matrix controlled release tablets
2.3.4 Friability
Twenty tablets were weighed and placed into a Guoming® CS-2
tablet friability tester (Tianjin Guoming Medicinal Equipment Co.,
Ltd). The samples underwent 25 rotations per minute, for 4 minute,
and were then reweighed. This process was repeated for all
formulations and the percentage friability was calculated.
UK J Pharm & Biosci, 2014: 2(5); 56 Drug release from the various matrix tablets and reference was
determined by using the USP dissolution apparatus–II, paddle
method (Labindia DS 8000) at a speed of 100 rpm. The test was
conducted using 900 ml of 0.05M phosphate buffer pH 7.5 as a
dissolution medium, maintained at temperature of 37ºC ± 0.5ºC.
Samples of 5 ml volume each were collected at 0, 0.25, 0.5,1, 2, 3,
4, 5, 6, 7, 8, 9 & 12 hours using a manual collection method. The
amount of drug released was determined at 290 nm using an
ultraviolet (UV) Spectrophotometer (Thermo Sci. Evolution 60).
2.4 Analysis of drug release
2.4.1 Similarity factor calculation
The he similarity factor test (f2) is used to compare the dissolution
profiles of different formulations. The similarity factor is the
logarithmic reciprocal square root transformation of the sum of
squared error and it is to measure the similarity in the percent (%) of
dissolution between the two curves (FDA Guidelines 2000).
f2 =50 x log {[1+ (1/n) S t=1 n
(Rt-Tt) 2
] -0.5 x 100} (Equation 1)
Where,
n is the number of dissolution sample times,
Rt and Tt are the individual or mean percent dissolved at
each time point,
t, for the reference and test dissolution profiles,
respectively.
Two dissolution profiles are considered similar when the f2 value is
50 or more than 50.
2.4.2 Drug release kinetics
To study the kinetic profile of drug release from the formulations,
data was treated according to zero-order (Cumulative percentage of
drug released versus time), first-order (Log cumulative percentage of
drug remaining versus time), Higuchi (Cumulative percentage of drug
released versus square root of time), Korsmeyer-Peppas (Log
cumulative percentage of drug released versus log time), and
Hixson-Crowell (Cube root of cumulative percentage of drug
remaining versus time) equations10-14.
2.5 Statistical analysis
The data obtained from different formulations were analyzed by
one-way analysis of variance (ANOVA) procedure using the Statistical
Package for the Social Science (SPSS) program (SPSS Statistics
22.0). When there was a statistically significant difference, a
post-hoc Tukey test was then conducted to detect the differences among
the pairs. A statistically significant difference was considered at p <
0.05.
3 Results and Discussion
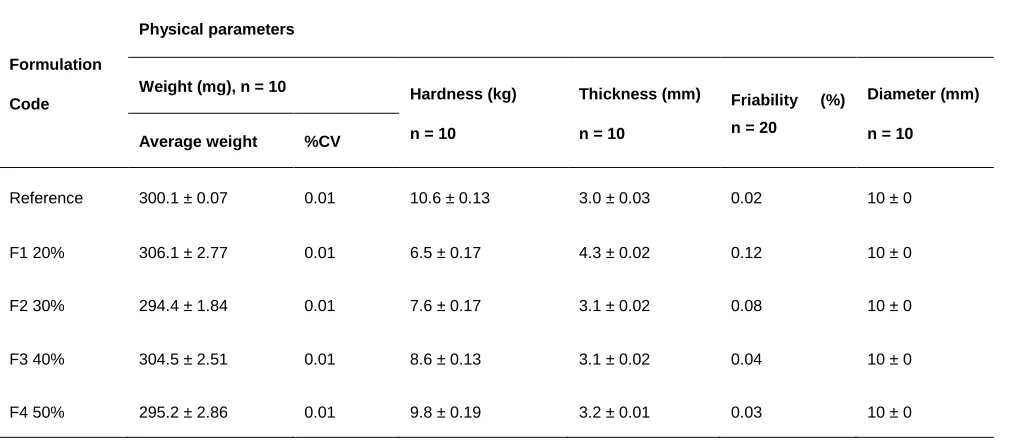
3.1 Evaluation of the prepared matrix tablets
Physical characteristics of the various matrix tablets are represented
in Table 2. All the formulations prepared showed good
pharmacotechnical characteristics. The hardness of all the matrix
tablets prepared ranged between 6.5-9.8 kg, diameter at 10mm,
thickness between 3.1-4.3 mm, and the friability was less than 0.5%.
The friability results of all the formulations were within the limit as
stated in the British Pharmacopoeia (2008) which is F<1%.
Table 2 Physical characterization of Diclofenac sodium matrix controlled release tablets prepared by usingdifferent concentration of
HPMC (K15M), Mean ± SD
Formulation
Code
Physical parameters
Weight (mg), n = 10 Hardness (kg)
n = 10
Thickness (mm)
n = 10
Friability (%)
n = 20
Diameter (mm)
n = 10
Average weight %CV
Reference 300.1 ± 0.07 0.01 10.6 ± 0.13 3.0 ± 0.03 0.02 10 ± 0
F1 20% 306.1 ± 2.77 0.01 6.5 ± 0.17 4.3 ± 0.02 0.12 10 ± 0
F2 30% 294.4 ± 1.84 0.01 7.6 ± 0.17 3.1 ± 0.02 0.08 10 ± 0
F3 40% 304.5 ± 2.51 0.01 8.6 ± 0.13 3.1 ± 0.02 0.04 10 ± 0
UK J Pharm & Biosci, 2014: 2(5); 57
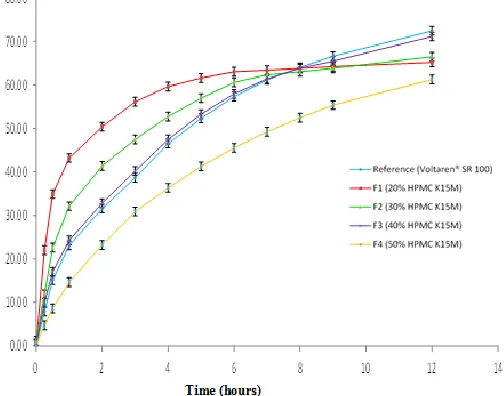
3.2 In-vitro drug release
Diclofenac sodium 300 mg tablets were prepared with different
concentrations (20, 30, 40 and 50%) of HPMC (K15M). Tablets were
uniform in weight and hardness. Figure 3 shows the mean
percentage of drug release profiles of Diclofenac sodium from
various tablet formulations. It was found that the rate of drug release
decreased as the content of polymer was increased (F1-F4). The
order of drug release was F1 > F2 > F3 > F4. These findings were in
good agreement with the results published by some researchers
using different concentrations of HPMC (K15M) as release retarding
agent for various drugs such as promethazine hydrochloride,
aminophylline, propranolol hydrochloride and indomethacin. The
mechanism of drug release from this type of polymer may be due to
water penetration and polymer relaxation to form a viscous, rubbery
gel layer. This rubbery layer controls drug release by the viscous
resistant force to drug diffusion or matrix erosion. The retarding
effect depends on the viscosity of the polymer, content of polymer
and solubility of the drug.
When 20% HPMC was used as matrix forming agent in the tablet for
dissolution study, the percentage release was 34.88% in the first 0.5
hour of the test and 65.15% after 12 hours. While with formulation
containing 30% HPMC, the release was 22.55% in the first 0.5 hour
and 66.46% after 12 hours. Likewise, in formulation containing 40%
HPMC, the drug release was 17.01% in the first 0.5 hour and
71.12% after 12 hours. From the formulation containing 50% HPMC,
the release was 8.61% in the first 0.5 hour and 61.26% after 12
hours.
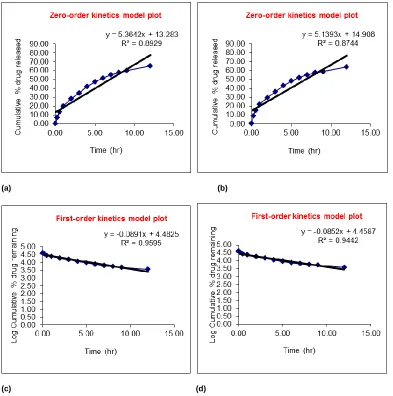
When the obtained dissolution data were fitted into the zero-order
kinetic equation (Cumulative amount of drug released versus time), it
is evident from Figure 4 and Table 3 that the plots were curvilinear
for all formulations and the regression values were small, suggesting
that the release kinetic did not follow the zero-order.
On the other hand, the dissolution results obtained were found to fit
well with the first- order kinetic equation (Log cumulative percentage
of drug remaining versus time). It is clearly evident from Figure 3 as
well as the regression parameters illustrated in Table 3 that a high
correlation coefficient was obtained with all the r2 values close to
unity. Also, these r2 values of first-order kinetic equation (0.6805 to
0.9595) were higher than those obtained for zero-order kinetics
equation (0.5904 to 0.8929) for all formulations. These data suggest
strongly a diffusion drug release mechanism from the matrix tablets.
First-order release describes the release from matrix tablet where
dissolution rate is dependent on the concentration of the dissolving
species. The release of the drug from the hydrophilic matrix was
slowed down as the concentration of polymer increased as indicated
by the first-order release rate constant values.
Figure 3 In-vitro drug release profile of Diclofenac sodium from
tablets containing different concentrations ofHPMC (K15M).
Mean ± SD, N = 3
Figure 4 In vitro drug release profile of Diclofenac sodium from
tablets containing 40% HPMC (K15M) and reference product,
Voltaren® SR 100. Mean ± SD, N = 3
Beside the first-order equation, the mechanism of drug release from
the matrix tablet was evaluated by fitting the dissolution data of the
drug release profiles to Higuchi square root model equation of
diffusion (Cumulative percentage of drug released versus square
root of time). It can be observed from Figure 3 as well as Table 3 that
a linear relationship was obtained with all the formulations (0.8259 to
0.9918) which indicated that the release of drug from the matrix
UK J Pharm & Biosci, 2014: 2(5); 58 Furthermore, to determine whether the erosion was also involved in
the drug release from the matrix tablet formulations, the dissolution
data of drug release profiles were fitted to Hixson-Crowell cube root
law (Cube root of cumulative percentage of drug remaining versus
time), The r2 values were high (0.6514 to 0.9401) indicating that a
linear relationship was obtained for all formulations, implying erosion
might have also occurred in the release of drug from the matrix
tablet. So, the release of the drug from all formulations may be
attributed to both diffusion and erosion mechanisms though diffusion
might be dominating the release in the initial hours.
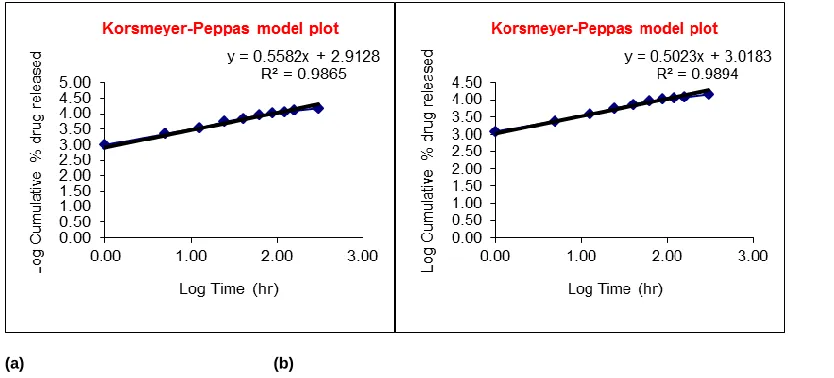
Table 3 Kinetics data of Diclofenac sodium release from different concentrations of HPMC (K15M) formulations. Mean, N = 3
Formulation Code
Zero-order First-order Higuchi
Hixson-Crowell
Korsmeyer-Peppas Similarity factor (f2)
r2 K0 r2 K0 r2 K0 r2 K0 r2 n
Reference 0.892 13.283 0.959 4.482 0.991 0.153 0.940 4.442 0.986 0.558 - F1 20% 0.590 28.759 0.680 4.242 0.825 16.611 0.651 4.123 0.913 0.258 43.21 F2 30% 0.758 20.532 0.838 4.370 0.939 7.632 0.813 4.293 0.946 0.418 59.19 F3 40% 0.874 14.908 0.944 4.458 0.988 1.719 0.923 4.410 0.989 0.502 88.30 F4 50% 0.921 8.544 0.967 4.530 0.993 2.688 0.953 4.517 0.990 0.662 49.58 Where,
r2
is the regression coefficient, K0 is the zero-order release rate constant, K1 is the firstorder release rate constant, KH is the Higuchi rate constant, KC is the cube root law release constant, and n is the release or, slope exponent
(a) (b)
(c) (d)
Figure 5 Zero order and first order kinetic plots of Diclofenac sodium release from marketed reference product Voltaren® SR 100 (a&c)
UK J Pharm & Biosci, 2014: 2(5); 59
(a) (b)
Figure 6 Higuchi kinetic plots of Diclofenac sodium release from marketed reference product Voltaren® SR 100 (a) and Formulation 3 (b), respectively. Mean, N=3
(a) (b)
Figure 7 Hixson-Crowell kinetic plots of Diclofenac sodium release from marketed reference product Voltaren® SR 100 (a) and Formulation 3 (b), respectively. Mean, N=3
(a) (b)
UK J Pharm & Biosci, 2014: 2(5); 60 The dissolution data of drug release profiles were further fitted into
Korsmeyer-Peppas equation (Log cumulative percentage of drug
released versus log time). This analysis was conducted to further
confirm that both diffusion and erosion mechanism were involved in
releasing the drug from the matrix tablets by calculating the values of
drug release exponent (n). In this context, when the n value is equal
or less than 0.45 (n ≤ 0.45), it indicates that Fickian diffusion is the
mechanism (Case I diffusion) of drug release where the relative
relaxation time of the polymer is much shorter than the characteristic
diffusion time of water transport which is controlled by concentration
gradient. When, the n value is between 0.45 to 0.89, it indicates
non-Fickian type of release (Anomalous transport) which refers to a
combination of both diffusion and erosion drug release
mechanisms15. On the other hand, when n value is equal or greater
than 0.89 (n≥ 0.89), it indicates an erosion mechanism which is
referred to as Case II Transport explains what is relaxation of
polymeric controlled. In general, the diffusional exponent n value is
smaller for drug release primarily by diffusion mechanism and
greater for drug release primarily by erosion mechanism16. From the
results showed in Table 3, it can be observed that the all
formulations had good correlationvalues(0.9139 to 0.9865), with
slope exponent (n) values ranging between 0.2588 to 0.6625,
indicating that the release of drug from all the matrix tablet
formulations followed non-Fickian type of release (Anomalous
transport). Such release characteristic could be attributed to the
increase in strong entanglement bonds between the polymer
particles which resisted the erosion by the dissolution medium in the
initial hours of drug release.
The results from the present study showed that the drug release
pattern of Diclofenac sodium from the different concentration of
hydrophilic polymer HPMC (K15M) followed first-order release
kinetics.
The similarity factor (f2) of formulation F1 when compared to
Voltaren® SR 100 was 43.21, similarly, the f2 value for formulations
F2, F3, and F4 were 59.19, 88.30, and 49.58% respectively. From
the results tabulated in Table 3 it can be observed that the f2 values
for F1 and F4 was less than 50%, indicating that the dissolution
profiles were not similar to that of Voltaren® SR 100 while
formulations F2 and F3 are similar to the reference product since the
f2 values were more than 50%.
4 Conclusions
Out of all the formulations studies, matrix tablets containing 40%
HPMC (K15M) showed comparable dissolution profile and kinetics to
that of the reference product, Voltaren® SR 100.
The f2 value between reference product and test formulation matrix
with 40% HPMC (K15M) was 88.30% and hence it was selected for
further investigation. The hydrophilic polymer, 40% HPMC (K15M)
could be successfully employed in the formulation of hydrophilic
matrix tablets where the drug release was governed with diffusion
mechanisms as per Higuchi equation.
5 Acknowledgements
The authors are gratefully acknowledged to the Research
Management Center (RMC), Management & Science University,
Shah Alam, Selangor Darul Ehsan, Malaysia for providing the
necessary facilities to carry out the research project successfully.
Further more the authors would like to extend their special thanks to
the parents and friends for their encouragements and supportsduring
the research work.
6 References
1. Roseman TJ, Cardinelli NF. In Controlled-release
Technologies, Vol.1 (A. F. Kydonieus, ed), CRC Press,
Boca Raton, FL. 1980.
2. Prabu SL, Shirwaikar AA, Shirwaikar A, Ravikumar G,
Kumar A, Jacob A. Formulation and evaluation of oral
sustained release of Diltiazem Hydrochloride using rosin
as matrix forming material. Ars Pharm. 2009; 50(1);
32-42.
3. Jiyauddin K, Sung YK, Samer AD, Kaleemullah M, Rasha
S, Budiasih S, Jawad A, Rasny MR, Gamal OE, Junainah
AH, Eddy Y, Fadli A, Chan WJ. Comparative study on the
effect of hydrophilic and hydrophobic polymers on the
dissolution rate of a poorly water soluble drug. Int J Pharm
Ana Res. 2014; 3(3): 291-300.
4. Sung KC, Nixon PR, Skoug JW, Ju TR, Gao P, Patel MV.
Effect of formulation variables on drug and polymer
release from HPMC based matrix tablets. Int J Pharm.
1996; 142: 53-60.
5. Khan J, Yuen KH, Hong NB, Woei WJ, Mallikarjun C,
OsmanEG, Samer AD. Preparation and in vitro Evaluation
of Different Controlled-release Polymeric matrices
containing Ketoprofen. Health Med J. 2009; 4(2): 386-392.
6. Colombo P. Swelling-Controlled-release in Hydrogel
Matrices for Oral Route. Adv Drug Del Rev. 1993;
11:37-57.
7. Ford J, Rubinstein M, Hogan J. Propranolol hydrochloride
and aminophylline release from matrix tablet containing
hydroxypropyl methylcellulose. Int J Pharm. 1985a; 24:
339-350.
8. Masih D, Gupta R. Formulation and Evaluation of Mouth
Dissolving Tablets of Tolperisone. UK Journal of
Pharmaceutical and Biosciences. 2013; 1(1): 1-6.
UK J Pharm & Biosci, 2014: 2(5); 61 Evaluation of Mouth Dissolving Tablets of Celecoxib
Employing Distinctive Proportion of Disintegrating Agents.
UK Journal of Pharmaceutical and Biosciences. 2013;
2(2): 16-21.
10. Higuchi T. Rate of release of medicaments from ointment
bases containing drugs in suspension. J Pharm Sci. 1961;
50: 874–875.
11. Higuchi T. Mechanism of sustained-action medication.
Theoretical analysis of rate of release of solid drugs
dispersed in solid matrices. J Pharm Sci. 1963; 52:
1145-1149.
12. Korsmeyer RW, Gurny R, Doelker EM, Buri P, Peppas NA.
Mechanism of solute release from porous hydrophilic
polymers. Int J Pharm. 1983; 15: 25–35.
13. Ritger PL, Peppas NA. A Simple Equation for Description
of Solute Release. II. Fickian and Anomalous Release
from Swellable Devices. J Cont Rel. 1987; 5:23-36.
14. Peppas NA. Analysis of Fickian and non-Fickian drug release from polymers. Pharm Acta Helv. 1985; 60: 110–
111.
15. Tetsuo H, Hideyoshi K. formulation study and drug release
mechanism of a new theophylline sustained-release preparation. Int J of Pharm. 2005; 304: 91–101.
16. Siepmann J, Peppas NA. Modeling of drug release from
delivery systems based on hydroxypropyl methylcellulose