ISSN: 0976-3031
Research Article
A COMPARATIVE STUDY OF CROWN/ROOT RATIO BETWEEN UNILATERAL AND
BILATERAL CLP PATIENTS AND CONTROL GROUP
Lalit Kharadi., Falguni Mehta., Shivam Mehta., Hardik Suvagiya* and
Vidhi Tyagi
Department of Orthodontics, Government Dental College and Hospital, Ahmedabad
DOI: http://dx.doi.org/10.24327/ijrsr.2018.0904.1891
ARTICLE INFO ABSTRACT
Context: It is observed that cleft lip and palate (CLP) patients have more dental abnormalities than individuals without cleft such as hypodontia, supernumerary teeth, microdontia, reduced crown and root size, etc. Anticipated implications of vertical distortion, reported from panoramic radiographs,
could be prevented when assessing crown/root ratio of CLP patients 16.
Aims: To compare crown root ratio of cleft patient with normal patients so as to modify orthodontic treatment mechanics
Methods and Material: Digital orthopantomograms of cleft patients and control patients were obtained from the department. Crown/Root ratios were calculated for 50 CLP patients (25 Bilateral CLP and 25Unilateral CLP patients) and 32control group patients from orthopantomograms. A total of 2045 teeth (1224teeth of CLP patients, 821 teeth of control patients) were traced and measured.
Results: BCLP patients have significantly higher C/R ratio in some teeth than UCLP. Root length is shorter in BCLP than UCLP group.
Conclusions: orthodontic treatment modification in biomechanics, using lighter forces and periodic check-up for root resorption for CLP patients should be considered.
INTRODUCTION
Cleft lip and palate (CLP) accounts for a large fraction of all human birth defects and are notable for their significant lifelong morbidity and complex aetiology1.
It has been suggested that cleft lip and palate is not just a localized disruption in development but is a systemic, generalized restriction of these individuals' growth potential2. It can be caused by a single gene mutation, chromosomal aberration or specific environmental agents but majority is caused by interaction of many genetic and environmental factors2.
Cleft not only interferes with feeding, respiration and various other physical and psychological functions but is also partially responsible for the observed reduction in the growth potential. The variation in abnormalities from one patient to another patient makes the problem difficult to define and evaluate3,4. Children with CLP require various health care practitioners who form a cleft team. This multidisciplinary CLP team comprises of Paediatrician, Plastic surgeon, Orthodontist, Ear Nose Throat surgeons, Speech therapist, Psychologists etc. This
team is responsible for patients’ medical and general development, facial esthetics, psychological wellbeing, hearing and speech development. Orthodontist forms the key part of this multidisciplinary effort5.
It is observed that CLP patients have more dental abnormalities than individuals without cleft. This includes hypodontia, supernumerary teeth, microdontia, aberrant root forms, malformed teeth, reduced crown and root size, pseudoprognathism etc5. These defects may be attributed to cleft itself or to early surgical correction of defects.
Increased incidence of dental crown abnormalities associated with CLP have been reported by several investigators. These abnormalities affect both upper and lower arches; anterior and posterior teeth6. Similarly several studies have been carried out to assess root development in cleft patients. However, most of these were focused on root development of the lateral incisor in the vicinity of the cleft5,7,8.
The morphologic events associated with tooth root formation in variety of animals have been described; however, mechanism of human tooth root formation is not completely understood9,10. The main reasons for short dental roots can be disturbances
Available Online at http://www.recentscientific.com
International Journal of
Recent Scientific
Research
International Journal of Recent Scientific Research
Vol. 9, Issue, 4(B), pp. 25603-25611, March, 2018
Copyright © Lalit Kharadi et al, 2018, this is an open-access article distributed under the terms of the Creative Commons Attribution License, which permits unrestricted use, distribution and reproduction in any medium, provided the original work is properly cited.
DOI: 10.24327/IJRSR CODEN: IJRSFP (USA)
Article History:
Received 8th January, 2018
Received in revised form 21st
February, 2018
Accepted 05th March, 2018
Published online 28th April, 2018
Key Words:
during root development or resorption of developed roots12 Some type of environmental insults during tooth development were found to result in short rooted teeth. They include chemotherapy, radiation therapy, etc. They have also been associated with Steven-Johnson Syndrome, Down Syndrome, Turner Syndrome, scleroderma 11 etc. short root anomaly as described by a few others is not due to the resorption of roots but due to developmentally short blunt roots of teeth particularly, the maxillary incisor teeth13,14. Roots of teeth are usually measured on panoramic radiographs. Several studies have demonstrated that accurate reproducibility of panoramic radiograph and their diagnostic quality are heavily dependent on careful attention to positioning and processing15,. Anticipated implications of vertical distortion, reported from panoramic radiographs, could be prevented when assessing crown/root ratio of CLP patients 16.
Therefore, this study is undertaken to compare crown root ratio of cleft patient with control group so as to modify orthodontic treatment mechanics as short roots resulting in highly unfavourable crown root ratio may affect the prognosis of teeth and complicate Orthodontic treatment planning17.
The aims and objectives of this study are
To define and compare crown root ratio of permanent teeth of both unilateral and bilateral cleft patients to control group patients.
To define and compare crown root ratio of permanent teeth between bilateral and unilateral cleft patients.
To determine and compare crown height and root length of permanent teeth between unilateral and bilateral cleft patients and to control group patients so as to assist orthodontist in treatment planning.
SUBJECTS AND METHODS
Pretreatment digital orthopantomograms of cleft patients and control patients were obtained from the department. The study sample consisted of 47CLP patients undergoing orthodontic treatment with age group of 14 to 22 years (mean age 17 years) wherein 23 were bilateral cleft lip and palate (BCLP) and 24 were unilateral cleft lip and palate (UCLP) and 32 control group patients with the mean age of 14-22 years (mean age 17 years).
Cleft subjects with following criteria were considered for this study
Unilateral or Bilateral complete cleft.
Not having any other recognizable syndrome.
Age more than 14 years with all permanent teeth erupted excluding third molars.
The Pretreatment Orthopantogram of the patients undergoing orthodontic treatment at the department of orthodontics, Government Dental College and Hospital, Ahmedabad. All the patients included in the study presented were undergoing orthodontic treatment for the first time i.e. on history taking no history of prior orthodontic treatment was provided by the patients included in the study.
Control group subjects were included with following criteria.
Age more than 12 years – All permanent teeth erupted excluding third molars.
Normal Class I occlusion with no crowding or spacing.
Not having any dental or skeletal anomaly.
No history of orthodontic treatment in past.
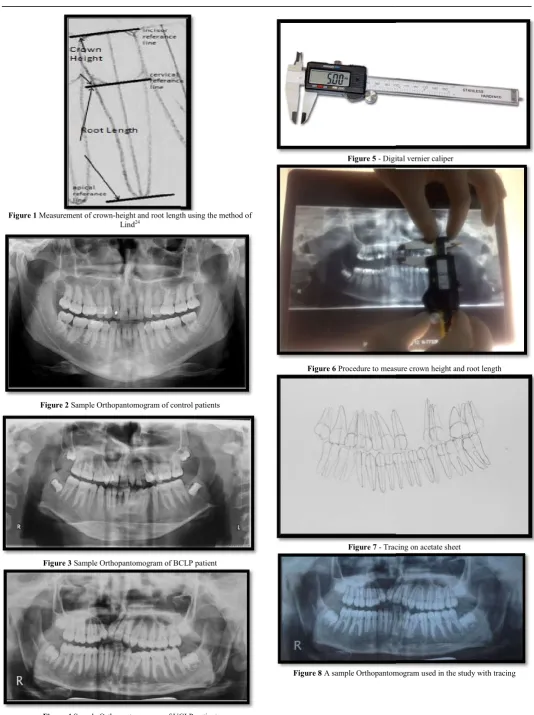
Digital orthopantomograms of all the patients were obtained from Kodak 8000 c machine (France) with exposure time 13.9 seconds at 10 mA and 72 kVp to avoid error of magnification of images. These digital orthopantomograms were traced under ideal conditions, including the use of subdued lights, film masking, and a conventional viewing box. The outlines of the permanent maxillary and mandibular teeth which were apparent, were marked with a special pencil (0.5mm lead). Crown heights and root lengths were measured using the method of Lind14 (Figure 1-8), and the measurements were made with a sliding digital Vernier callipers on acetate sheet. All the measurements were rounded to the nearest tenth decimal.
For the purposes of tooth length measurements, three parallel reference lines were drawn and crown height and root length of all the teeth were measured.
An incisal / occlusal reference line - A tangent to an incisal tip or a buccal cusp and visually placed perpendicular to the long axis of the tooth.
The cervical reference line - the line joining the mesial and distal cervical margins of enamel.
The apical reference line touching the outermost part of the root, and in teeth with two buccal roots, the longer root was measured; this line was visually placed perpendicular to the long axis of the tooth14. The palatal roots of the maxillary molars were omitted.
Crown height - measured by drawing the perpendicular line from the midpoint of the cervical reference line to the incisal/occlusal reference line with the help of digital Vernier calliper.
Root length - measured by the perpendicular line from the midpoint of the cervical reference line to the apical reference line with the help of Digital Vernier Calliper.
The C/R ratio of an individual tooth - calculated by dividing crown height by root length.
Teeth were excluded if
They showed obvious distortion,
The apex was not closed,
Root resorption was evident,
They were impacted,
Marked attrition or abrasion of the crown
Teeth showing pulpal or periapical lesion
Grossly carious teeth,
International Journal of Recent Scientific Research
Figure 1 Measurement of crown-height and root length using the method of Lind24
Figure 2 Sample Orthopantomogram of control patients
Figure 3 Sample Orthopantomogram of BCLP patient
Figure 4 Sample Orthopantomogram of UCLP patient
International Journal of Recent Scientific Research Vol. 9, Issue, 4(B), pp. 25603-25611
height and root length using the method of
Sample Orthopantomogram of control patients
Sample Orthopantomogram of BCLP patient
Sample Orthopantomogram of UCLP patient
Figure 5 - Digital vernier caliper
Figure 6 Procedure to measure crown height and root length
Figure 7 - Tracing on acetate sheet
Figure 8 A sample Orthopantomogram used in the study with tracing
25611, April, 2018
Digital vernier caliper
Procedure to measure crown height and root length
Tracing on acetate sheet
RESULTS AND DISCUSSION
Digital orthopantomograms of cleft and control group patients were used to measure crown heights and root lengths. Crown /Root ratios were calculated for 47 CLP patients (23 BCLP and 24 UCLP) and 32 control group patients. A total of 2045 teeth (1224 teeth of CLP patients, 821 teeth of cont
were traced and measured and the data thus obtained was subjected to statistical analyses. The missing and impacted teeth were not traced in from the CLP patients sample. were excluded as they showed severe dilacerations and the apical 1/3rd of the root curved excessively in relation to the long axis of the tooth. These teeth were excluded because of the fact that the straight line measurement from the tip of the root to the cervical reference line of the tooth would not reflect the actual root length of the tooth.
Statistical analysis
The statistical methods that were employed in the present study are:
Mean
Standard deviation Standard error
Independent samples T test P – value
On the basis of study, Table-1 shows the difference in mean crown-root (C/R) ratio between control with UCLP and control with BCLP patients.
a
p ≤ 0.05, b
p ≤ 0.01, c
p ≤ 0.001
C/R indicates crown-root; s, significant; ns, not significant; s.d, standard deviation; s.e, standard error; n, number of teeth.
0 0.2 0.4 0.6 0.8 1 1.2
1
1
,2
1
1
3
,2
3
1
5
,2
5
1
7
,2
7
3
2
,4
2
3
4
,4
4
3
6
,4
6
M
e
a
n
C
/R
R
a
ti
o
Tooth Number
Control
Unilateral cleft lip and palate
Bilateral cleft lip and palate
Table 1 Difference in mean Crown-Root ratio between control and unilateral cleft lip and palate patients, cont
Control
N Mean
C/R ratio s.d s.e
11,21 59 0.70 0.12 0.02 12,22 55 0.63 0.10 0.02 13,23 55 0.68 0.11 0.02 14,24 53 0.67 0.07 0.01 15,25 52 0.68 0.08 0.02 16,26 60 0.75 0.12 0.02 17,27 58 0.78 0.12 0.02 31,41 58 0.59 0.09 0.02 32,42 58 0.60 0.08 0.02 33,43 56 0.62 0.09 0.02 34,44 56 0.59 0.08 0.02 35,45 57 0.56 0.07 0.02 36,46 60 0.60 0.09 0.02 37,47 57 0.66 0.12 0.02
and control group patients were used to measure crown heights and root lengths. Crown /Root ratios were calculated for 47 CLP patients (23 BCLP and 24 UCLP) and 32 control group patients. A total of 2045 teeth 821 teeth of controls patients) were traced and measured and the data thus obtained was subjected to statistical analyses. The missing and impacted teeth were not traced in from the CLP patients sample. 3 teeth were excluded as they showed severe dilacerations and the of the root curved excessively in relation to the long axis of the tooth. These teeth were excluded because of the fact that the straight line measurement from the tip of the root to the cervical reference line of the tooth would not reflect
The statistical methods that were employed in the present study
1 shows the difference in mean root (C/R) ratio between control with UCLP and control
root; s, significant; ns, not significant; s.d, standard
It was observed that statistically significant difference existed in Maxillary Central Incisors (p= 0.043), Maxillary Lateral Incisors (p = 0.029), Mandibular Central Incisors (p= 0.042) and Mandibular Lateral Incisors (p= 0.032) when
was compared with UCLP group. When control group was compared with BCLP group, following teeth showed statistically significant difference.[Maxillary central incisors (p= 0.001), maxillary lateral incisors (p=0.039), maxillary canines (p= 0.019), maxillary first premolars (p= 0.035), maxillary second premolars (p= 0.002) and maxillary second molars (p= 0.001), mandibular central incisors (p=0.004), mandibular lateral incisors (p= 0.036), mandibular canines (p=0.044) and mandibular first premol
findings are similar to those of Ghaida A. Al Jamal
where control group compared with UCLP, showed significant difference in C/R ratio of maxillary and mandibular incisors. C/R ratio of control group when compared with BCLP, showed significant difference in maxillary incisors, maxillary canines, maxillary premolars, maxillary second molars, mandibular incisors, mandibular canines and mandibular first premolars. In contrast our study shows maxillary second premolar to have a highly significant variation (p= 0.002). C/R ratios are higher for both BCLP and UCLP patients than in controls. It is also noticed that C/R ratios of canines, premolars, and molars in both jaws are not affected when UCLP is compared with control group. This unfavourable C/R ratio could be the result of shorter roots rather than longer c
But very few studies have been conducted which investigate crown / root ratios, crown height and root length in CLP patients to be available for comparison.
Table 2 shows the difference in mean C/R ratio between BCLP and UCLP patients. Within the CLP group, BCLP patients showed high and statistically significant C/R ratios in the following teeth [maxillary central incisors (p = 0.01), maxillary lateral incisors (p=0.02), maxillary canines (p = 0.04), maxillary second premolars (p = 0.002), maxillary first molars (p = 0.043) and maxillary second molars (p = 0.014)].
contrast to study by Ghaida Al Jamal comparable C/R ratio of maxill BCLP and UCLP patients.
Control
Unilateral cleft lip and palate
Bilateral cleft lip and palate
Root ratio between control and unilateral cleft lip and palate patients, cont cleft lip and palate patients.
Unilateral cleft lip and palate Bilateral cleft lip and palate
N mean s.d s.e P value N Mean
C/R ratio s.d.
43 0.72 0.14 0.04 Sa 0.043 44 0.91 0.20
22 0.70 0.14 0.04 Sa 0.029 17 0.80 0.14
38 0.71 0.15 0.04 NS 0.999 41 0.84 0.19 39 0.65 0.15 0.04 NS 0.871 42 0.78 0.15 39 0.64 0.13 0.04 NS 0.504 46 0.82 0.09 45 0.77 0.12 0.03 NS 0.905 54 0.92 0.22 41 0.85 0.15 0.04 NS 0.994 46 1.03 0.28 43 0.68 0.11 0.03 Sa 0.042 52 0.72 0.14
46 0.68 0.12 0.03 Sa 0.032 54 0.70 0.14
43 0.64 0.10 0.03 NS 0.320 53 0.67 0.13 42 0.70 0.15 0.04 NS 0.130 52 0.72 0.08 42 0.64 0.10 0.03 NS 0.520 52 0.68 0.13 46 0.65 0.12 0.03 NS 0.418 51 0.76 0.16 40 0.68 0.16 0.05 NS 0.889 51 0.79 0.12
It was observed that statistically significant difference existed in Maxillary Central Incisors (p= 0.043), Maxillary Lateral Incisors (p = 0.029), Mandibular Central Incisors (p= 0.042) and Mandibular Lateral Incisors (p= 0.032) when control group was compared with UCLP group. When control group was compared with BCLP group, following teeth showed statistically significant difference.[Maxillary central incisors (p= 0.001), maxillary lateral incisors (p=0.039), maxillary 19), maxillary first premolars (p= 0.035), maxillary second premolars (p= 0.002) and maxillary second molars (p= 0.001), mandibular central incisors (p=0.004), mandibular lateral incisors (p= 0.036), mandibular canines (p=0.044) and mandibular first premolars (p=0.005)]. These findings are similar to those of Ghaida A. Al Jamal et al 18, where control group compared with UCLP, showed significant difference in C/R ratio of maxillary and mandibular incisors. C/R ratio of control group when compared with BCLP, showed significant difference in maxillary incisors, maxillary canines, premolars, maxillary second molars, mandibular incisors, mandibular canines and mandibular first premolars. In contrast our study shows maxillary second premolar to have a highly significant variation (p= 0.002). C/R ratios are higher LP patients than in controls. It is also noticed that C/R ratios of canines, premolars, and molars in both jaws are not affected when UCLP is compared with control group. This unfavourable C/R ratio could be the result of shorter roots rather than longer crowns in CLP patients.
But very few studies have been conducted which investigate crown / root ratios, crown height and root length in CLP patients to be available for comparison.
Table 2 shows the difference in mean C/R ratio between BCLP and UCLP patients. Within the CLP group, BCLP patients showed high and statistically significant C/R ratios in the following teeth [maxillary central incisors (p = 0.01), maxillary s (p=0.02), maxillary canines (p = 0.04), maxillary second premolars (p = 0.002), maxillary first molars (p = 0.043) and maxillary second molars (p = 0.014)]. This is in contrast to study by Ghaida Al Jamal et al 18 who found comparable C/R ratio of maxillary anterior teeth between Root ratio between control and unilateral cleft lip and palate patients, control and bilateral
Bilateral cleft lip and palate
s.d. s.e. P value
0.20 0.06 Sc 0.001
0.14 0.05 Sa 0.039
0.19 0.06 Sa 0.019 0.15 0.05 Sa 0.035
0.09 0.03 Sb 0.002
0.22 0.07 NS 0.107 0.28 0.09 Sc 0.001
0.14 0.04 Sb 0.004
0.14 0.04 Sa 0.036
0.13 0.04 Sa 0.044
0.08 0.03 Sb 0.005
International Journal of Recent Scientific Research
a p ≤ 0.05, b p ≤ 0.01, c p ≤ 0.001
C/R indicates crown-root; s, significant; ns, not significant; s.d, standard standard error; n, number of teeth.
Mandibular central incisors (p = 0.030) and mandibular lateral incisors (p = 0.039) showed statistically significant higher C/R ratio in BCLP than UCLP patients. These findings are in concurrence with Ghaida Al Jamal et al18.
Table 3 shows difference in mean crown heights of all teeth between cleft and control patients. With regard to crown height comparison in control and cleft group, statistically significant
a p ≤ 0.05, b p ≤ 0.01, c p ≤ 0.001
s.d, standard deviation; s, significant; ns, not significant; s.e, standard error; n, number of teeth.
0 0.5 1 1.5
M
e
a
n
C
/R
R
a
ti
o
Tooth Number
Bilateral cleft lip and palate
Unilateral cleft lip and palate
Table 2 Difference in mean Crown-Root ratio between Bilateral cleft lip and
Tooth
Bilateral cleft lip and palate
N
Mean C/R ratio
s.d
11,21 44 0.91 0.20
12,22 17 0.80 0.14
13,23 41 0.84 0.19
14,24 42 0.78 0.15
15,25 46 0.82 0.09
16,26 54 0.92 0.22
17,27 46 1.03 0.28
31,41 52 0.72 0.14
32,42 54 0.70 0.14
33,43 53 0.67 0.13
34,44 52 0.72 0.08
35,45 52 0.68 0.13
36,46 51 0.76 0.16
37,47 51 0.79 0.12
Table 3 Difference in mean crown heights of all teeth between cleft and control patients.
Tooth
Control
N
Mean Crown height (mm)
11,21 59 8.74
12,22 55 8.11
13,23 55 10.22
14,24 53 8.53
15,25 52 8.49
16,26 60 9.30
17,27 58 8.59
31,41 58 7.07
32,42 58 7.29
33,43 56 9.43
34,44 56 8.13
35,45 57 8.20
36,46 60 8.28
37,47 57 8.30
International Journal of Recent Scientific Research Vol. 9, Issue, 4(B), pp. 25603-25611
not significant; s.d, standard deviation; s.e,
Mandibular central incisors (p = 0.030) and mandibular lateral incisors (p = 0.039) showed statistically significant higher C/R ratio in BCLP than UCLP patients. These findings are in
mean crown heights of all teeth between cleft and control patients. With regard to crown height comparison in control and cleft group, statistically significant
s.d, standard deviation; s, significant; ns, not significant; s.e, standard error;
lesser crown height is found in CLP group for maxillary first premolars(p = 0.042), maxillary second premolars (p = 0.035), maxillary first molars (p = 0.024) and mandibular second premolars (p = 0.037). However mandibular central incisors (p = 0.041), mandibular lateral incisors (p = 0.022), have statistically significant greater crown heights in the CLP group. The crowns of some teeth are significantly shorter, but those of other teeth are significantly longer in CLP patients than in control patients. CLP patients having enamel defects and abnormalities in shape and size of both deciduous and permanent teeth are more common than in normal patients. This explains the deviation in crown height from normal in the CLP group. A study by Akcam MO
crown height measurements in the casts of CLP patients were smaller than those of controls not only in the affected maxillary dental arch, but also in the mandibular dental arch. It is important, however, to be aware that study methods varied, that investigators used casts rather than radiographic assessments. Table 4 shows that all the maxillary teeth except maxillary second premolars and maxillary first molars showed shorter root length in CLP group which was statistically significant.[maxillary central incisors (p=0.027), maxillary lateral incisors (p=0.042) and maxillary canines (p=0.037),
maxillary first premolars (p=0.036), maxillary second
molars(p=0.029), mandibular central incisors (p=0.033), mandibular lateral incisors (p=0.041), mandibular first molars (p=0.014)].
Bilateral cleft lip and palate
Unilateral cleft lip and palate
Root ratio between Bilateral cleft lip and palate and Unilateral cleft lip and palate patients.
Bilateral cleft lip and palate Unilateral cleft lip and palate
Mean Difference
s.e N
Mean C/R ratio
s.d s.e
0.06 43 0.72 0.14 0.04 0.19
0.05 22 0.70 0.14 0.04 0.17
0.06 38 0.71 0.15 0.04 0.15
0.05 39 0.65 0.15 0.04 0.14
0.03 39 0.64 0.13 0.04 0.18
0.07 45 0.77 0.12 0.03 0.15
0.09 41 0.85 0.15 0.04 0.24
0.04 43 0.68 0.11 0.03 0.05
0.04 46 0.68 0.12 0.03 0.02
0.04 43 0.64 0.10 0.03 0.03
0.03 42 0.70 0.15 0.04 0.02
0.04 42 0.64 0.10 0.03 0.04
0.05 46 0.65 0.12 0.03 0.11
0.04 40 0.68 0.16 0.05 0.10
Difference in mean crown heights of all teeth between cleft and control patients.
Control Cleft
s.d s.e N
Mean Crown height (mm)
s.d s.e
1.50 0.27 87 8.11 1.09 0.22
1.35 0.24 39 7.97 1.81 0.43
1.13 0.20 79 10.05 1.51 0.32
1.03 0.19 81 7.94 1.25 0.27
1.05 0.20 85 8.13 1.05 0.22
0.91 0.16 99 8.25 1.16 0.24
0.90 0.16 87 8.21 1.12 0.24
0.86 0.16 95 8.34 1.08 0.22
0.76 0.14 100 8.48 0.96 0.19
1.04 0.18 96 9.76 1.08 0.22
1.01 0.18 94 8.35 1.03 0.22
0.95 0.17 94 7.89 1.16 0.24
1.00 0.18 97 8.03 1.48 0.30
1.01 0.18 91 8.25 1.13 0.24
25611, April, 2018
lesser crown height is found in CLP group for maxillary first premolars(p = 0.042), maxillary second premolars (p = 0.035), maxillary first molars (p = 0.024) and mandibular second premolars (p = 0.037). However mandibular central incisors (p dibular lateral incisors (p = 0.022), have statistically significant greater crown heights in the CLP group. The crowns of some teeth are significantly shorter, but those of other teeth are significantly longer in CLP patients than in patients having enamel defects and abnormalities in shape and size of both deciduous and permanent teeth are more common than in normal patients. This explains the deviation in crown height from normal in the CLP group. A study by Akcam MO et al19(2008) showed that crown height measurements in the casts of CLP patients were smaller than those of controls not only in the affected maxillary dental arch, but also in the mandibular dental arch. It is important, however, to be aware that study methods varied, in that investigators used casts rather than radiographic Table 4 shows that all the maxillary teeth except maxillary second premolars and maxillary first molars showed shorter root length in CLP group which was statistically llary central incisors (p=0.027), maxillary lateral incisors (p=0.042) and maxillary canines (p=0.037),
maxillary first premolars (p=0.036), maxillary second
molars(p=0.029), mandibular central incisors (p=0.033), mandibular lateral incisors (p=0.041), mandibular first molars (p=0.014)].
palate and Unilateral cleft lip and palate patients.
Mean Difference
P value
0.19 0.010 Sb
0.17 0.022 Sa
0.15 0.047 Sa
0.14 0.053 NS
0.18 0.002 Sb
0.15 0.043 Sa
0.24 0.014 Sa
0.05 0.030 Sa
0.02 0.039 Sa
0.03 0.881 NS
0.02 0.695 NS
0.04 0.449 NS
0.11 0.077 NS
0.10 0.109 NS
Difference in mean crown heights of all teeth between cleft and control patients.
P value s.e
0.22 NS 0.078
0.43 NS 0.085
0.32 NS 0.091
0.27 Sa 0.042
0.22 Sa 0.035
0.24 Sa 0.024
0.24 NS 0.098
0.22 Sa 0.041
0.19 Sa 0.022
0.22 NS 0.102
0.22 NS 0.121
0.24 Sa 0.037
0.30 NS 0.121
a
p ≤ 0.05, b
p ≤ 0.01, c
p ≤ 0.001
s.d, standard deviation; s.e, standard error; n, number of teeth; s, significant; ns, not significant.
Demirjian’s study20 concluded that mechanisms controlling dental development are independent of somatic and sexual maturity and are highly influenced by the same etiologic factor as the cleft, because some types of environmental insults during tooth development and genetic factors may result in short rooted teeth. CLP patients should be considered as potentially having short roots, resulting in unfavourable C/R ratios and may influence the treatment results. This is in concurrence with the study by Al- Jamal GA et al18 (2010) and Weihua Zhou al21 (2013), who observed that unfavourable C/R ratio in cleft could be due short root length in some teeth and that it is more pronounced in BCLP than in UCLP patients.
a
p ≤ 0.05, b
p ≤ 0.01, c
p ≤ 0.001
s.d, standard deviation; s.e, standard error; n, number of teeth; s, significant; ns, not significant.
0 5 10 15 20 1 1 ,2 1 1 2 ,2 2 1 3 ,2 3 1 4 ,2 4 1 5 ,2 5 1 6 ,2 6 1 7 ,2 7 3 1 ,4 1 3 2 ,4 2 3 3 ,4 3 3 4 ,4 4 3 5 ,4 5 3 6 ,4 6 M e a n r o o t le n g th Tooth Number
Table 5 Difference in mean root length of all teeth between control and Unilateral cleft lip and palate patients.
Tooth
N Mean root length (mm)
11,21 59 15.66
12,22 55 14.98
13,23 55 18.89
14,24 53 15.23
15,25 52 15.10
16,26 60 14.10
17,27 58 13.98
31,41 58 13.22
32,42 58 14.23
33,43 56 17.42
34,44 56 16.92
35,45 57 16.10
36,46 60 16.28
37,47 57 16.12
Table 4 Difference in mean root length of all teeth between cleft a
Tooth
Control
N length (mm)Mean root
11,21 59 15.66
12,22 55 14.98
13,23 55 18.89
14,24 53 15.23
15,25 52 15.10
16,26 60 14.10
17,27 58 13.98
31,41 58 13.22
32,42 58 14.23
33,43 56 17.42
34,44 56 16.92
35,45 57 16.10
36,46 60 16.28
37,47 57 16.12
s.d, standard deviation; s.e, standard error; n, number of teeth; s, significant; ns, not
concluded that mechanisms controlling dental development are independent of somatic and sexual maturity and are highly influenced by the same etiologic factor as the cleft, because some types of environmental insults during ctors may result in short-rooted teeth. CLP patients should be considered as potentially having short roots, resulting in unfavourable C/R ratios and may influence the treatment results. This is in concurrence with ) and Weihua Zhou et (2013), who observed that unfavourable C/R ratio in cleft could be due short root length in some teeth and that it is more pronounced in BCLP than in UCLP patients.
s.d, standard deviation; s.e, standard error; n, number of teeth; s, significant;
Table 5 shows that maxillary central incisors (p=0.016), maxillary lateral incisors (p=0.024) and
incisors (p=0.029), mandibular lateral incisors (p=0.049) in UCLP patients have statistically significant shorter roots than those in control group. Though statistically not significant, the rest of the teeth in both the arches show shor
patients as compared to control group of patients. This again leads us to believe that some genetic influence and environmental insults during formation of roots may be responsible. Table 6 shows that maxillary central incisors (p=0.049), maxillary lateral incisors (p=0.027),
canines (p=0.033), maxillary first premolars
(p=0.045), maxillary second premolars (p=0.016), maxillary second molars (p=0.037) and in mandibular teeth, mandibular
3 6 ,4 6 3 7 ,4 7 Control Cleft 0 5 10 15 20 1 1 ,2 1 1 2 ,2 2 1 3 ,2 3 1 4 ,2 4 1 5 ,2 5 1 6 ,2 6 1 7 ,2 7 3 1 ,4 1 M e a n r o o t le n g th Tooth Number
Difference in mean root length of all teeth between control and Unilateral cleft lip and palate patients.
Control Unilateral Cleft
Mean root
length (mm) s.d s.e N
Mean root
length (mm) s.d s.e
15.66 1.98 0.35 43 14.50 2.06 0.29
14.98 1.97 0.35 22 13.61 2.51 0.38
18.89 2.58 0.46 38 14.70 1.89 0.27
15.23 1.69 0.32 39 13.31 1.76 0.26
15.10 1.86 0.35 39 13.09 1.69 0.24
14.10 1.43 0.25 45 11.91 1.45 0.21
13.98 1.61 0.29 41 11.26 2.33 0.34
13.22 1.68 0.30 43 12.63 2.06 0.29
14.23 1.67 0.30 46 13.02 2.26 0.31
17.42 2.11 0.37 43 14.67 2.17 0.31
16.92 1.70 0.30 42 13.50 1.94 0.28
16.10 1.94 0.35 42 14.05 1.61 0.23
16.28 1.85 0.33 46 15.56 1.93 0.27
16.12 1.48 0.27 40 15.09 2.23 0.33
Difference in mean root length of all teeth between cleft and control patients
Control Cleft
length (mm) s.d s.e N
Mean root
length (mm) s.d s.e
1.98 0.35 87 14.40 2.45 0.50
1.97 0.35 39 13.46 2.21 0.52
2.58 0.46 79 16.25 2.24 0.47
1.69 0.32 81 12.65 2.10 0.46
1.86 0.35 85 11.95 2.22 0.47
1.43 0.25 99 12.98 1.87 0.38
1.61 0.29 87 13.05 2.53 0.54
1.68 0.30 95 11.91 2.27 0.46
1.67 0.30 100 13.13 2.42 0.49
2.11 0.37 96 15.52 2.04 0.42
1.70 0.30 94 15.65 1.70 0.36
1.94 0.35 94 15.96 1.70 0.35
1.85 0.33 97 15.73 1.96 0.39
1.48 0.27 91 15.39 2.38 0.52
Table 5 shows that maxillary central incisors (p=0.016), maxillary lateral incisors (p=0.024) and mandibular central incisors (p=0.029), mandibular lateral incisors (p=0.049) in UCLP patients have statistically significant shorter roots than those in control group. Though statistically not significant, the rest of the teeth in both the arches show shorter roots in UCLP patients as compared to control group of patients. This again leads us to believe that some genetic influence and environmental insults during formation of roots may be Table 6 shows that maxillary central incisors maxillary lateral incisors (p=0.027), maxillary (p=0.033), maxillary first premolars
second premolars (p=0.016), maxillary second molars (p=0.037) and in mandibular teeth, mandibular
3 1 ,4 1 3 2 ,4 2 3 3 ,4 3 3 4 ,4 4 3 5 ,4 5 3 6 ,4 6 3 7 ,4 7 Tooth Number Control Unilateral Cleft
Difference in mean root length of all teeth between control and Unilateral cleft lip and palate patients.
P value
Sa 0.016
Sa 0.024
NS 0.231 NS 0.124 NS 0.221 NS 0.196 NS 0.291 Sa 0.029
Sa 0.049 NS 0.679 NS 0.387 NS 0.315 NS 0.408 NS 0.857
nd control patients
P value
Sa 0.027
Sa 0.042 Sa 0.037
Sa 0.036
NS 0.359 NS 0.674 Sa 0.029 Sa 0.033
Sa 0.041
NS 0.877 NS 0.161 NS 0.094 Sa 0.014
International Journal of Recent Scientific Research
central incisors (p=0.027), mandibular lateral incisors (p=0.044), mandibular canines (p=0.047), mandibular first premolars (p=0.039) in BCLP patients have statistically significant shorter roots than those in control group. This may be due to the fact that the teeth around the cleft are more affected and that BCLP has an increased deformity than UCLP.
a p ≤ 0.05, b p ≤ 0.01, c p ≤ 0.001
s.d, standard deviation; s.e, standard error; n, number of teeth; s, significant; ns, not significant
a p ≤ 0.05, b p ≤ 0.01, c p ≤ 0.001
s.d, standard deviation; s.e, standard error; n, number of teeth; s, significant; ns, not significant
0 5 10 15 20
1
1
,2
1
1
2
,2
2
1
3
,2
3
1
4
,2
4
1
5
,2
5
1
6
,2
6
1
7
,2
7
3
1
,4
1
3
2
,4
2
3
3
,4
3
3
4
,4
4
3
5
,4
5
3
6
,4
6
3
7
,4
7
M
e
a
n
r
o
o
t
le
n
g
th
Tooth Number
Table 6 Difference in mean root length of all teeth between control and Bilateral cleft lip and palate patients.
Tooth
N
Mean root length
(mm)
11,21 59 15.66
12,22 55 14.98
13,23 55 18.89
14,24 53 15.23
15,25 52 15.10
16,26 60 14.10
17,27 58 13.98
31,41 58 13.22
32,42 58 14.23
33,43 56 17.42
34,44 56 16.92
35,45 57 16.10
36,46 60 16.28
37,47 57 16.12
Table 7 Difference in mean crown heights of all teeth between control and Unilateral cleft lip and palate patients.
Tooth
Control
N
Mean Crown height (mm)
11,21 59 8.74
12,22 55 8.11
13,23 55 10.22
14,24 53 8.53
15,25 52 8.49
16,26 60 9.30
17,27 58 8.59
31,41 58 7.07
32,42 58 7.29
33,43 56 9.43
34,44 56 8.13
35,45 57 8.20
36,46 60 8.28
37,47 57 8.30
International Journal of Recent Scientific Research Vol. 9, Issue, 4(B), pp. 25603-25611
(p=0.027), mandibular lateral incisors mandibular canines (p=0.047), mandibular first premolars (p=0.039) in BCLP patients have statistically significant shorter roots than those in control group. This may d the cleft are more affected and that BCLP has an increased deformity than UCLP.
s.d, standard deviation; s.e, standard error; n, number of teeth; s, significant; ns, not
Table 7 shows that maxillary first premolars (p=0.034), maxillary second premolars (p=0.048), maxillary first molars (p=0.027), mandibular central inci
lateral incisors (p=0.016), mandibular second premolars (p=0.012) showed significantly shorter crown heights in UCLP than in control group.
With regards to crown height comparisons, the results were somehow inconsistent in that the tooth crowns were shorter in some cleft patients and longer in some cleft patients.
Control
BIilateral Cleft 0
2 4 6 8 10 12
M
e
a
n
C
r
o
w
n
h
e
ig
h
t
Tooth Number
Difference in mean root length of all teeth between control and Bilateral cleft lip and palate patients.
Control Bilateral Cleft
Mean root length
(mm)
s.d s.e N
Mean root length
(mm)
s.d s.e
15.66 1.98 0.35 44 13.80 2.19 0.32
14.98 1.97 0.35 17 12.86 1.61 0.30
18.89 2.58 0.46 41 14.91 1.96 0.30
15.23 1.69 0.32 42 12.98 2.14 0.32
15.10 1.86 0.35 46 12.86 1.90 0.29
14.10 1.43 0.25 54 11.13 1.87 0.26
13.98 1.61 0.29 46 10.98 2.53 0.39
13.22 1.68 0.30 52 11.84 2.12 0.31
14.23 1.67 0.30 54 12.53 2.34 0.33
17.42 2.11 0.37 53 14.07 1.60 0.23
16.92 1.70 0.30 52 13.21 1.26 0.18
16.10 1.94 0.35 52 13.83 1.69 0.24
16.28 1.85 0.33 51 15.20 1.67 0.24
16.12 1.48 0.27 51 15.04 2.33 0.36
Difference in mean crown heights of all teeth between control and Unilateral cleft lip and palate patients.
Control Unilateral Cleft
height (mm)
s.d s.e N
Mean Crown height (mm)
s.d s.e
1.50 0.27 43 08.32 1.20 0.17
1.35 0.24 22 08.01 1.82 0.28
1.13 0.20 38 9.97 1.37 0.20
1.03 0.19 39 8.30 1.23 0.19
1.05 0.20 39 8.16 1.32 0.19
0.91 0.16 45 9.12 1.28 0.18
0.90 0.16 41 8.64 1.24 0.19
0.86 0.16 43 7.10 1.26 0.18
0.76 0.14 46 7.15 1.05 0.15
1.04 0.18 43 9.20 1.08 0.16
1.01 0.18 42 8.15 1.12 0.16
0.95 0.17 42 8.11 1.21 0.18
1.00 0.18 46 8.75 1.44 0.20
1.01 0.18 40 8.14 1.49 0.23
25611, April, 2018
Table 7 shows that maxillary first premolars (p=0.034), maxillary second premolars (p=0.048), maxillary first molars (p=0.027), mandibular central incisors (p=0.019), mandibular lateral incisors (p=0.016), mandibular second premolars (p=0.012) showed significantly shorter crown heights in UCLP
With regards to crown height comparisons, the results were somehow inconsistent in that the tooth crowns were shorter in some cleft patients and longer in some cleft patients.
Tooth Number
Control
Unilateral Cleft Lip and Palate
Difference in mean root length of all teeth between control and Bilateral cleft lip and palate patients.
P value
Sa 0.049
Sa 0.027
Sa 0.033
Sa 0.045
Sa 0.016
NS 0.182 Sa 0.037
Sa 0.027
Sa 0.044
Sa 0.047
Sa 0.039
NS 0.101 NS 0.067 NS 0.078
Difference in mean crown heights of all teeth between control and Unilateral cleft lip and palate patients.
P value
NS 0.060
NS 0.069
NS 0.065
Sa 0.034
Sa 0.048
Sa 0.027
NS 0.144
Sa 0.019
Sa 0.016
NS 0.074
NS 0.064
Sa 0.012
NS 0.151
a
p ≤ 0.05, b
p ≤ 0.01, c
p ≤ 0.001
s.d, standard deviation; s.e, standard error; n, number of teeth; s, significant; ns, not significant.
In CLP group enamel defects and abnormalities in size and shape of both deciduous and permanent teeth are far more common than in control group. This explains deviation in crown height and root length from normal 6,10,22
Summing up above results, it was observed that root lengths and crown heights were altered in CLP group as compared to control group, thereby altering the C/R ratio.
The study compared the crown-root ratio of UCLP, BCLP and control patients. But, there are limitations of orthopantogram like superimposition and distortion. A few teeth had to be excluded in the CLP patients because of dilacerations, impactions or due to missing teeth. Such exclusion may lead to errors in the interpretation of the results as most of
did not have similar anomalies. However within these limitations, we observed C/R ratio to be higher in UCLP group as compared to control group and it was even higher in BCLP group than UCLP. Further studies with the use of CBCT (Cone Beam Computed Tomography) can lead to a more accurate representation of assessing the crown-root ratio in the patients with CLP.
CONCLUSION
BCLP patients have significantly higher C/R ratio in some teeth than UCLP and Control group.
0 2 4 6 8 10 12
1
1
,2
1
1
3
,2
3
1
5
,2
5
1
7
,2
7
3
2
,4
2
3
4
,4
4
3
6
,4
6
M
e
a
n
C
r
o
w
n
h
e
ig
h
t
Tooth Number
Control
Bilateral Cleft Lip and Palate
Table 8 Difference in mean crown height
Tooth
Control
N
Mean Crown height (mm)
11,21 59 8.74 12,22 55 8.11 13,23 55 10.22 14,24 53 8.53 15,25 52 8.49 16,26 60 9.30 17,27 58 8.59 31,41 58 7.07 32,42 58 7.29 33,43 56 9.43 34,44 56 8.13 35,45 57 8.20 36,46 60 8.28 37,47 57 8.30
In CLP group enamel defects and abnormalities in size and shape of both deciduous and permanent teeth are far more common than in control group. This explains deviation in
6,10,22
.
up above results, it was observed that root lengths and crown heights were altered in CLP group as compared to
root ratio of UCLP, BCLP and tions of orthopantogram like superimposition and distortion. A few teeth had to be excluded in the CLP patients because of dilacerations, impactions or due to missing teeth. Such exclusion may lead to errors in the interpretation of the results as most of the controls did not have similar anomalies. However within these limitations, we observed C/R ratio to be higher in UCLP group as compared to control group and it was even higher in BCLP group than UCLP. Further studies with the use of CBCT (Cone puted Tomography) can lead to a more accurate root ratio in the patients
BCLP patients have significantly higher C/R ratio in some teeth than UCLP and Control group.
UCLP patients have significantly higher C/R ratio because of significantly shorter root length in Maxillary and mandibular Incisors than Control group.
CLP group have similar crown heights and shorter root lengths as compared to control group. Root length is shorter in BCLP than UCLP group.
Therefore during orthodontic treatment modification in biomechanics, using lighter forces and periodic check for root resorption for CLP patients should be considered.
To avoid error of distortion while measuring crown heights and root lengths, C/R ratio was taken into consideration.
References
1. Al Omari F, Al-Omari IK. Cleft lip and palate in Jordan: birth prevalence rate.
journal. 2004 Nov; 41(6):609
2. Fraser FC. The genetics of cleft lip and cleft palate. American journal of human genetics
May;22(3):336.
3. Harris EF, Hullings JG. Delayed dental development in children with isolated cleft lip and palate.
oral biology. 1990 Jan 1;35(6):469
4. Harris EF. Dental development and anomalies in craniosynostoses and facial clefting. Understanding Craniofacial Anomalies. 2002 May 3:423
5. Amarlal D, Muthu MS, Kumar NS. Root development of permanent lateral incisor in cleft lip and palate children: a radiographic study.
Research. 2007 Apr 1;
6. Al Jamal GA, Hazza'a AM, Rawashdeh MA. Prevalence of dental anomalies in a population of cleft lip and palate patients. The Cleft palate
Jul;47(4):413-20.
7. Pioto NR, Costa B, Gomide MR. Dental development of the permanent lateral incisor in patients with incomplete and complete unilateral cleft lip.
craniofacial journal. 2005 Sep;42(5):517 8. Lourenço Ribeiro L, Teixeira das Neves L,
Ribeiro Gomide M. Dental development of permanent lateral incisor in complete unilateral cleft lip and palate.
Control
Bilateral Cleft Lip and Palate
Difference in mean crown heights of all teeth between control and Bilateral cleft lip and palate patients.
Control Bilateral Cleft
s.d s.e N
Mean Crown height (mm)
s.d s.e
1.50 0.27 44 8.25 2.10 0.30
1.35 0.24 17 8.24 1.72 0.32
1.13 0.20 41 10.01 1.33 0.20
1.03 0.20 42 8.39 1.19 0.18
1.05 0.20 46 8.31 0.62 0.09
0.91 0.16 54 9.28 0.82 0.12
0.90 0.16 46 8.60 1.03 0.16
0.86 0.16 52 7.05 0.85 0.12
0.76 0.14 54 7.25 0.80 0.11
1.04 0.18 53 9.33 0.98 0.14
1.01 0.18 52 8.28 0.88 0.13
0.95 0.17 52 8.18 1.00 0.14
1.00 0.18 51 8.39 1.30 0.18
1.01 0.18 51 8.43 0.69 0.10
patients have significantly higher C/R ratio because of significantly shorter root length in Maxillary and mandibular Incisors than Control group.
CLP group have similar crown heights and shorter root lengths as compared to control group. Root length is
orter in BCLP than UCLP group.
Therefore during orthodontic treatment modification in biomechanics, using lighter forces and periodic check-up for root resorption for CLP patients should be To avoid error of distortion while measuring crown ghts and root lengths, C/R ratio was taken into
Omari IK. Cleft lip and palate in Jordan: birth prevalence rate. The Cleft palate-craniofacial
41(6):609-12.
Fraser FC. The genetics of cleft lip and cleft palate. American journal of human genetics. 1970 Harris EF, Hullings JG. Delayed dental development in children with isolated cleft lip and palate. Archives of
. 1990 Jan 1;35(6):469-73.
Harris EF. Dental development and anomalies in craniosynostoses and facial clefting. Understanding Craniofacial Anomalies. 2002 May 3:423-67.
Amarlal D, Muthu MS, Kumar NS. Root development of permanent lateral incisor in cleft lip and palate : a radiographic study. Indian Journal of Dental
18(2):82.
Al Jamal GA, Hazza'a AM, Rawashdeh MA. Prevalence of dental anomalies in a population of cleft lip and palate The Cleft palate-craniofacial journal. 2010 Pioto NR, Costa B, Gomide MR. Dental development of the permanent lateral incisor in patients with incomplete and complete unilateral cleft lip. The Cleft
palate-. 2005 Sep;42(5):517-20palate-.
Lourenço Ribeiro L, Teixeira das Neves L, Costa B, Ribeiro Gomide M. Dental development of permanent lateral incisor in complete unilateral cleft lip and palate.
ilateral cleft lip and palate patients.
P value
NS 0.450 NS 0.061 NS 0.072 Sa 0.020
Sa 0.038
Sa 0.012
NS 0.081 Sb 0.010
Sa 0.019
NS 0.093 NS 0.083 Sa 0.015
International Journal of Recent Scientific Research Vol. 9, Issue, 4(B), pp. 25603-25611, April, 2018
The Cleft palate-craniofacial journal. 2002 Mar;39(2):193-6.
9. Thomas HF. Root formation. Int J Dev Biol. 1995;39:\231-237.
10. Wright T. The molecular control of and clinical variations in root formation. Cells Tissues Organs. 2007 Jul 6;186(1):86-93.
11. Midtbø M, Halse A. Root length, crown height, and root morphology in Turner syndrome. Acta Odontologica Scandinavica. 1994 Jan 1; 52(5):303-14.
12. Hölttä P, Nyström M, Evälahti M, Alaluusua S. Root-crown ratios of permanent teeth in a healthy Finnish population assessed from panoramic radiographs. The European Journal of Orthodontics. 2004 Oct 1;26(5):491-7.
13. Apajalahti S, Hölttä P, Turtola L, Pirinen S. Prevalence of short-root anomaly in healthy young adults. Acta Odontologica Scandinavica. 2002 Jan 1;60(1):56-9. 14. Lind V. Short root anomaly. European Journal of Oral
Sciences. 1972 Apr 1;80(2):85-93.
15. Larheim TA, Svanaes DB, Johannessen S. Reproducibility of radiographs with the orthopantomograph 5: tooth-length assessment. Oral surgery, oral medicine, oral pathology. 1984 Dec 1;58(6):736-41.
16. Brook AH, Holt RD. The relationship of crown length to root length in permanent maxillary central incisors. In Proceedings of the British Paedodontic Society 1977 Dec (Vol. 8, pp. 17-20).
17. Brook AH, Holt RD. The relationship of crown length to root length in permanent maxillary central incisors. In Proceedings of the British Paedodontic Society 1977 Dec (Vol. 8, pp. 17-20).
18. Ghaida A. Al-Jamal, Abdalla M. Hazza'a, and Ma'amon A. Rawashdeh (2010) Crown-root ratio of permanent teeth in cleft lip and palate patients. The Angle Orthodontist: November 2010, Vol. 80, No. 6, pp. 1122-1128.
19. Akcam MO, Toygar TU, Özer L, Özdemir B. Evaluation of 3-dimensional tooth crown size in cleft lip and palate patients. American Journal of Orthodontics and Dentofacial Orthopedics. 2008 Jul 31; 134(1):85-92. 20. Demirjian A, Goldstein H, Tanner JM. A new system of
dental age assessment. Human biology. 1973 May 1:211-27.
21. Zhou W, Li W, Lin J, Liu D, Xie X, Zhang Z. Tooth lengths of the permanent upper incisors in patients with cleft lip and palate determined with cone beam computed tomography. The Cleft Palate-Craniofacial Journal. 2013 Jan; 50(1):88-95.
22. Ranta R. A review of tooth formation in children with cleft lip/palate. American Journal of Orthodontics and Dentofacial Orthopedics. 1986 Jul 1; 90(1):11-8.
How to cite this article:
Lalit Kharadi et al.2018, A Comparative Study of Crown/Root Ratio Between Unilateral And Bilateral Clp Patients And Control Group. Int J Recent Sci Res. 9(4), pp. 25603-25611. DOI: http://dx.doi.org/10.24327/ijrsr.2018.0904.1891