VOLUME NO.6(2016),ISSUE NO.12(
DECEMBER
) ISSN2231-5756A Monthly Double-Blind Peer Reviewed (Refereed/Juried) Open Access International e-Journal - Included in the International Serial Directories
Indexed & Listed at:
Ulrich's Periodicals Directory ©, ProQuest, U.S.A., EBSCO Publishing, U.S.A., Cabell’s Directories of Publishing Opportunities, U.S.A., Google Scholar, Open J-Gage, India [link of the same is duly available at Inflibnet of University Grants Commission (U.G.C.)],
Index Copernicus Publishers Panel, Poland with IC Value of 5.09 & number of libraries all around the world.
Circulated all over the world & Google has verified that scholars of more than 5220 Cities in 187 countries/territories are visiting our journal on regular basis.
VOLUME NO.6(2016),ISSUE NO.12(
DECEMBER
) ISSN2231-5756CONTENTS
Sr.
No.
TITLE & NAME OF THE AUTHOR (S)
Page
No.
1
.
PERFORMANCE MANAGEMENT SYSTEM IN TELECOM INDUSTRY: COMPARISON OF INDIAN PUBLIC
AND PRIVATE SECTOR UNDERTAKINGS
ADITYA GAUTAM & SAMEEKSHA JAIN
1
2
.
SUPREME COURT OF INDIA ON GROUNDS OF SETTING ASIDE ARBITRAL AWARD
SUDHIR S. KOTWAL & DR. ASMITA A. VAIDYA
6
3
.
PERFORMANCE EVALUATION OF THE CYBERAGE SCHEME IN GOA: STUDENTS’ PERSPECTIVE
DR. GAJANAN MADIWAL
10
4
.
INFORMATION MANAGEMENT SYSTEM IN THE LIVELIHOOD PROJECT
DR. VIJAY KUMAR & AJAY PUROHIT
13
5
.
TESTING WEAK FORM OF EFFICIENT MARKET HYPOTHESIS IN INDIA: WITH SPECIAL REFERENCE TO
NIFTY MIDCAP 50 INDEX BASED COMPANIES
DR. N. N. PANDEY
18
6
.
THE RETAIL AVALANCHE: A STUDY ON CUSTOMER PERCEPTION
ZOHEB ALI K & DR. RASHMI KODIKAL
22
7
.
INVESTORS ATTITUDE TOWARDS SAFETY AS AN IMPORTANT CRITERION FOR MUTUAL FUND
INVESTMENT – WITH SPECIAL REFERENCE TO CHENNAI CITY
S. PRASANNA KUMAR & DR. T. JOSEPH
27
8
.
FDI IN INDIAN RETAIL SECTOR: BOON OR BANE?
YASMIN BEGUM R. NADAF & SHAMSHUDDIN M. NADAF
32
9
.
UNDERSTANDING THE RELATIONSHIP BETWEEN ETHICAL LEADERSHIP BEHAVIOR AND ETHICAL
CLIMATE IN PRIVATE SECTOR BANKS IN ERNAKULAM DISTRICT
ROHINI. S. NAIR & SMITHA RAJAPPAN
36
10
.
A STUDY ON LECTURERS’ PERCEPTION OF STUDENTS’ FEEDBACK ON COURSES AND TEACHING WITH
REFERENCE TO PRIVATE INSTITUTIONS IN BANGALORE CITY
ASHA RANI.K
39
11
.
THE CHANGING DYNAMICS OF TALENT ACQUISITION IN RECRUITMENT SERVICE CENTERS: A
CONCEPTUAL STUDY
NAMITHA.S
45
12
.
THE AMALGAMATION OF SBI AND ITS SUBSIDIARIES: OPPORTUNITIES AND CHALLENGES
ANAND DHANANJAY WALSANGKAR
49
13
.
ORGANIZATIONAL RESOURCES AND CAPABILITIES FOR KNOWLEDGE STRATEGY IN HIGH VELOCITY
ENVIRONMENTS: THE PERSPECTIVE OF BUSINESS STRATEGY ALIGNMENT
K.UMA LAKSHMI & DR. SUMITHA K
53
14
.
FINANCIAL DISTRESS AND ITS IMPACT ON STOCK PRICES OF MINING SECTOR FIRMS IN INDONESIA
STOCK EXCHANGE
FITRI WAHYUNI, LUKYTAWATI ANGGRAENI & TONY IRAWAN
59
15
.
DISTRICT WISE SITUATION OF THE CHILD LABOUR (AGE 5-14) IN ANDHRA PRADESH
DR. PARUPALLY ANJANEYULU & SRIPARNA BANERJEE
65
16
.
INVESTIGATION OF UNEMPLOYMENT REGISTRATION SYSTEM IN ADDIS ABABA: THE CASE OF BOLE,
ARADA AND YEKA SUB-CITIES
WUBALEM SERAW GEZIE
71
17
.
POVERTY: A COLOSSAL PEST IN INDIA
KHEM RAJ
77
18
.
EXTRADITION AND LAW
SHREEMANSHU KUMAR DASH
83
19
.
COMPARATIVE ANALYSIS OF FARMERS’ SUICIDE IN ODISHA WITH INDIA
IPSITA PRIYADARSINI PATTANAIK
86
20
.
NEED FOR CHANGE IN THE HISTORICAL LEGACY OF CURRENT FINANCIAL YEAR
GUNEEV BRAR
91
VOLUME NO.6(2016),ISSUE NO.12(
DECEMBER
) ISSN2231-5756INTERNATIONAL JOURNAL OF RESEARCH IN COMMERCE, IT & MANAGEMENT
CHIEF PATRON
PROF. K. K. AGGARWAL
Chairman, Malaviya National Institute of Technology, Jaipur
(An institute of National Importance & fully funded by Ministry of Human Resource Development, Government of India)
Chancellor, K. R. Mangalam University, Gurgaon
Chancellor, Lingaya’s University, Faridabad
Founder Vice-Chancellor (1998-2008), Guru Gobind Singh Indraprastha University, Delhi
Ex. Pro Vice-Chancellor, Guru Jambheshwar University, Hisar
FOUNDER PATRON
LATE SH. RAM BHAJAN AGGARWAL
Former State Minister for Home & Tourism, Government of Haryana
Former Vice-President, Dadri Education Society, Charkhi Dadri
Former President, Chinar Syntex Ltd. (Textile Mills), Bhiwani
FORMER CO-ORDINATOR
DR. S. GARG
Faculty, Shree Ram Institute of Business & Management, Urjani
ADVISORS
PROF. M. S. SENAM RAJU
Director A. C. D., School of Management Studies, I.G.N.O.U., New Delhi
PROF. M. N. SHARMA
Chairman, M.B.A., Haryana College of Technology & Management, Kaithal
PROF. S. L. MAHANDRU
Principal (Retd.), Maharaja Agrasen College, Jagadhri
EDITOR
PROF. R. K. SHARMA
Professor, Bharti Vidyapeeth University Institute of Management & Research, New Delhi
CO-EDITOR
DR. BHAVET
Faculty, Shree Ram Institute of Engineering & Technology, Urjani
EDITORIAL ADVISORY BOARD
DR. RAJESH MODI
Faculty, Yanbu Industrial College, Kingdom of Saudi Arabia
PROF. SANJIV MITTAL
University School of Management Studies, Guru Gobind Singh I. P. University, Delhi
PROF. ANIL K. SAINI
Chairperson (CRC), Guru Gobind Singh I. P. University, Delhi
DR. SAMBHAVNA
VOLUME NO.6(2016),ISSUE NO.12(
DECEMBER
) ISSN2231-5756DR. MOHENDER KUMAR GUPTA
Associate Professor, P. J. L. N. Government College, Faridabad
DR. SHIVAKUMAR DEENE
Asst. Professor, Dept. of Commerce, School of Business Studies, Central University of Karnataka, Gulbarga
ASSOCIATE EDITORS
PROF. NAWAB ALI KHAN
Department of Commerce, Aligarh Muslim University, Aligarh, U.P.
PROF. ABHAY BANSAL
Head, Department of I.T., Amity School of Engineering & Technology, Amity University, Noida
PROF. A. SURYANARAYANA
Department of Business Management, Osmania University, Hyderabad
PROF. V. SELVAM
SSL, VIT University, Vellore
DR. PARDEEP AHLAWAT
Associate Professor, Institute of Management Studies & Research, Maharshi Dayanand University, Rohtak
DR. S. TABASSUM SULTANA
Associate Professor, Department of Business Management, Matrusri Institute of P.G. Studies, Hyderabad
SURJEET SINGH
Asst. Professor, Department of Computer Science, G. M. N. (P.G.) College, Ambala Cantt.
FORMER TECHNICAL ADVISOR
AMITA
Faculty, Government M. S., Mohali
FINANCIAL ADVISORS
DICKIN GOYAL
Advocate & Tax Adviser, Panchkula
NEENA
Investment Consultant, Chambaghat, Solan, Himachal Pradesh
LEGAL ADVISORS
JITENDER S. CHAHAL
Advocate, Punjab & Haryana High Court, Chandigarh U.T.
CHANDER BHUSHAN SHARMA
Advocate & Consultant, District Courts, Yamunanagar at Jagadhri
SUPERINTENDENT
VOLUME NO.6(2016),ISSUE NO.12(
DECEMBER
) ISSN2231-5756INTERNATIONAL JOURNAL OF RESEARCH IN COMMERCE, IT & MANAGEMENT
CALL FOR MANUSCRIPTS
We invite unpublished novel, original, empirical and high quality research work pertaining to the recent developments & practices in the areas of Com-puter Science & Applications; Commerce; Business; Finance; Marketing; Human Resource Management; General Management; Banking; Economics; Tourism Administration & Management; Education; Law; Library & Information Science; Defence & Strategic Studies; Electronic Science; Corporate Gov-ernance; Industrial Relations; and emerging paradigms in allied subjects like Accounting; Accounting Information Systems; Accounting Theory & Practice; Auditing; Behavioral Accounting; Behavioral Economics; Corporate Finance; Cost Accounting; Econometrics; Economic Development; Economic History; Financial Institutions & Markets; Financial Services; Fiscal Policy; Government & Non Profit Accounting; Industrial Organization; International Economics & Trade; International Finance; Macro Economics; Micro Economics; Rural Economics; Co-operation; Demography: Development Planning; Development Studies; Applied Economics; Development Economics; Business Economics; Monetary Policy; Public Policy Economics; Real Estate; Regional Economics; Political Science; Continuing Education; Labour Welfare; Philosophy; Psychology; Sociology; Tax Accounting; Advertising & Promotion Management; Management Information Systems (MIS); Business Law; Public Responsibility & Ethics; Communication; Direct Marketing; E-Commerce; Global Business; Health Care Administration; Labour Relations & Human Resource Management; Marketing Research; Marketing Theory & Applications; Non-Profit Or-ganizations; Office Administration/Management; Operations Research/Statistics; Organizational Behavior & Theory; Organizational Development; Pro-duction/Operations; International Relations; Human Rights & Duties; Public Administration; Population Studies; Purchasing/Materials Management; Re-tailing; Sales/Selling; Services; Small Business Entrepreneurship; Strategic Management Policy; Technology/Innovation; Tourism & Hospitality; Transpor-tation Distribution; Algorithms; Artificial Intelligence; Compilers & Translation; Computer Aided Design (CAD); Computer Aided Manufacturing; Computer Graphics; Computer Organization & Architecture; Database Structures & Systems; Discrete Structures; Internet; Management Information Systems; Mod-eling & Simulation; Neural Systems/Neural Networks; Numerical Analysis/Scientific Computing; Object Oriented Programming; Operating Systems; Pro-gramming Languages; Robotics; Symbolic & Formal Logic; Web Design and emerging paradigms in allied subjects.
Anybody can submit the soft copy of unpublished novel; original; empirical and high quality research work/manuscriptanytime in M.S. Word format after preparing the same as per our GUIDELINES FOR SUBMISSION; at our email address i.e. [email protected] or online by clicking the link online submission as given on our website (FOR ONLINE SUBMISSION, CLICK HERE).
GUIDELINES FOR SUBMISSION OF MANUSCRIPT
1. COVERING LETTER FOR SUBMISSION:
DATED: _____________
THE EDITOR
IJRCM
Subject: SUBMISSION OF MANUSCRIPT IN THE AREA OF .
(e.g. Finance/Mkt./HRM/General Mgt./Engineering/Economics/Computer/IT/ Education/Psychology/Law/Math/other, please specify)
DEAR SIR/MADAM
Please find my submission of manuscript titled ‘___________________________________________’ for likely publication in one of your journals.
I hereby affirm that the contents of this manuscript are original. Furthermore, it has neither been published anywhere in any language fully or partly, nor it is under review for publication elsewhere.
I affirm that all the co-authors of this manuscript have seen the submitted version of the manuscript and have agreed to inclusion of their names as co-authors.
Also, if my/our manuscript is accepted, I agree to comply with the formalities as given on the website of the journal. The Journal has discretion to publish our contribution in any of its journals.
NAME OF CORRESPONDING AUTHOR :
Designation/Post* :
Institution/College/University with full address & Pin Code : Residential address with Pin Code : Mobile Number (s) with country ISD code : Is WhatsApp or Viber active on your above noted Mobile Number (Yes/No) : Landline Number (s) with country ISD code :
E-mail Address :
Alternate E-mail Address :
Nationality :
VOLUME NO.6(2016),ISSUE NO.12(
DECEMBER
) ISSN2231-5756 NOTES:a) The whole manuscript has to be in ONE MS WORD FILE only, which will start from the covering letter, inside the manuscript. pdf. version is liable to be rejected without any consideration.
b) The sender is required to mention the following in the SUBJECT COLUMNof the mail:
New Manuscript for Review in the area of (e.g. Finance/Marketing/HRM/General Mgt./Engineering/Economics/Computer/IT/ Education/Psychology/Law/Math/other, please specify)
c) There is no need to give any text in the body of the mail, except the cases where the author wishes to give any specific message w.r.t. to the manuscript.
d) The total size of the file containing the manuscript is expected to be below 1000 KB.
e) Only the Abstract will not be considered for review and the author is required to submit the complete manuscript in the first instance.
f) The journal gives acknowledgement w.r.t. the receipt of every email within twenty-four hours and in case of non-receipt of acknowledgment from the journal, w.r.t. the submission of the manuscript, within two days of its submission, the corresponding author is required to demand for the same by sending a separate mail to the journal.
g) The author (s) name or details should not appear anywhere on the body of the manuscript, except on the covering letter and the cover page of the manuscript, in the manner as mentioned in the guidelines.
2. MANUSCRIPT TITLE: The title of the paper should be typed in bold letters, centeredand fully capitalised.
3. AUTHOR NAME (S) & AFFILIATIONS: Author (s) name, designation, affiliation (s), address, mobile/landline number (s), and email/al-ternate email address should be given underneath the title.
4. ACKNOWLEDGMENTS: Acknowledgements can be given to reviewers, guides, funding institutions, etc., if any.
5. ABSTRACT: Abstract should be in fully Italic printing, ranging between 150 to 300 words. The abstract must be informative and eluci-dating the background, aims, methods, results & conclusion in a SINGLE PARA. Abbreviations must be mentioned in full.
6. KEYWORDS: Abstract must be followed by a list of keywords, subject to the maximum of five. These should be arranged in alphabetic order separated by commas and full stop at the end. All words of the keywords, including the first one should be in small letters, except special words e.g. name of the Countries, abbreviations etc.
7. JEL CODE: Provide the appropriate Journal of Economic Literature Classification System code (s). JEL codes are available at www.aea-web.org/econlit/jelCodes.php. However, mentioning of JEL Code is not mandatory.
8. MANUSCRIPT: Manuscript must be in BRITISH ENGLISH prepared on a standard A4 size PORTRAIT SETTING PAPER. It should be free from any errors i.e. grammatical, spelling or punctuation. It must be thoroughly edited at your end.
9. HEADINGS: All the headings must be bold-faced, aligned left and fully capitalised. Leave a blank line before each heading.
10. SUB-HEADINGS: All the sub-headings must be bold-faced, aligned left and fully capitalised.
11. MAIN TEXT:
THE MAIN TEXT SHOULD FOLLOW THE FOLLOWING SEQUENCE:
INTRODUCTION
REVIEW OF LITERATURE
NEED/IMPORTANCE OF THE STUDY
STATEMENT OF THE PROBLEM
OBJECTIVES
HYPOTHESIS (ES)
RESEARCH METHODOLOGY
RESULTS & DISCUSSION
FINDINGS
RECOMMENDATIONS/SUGGESTIONS
CONCLUSIONS
LIMITATIONS
SCOPE FOR FURTHER RESEARCH
REFERENCES
APPENDIX/ANNEXURE
VOLUME NO.6(2016),ISSUE NO.12(
DECEMBER
) ISSN2231-5756INTERNATIONAL JOURNAL OF RESEARCH IN COMMERCE, IT & MANAGEMENT
12. FIGURES & TABLES: These should be simple, crystal CLEAR, centered, separately numbered & self-explained, and the titles must be above the table/figure. Sources of data should be mentioned below the table/figure. It should be ensured that the tables/figures are referred to from the main text.
13. EQUATIONS/FORMULAE: These should be consecutively numbered in parenthesis, left aligned with equation/formulae number placed at the right. The equation editor provided with standard versions of Microsoft Word may be utilised. If any other equation editor is utilised, author must confirm that these equations may be viewed and edited in versions of Microsoft Office that does not have the editor.
14. ACRONYMS: These should not be used in the abstract. The use of acronyms is elsewhere is acceptable. Acronyms should be defined on its first use in each section e.g. Reserve Bank of India (RBI). Acronyms should be redefined on first use in subsequent sections.
15. REFERENCES: The list of all references should be alphabetically arranged. The author (s) should mention only the actually utilised references in the preparation of manuscript and they may follow Harvard Style of Referencing. Also check to ensure that everything that you are including in the reference section is duly cited in the paper. The author (s) are supposed to follow the references as per the following:
•
All works cited in the text (including sources for tables and figures) should be listed alphabetically.•
Use (ed.) for one editor, and (ed.s) for multiple editors.•
When listing two or more works by one author, use --- (20xx), such as after Kohl (1997), use --- (2001), etc., in chronologically ascending order.•
Indicate (opening and closing) page numbers for articles in journals and for chapters in books.•
The title of books and journals should be in italic printing. Double quotation marks are used for titles of journal articles, book chapters, dissertations, reports, working papers, unpublished material, etc.•
For titles in a language other than English, provide an English translation in parenthesis.•
Headers, footers, endnotes and footnotes should not be used in the document. However, you can mention short notes to elucidate some specific point, which may be placed in number orders before the references.PLEASE USE THE FOLLOWING FOR STYLE AND PUNCTUATION IN REFERENCES:
BOOKS
•
Bowersox, Donald J., Closs, David J., (1996), "Logistical Management." Tata McGraw, Hill, New Delhi.•
Hunker, H.L. and A.J. Wright (1963), "Factors of Industrial Location in Ohio" Ohio State University, Nigeria. CONTRIBUTIONS TO BOOKS•
Sharma T., Kwatra, G. (2008) Effectiveness of Social Advertising: A Study of Selected Campaigns, Corporate Social Responsibility, Edited by David Crowther & Nicholas Capaldi, Ashgate Research Companion to Corporate Social Responsibility, Chapter 15, pp 287-303.JOURNAL AND OTHER ARTICLES
•
Schemenner, R.W., Huber, J.C. and Cook, R.L. (1987), "Geographic Differences and the Location of New Manufacturing Facilities," Jour-nal of Urban Economics, Vol. 21, No. 1, pp. 83-104.CONFERENCE PAPERS
•
Garg, Sambhav (2011): "Business Ethics" Paper presented at the Annual International Conference for the All India Management Asso-ciation, New Delhi, India, 19–23UNPUBLISHED DISSERTATIONS
•
Kumar S. (2011): "Customer Value: A Comparative Study of Rural and Urban Customers," Thesis, Kurukshetra University, Kurukshetra. ONLINE RESOURCES•
Always indicate the date that the source was accessed, as online resources are frequently updated or removed. WEBSITESVOLUME NO.6(2016),ISSUE NO.12(
DECEMBER
) ISSN2231-5756TESTING WEAK FORM OF EFFICIENT MARKET HYPOTHESIS IN INDIA: WITH SPECIAL REFERENCE TO NIFTY
MIDCAP 50 INDEX BASED COMPANIES
DR. N. N. PANDEY
ASSOCIATE PROFESSOR
IMS UNISON UNIVERSITY
DEHRADUN
ABSTRACT
The purpose of this paper is to examine the weak form efficiency of NIFTY Midcap 50 index based companies, thereby making a humble contribution to the existing body of knowledge in the field of efficient market hypothesis (EMH). To test the weak form of efficiency weekly closing prices of twenty sample companies have been considered for three years starting from 1st April 2012 to 31st March 2015. Various statistical tests viz. Kolmogrov – Smirnov Goodness of Fit Test, Serial
Correlation Test and Run Test have been conducted for the results. The study concludes that share price movements of companies under NIFTY Midcap 50 are not random during the study period. That means the weak form of efficient market hypothesis does not hold good for NIFTY Midcap 50 index based companies.
KEYWORDS
efficient market hypothesis, fundamental analysis, technical analysis, serial correlation test, run test.
INTRODUCTION
he movement in stock prices are effected by fundamental factors, past behaviour of stock prices popularly known as technical factors and psychological factors. Generally, Stock prices are predicted with the help of two prominent methods i.e. fundamental analysis and technical analysis. A fundamental analyst believes that the price of a share changes due to change in the fundamental factors affecting the performance of economy, industry and companies. Hence, he tries to find out the intrinsic value of the share before taking any investment decisions by analysing the economy fundamentals, industry fundamentals and company fundamentals. He prefers to buy the share if the market price of the share is lower than intrinsic value and sale the share if the market price of the share is higher than intrinsic value. In contrast, a technical analyst believes that the future prices of a share can be predicted by analysing the behaviour of its past prices. Hence, he tries to ascertain a trend from past traded prices and uses this trend to take his investment decision. The basic assumption of technical analysis is that stock price movement is orderly and not random. But there is a theory which questions this assumption. This theory suggests that the movement in share prices are random rather than orderly. That’s why in early stage this theory came to known as Random Walk Theory. According to this theory, the successive changes in share prices are dependent on the new pieces of information but independent from its past trends. The share markets are so efficient that any changes in the economy, industry and company performance are immediately reflected in the share prices. Thus, the basic assumption of the random walk theory is that the stock markets are efficient. Hence, this theory later came to be known as the efficient market theory or efficient market hypothesis (EMH). Allen, Brealey and Myers (2011) defined a market as efficient when it was not possible to earn consistently a return higher than the market return. In other words, the value of shares reflects the fair value of the company and is equal to the future cash flows discounted by cost of capital. Eakins and Mishkin (2012) argued that an efficient market was a market where asset prices fully reflected all information available.
EMH assumes three form of efficiency viz. weak form of efficiency, semi-strong form of efficiency and strong form of efficiency. A market is considered efficient in weak form only when each successive price is independent of the past prices. Every change in the share prices is completely random and depend on the new pieces of information rather than on past price trends. That means there is no benefit in conducting technical analysis as it relies on studying and establishing the trends based on historical share price data. A market is considered to be efficient in semi-strong form when current prices of stocks reflect not only historical contents but all publicly available information about the company, industry and economy. That means stock prices discount all latest information as soon as they are received. Hence there is no benefit in undertaking fundamental analysis. A market is considered to be efficient in strong form when current prices of stocks reflect not only publicly available information but also private or inside information. It is the most efficient form of market. In this type of market no information whether it is public or inside can be used to earn superior results consistently.
Several studies have been conducted in India to test the three forms of efficient market hypothesis. Many studies provide strong support for efficient market hypothesis but there are contradictory results too. However, most of the studies have been conducted taking either indices (Sensex for BSE and Nifty for NSE) or large-cap stocks. Hardly, one comes across with any study taking Midcap stocks as a sample. Keeping this in view the present research has been conducted to test empirically the weak form efficiency of Indian capital market with special reference to NIFTY Midcap 50 index based companies.
OBJECTIVES OF THE STUDY
The objectives of the present study are to:
1. To test whether share price movements of companies under study are random and independent within study periods.
2. To test empirically whether the weak form of efficient market hypothesis holds good for NIFTY Midcap 50 index based companies.
It is believed that the findings of the study will of use to investors in taking investment decisions and to the academia in understanding of efficient market theory in Indian context.
REVIEW OF LITERATURE
Eugene F. Fama (1970) one of the pioneer of the concept of “Efficient Capital Market” to the finance world, suggested that in efficient market, the current market price fully reflects all available information about a security and the expected return is commensurate with its risk. Hence it is nearly impossible to beat the market consistently. Fama segregated the efficient market hypothesis between three sub-hypotheses viz. weak form, semi-strong form and strong form of efficiency. Jensen (1978) famously wrote, ‘I believe there is no other proposition in economics which has more solid empirical evidence supporting it than the Efficient Market Hypothesis.’ He defines efficiency thus: ‘A market is efficient with respect to information set θt if it is impossible to make economic profits by trading on the basis of information set θt.’’
Grossman and Stiglitz (1980) argued that perfectly informationally efficient markets are impossibilityfor, if markets are perfectly efficient, there is no profit to gathering information, in which case there would be little reason to trade and markets would eventually collapse.
De Bondt and Richard Thaler (1985) showed that stock prices overreact, evidencing substantial weak form market inefficiencies.
Poterba and summers (1988) discovered that stock returns show positive autocorrelation over short periods and negative autocorrelation over longer horizons. Lo and MacKinlay (1999), in a book entitled A Non-Random Walk Down Wall Street, have found evidence inconsistent with the random walk model. Calculating weekly and monthly holding period returns for various stock indexes, they find evidence of positive serial correlation, implying that there is some momentum in stock prices.
Shleifer (2000) published “Inefficient Markets: An Introduction to Behavioral Finance”, which questions the assumptions of investor rationality and perfect arbi-trage.
VOLUME NO.6(2016),ISSUE NO.12(
DECEMBER
) ISSN2231-5756INTERNATIONAL JOURNAL OF RESEARCH IN COMMERCE, IT & MANAGEMENT
Malkiel (2003) studied the various criticism of EMH and found that stock markets are far more efficient and far less predictable than some recent academic papers would have us believe.
Madhumita Chakraborty (2006) investigated the stock price behaviour using daily closing figures of Milanka Price Index during January 1991 to December 2001 and daily closing prices of twenty-five underlying individuals companies included in the index from July 1991 to May 1999. The study found that stock market in Sri-lanka did not follow random walk,
Abdulnasser and Morgan (2009) conducted the test for informational efficiency in the Australian stock market. Using daily data for the period 1994-2006, test were carried out using robust methods that are not sensitive to either non-normality in the data or the presence of ARCH effects. They found that the share price index has one unit root, which implies that the changes in the share price index are totally random.
In India, various earlier studies on efficiency of stock market have been carried out and many of them confirmed that the Indian stock markets are efficient in 'weak' form, and that the random walk hypothesis theory holds good (Gupta,1979; Sharma, 1983; Barua & Raghunathan, 1986; Yalawar,1988). However, there are other studies also which do not support weak form of efficiency (Kulkarni, 1978; Chaudhury, 1991).
Madhusudan (1998) found that BSE sensitivity and national indices did not follow random walk.
Pradhan et al. (2009) in their paper tried to examine the Efficient Market Hypothesis (EMH) in its weak - form by employing the unit root test on the sample of daily stock returns of National Stock Exchange (NSE) and Bombay Stock Exchange (BSE). The sample period lies between January 2007 to July 2009. The study reveals that Indian Stock market is not weak - form efficient.
Das and Pattanaik (2011) studied data of Nifty fifty, Nifty junior, Sensex and BSE-100 from 1999 to 2011 and used Run Test and Autocorrelation Function (ACF) and concluded that the Indian market is not weak form efficient.
Saqib and Hanif (2012) examined the weak form of efficient market hypothesis on the four major stock exchanges of South Asia including, India, Pakistan, Bangla-desh and Sri Lanka. Historical index values on a monthly, weekly and daily basis for a period of 14 Years (1997-2011) were used for analysis. They applied four statistical tests including runs test, serial correlation, unit root and variance ratio test. The findings suggest that none of the four major stock markets of south-Asia follows Random-walk and hence all these markets are not the weak form of efficient market.
RESEARCH METHODOLOGY
The universe of our study is all the fifty companies which comprise NIFTY Midcap 50 index (of National Stock Exchange of India) as on 31st March 2015. The primary objective of the Nifty Midcap 50 Index is to capture the movement of the midcap segment of the market. The Nifty Midcap 50 Index represents about 5.42% of the free float market capitalization of the stocks listed on NSE as on March 31, 2015. A Sample of twenty companies has been selected with the help of random sampling method to collect the data. Those twenty companies are ABIRLA, ALLAHABAD BANK, ASHOKE LEYLAND, BANK OF INDIA, BIOCON, CESC, GMAINFRA, GODREJIND, HINDPETRO, INDIACEM, JSWENERGY, L&T FINANCE, MRF, RELIANCE CAPITAL, SAIL, SIEMENS, TATA CHEMICALS, TVS, UNITECH, and VOLTAS. Weekly closing prices of all the above-mentioned companies have been collected for three years starting from 1st April 2012 to 31st March 2015 (Source: www.ya-hoofinance.com). Any change in share prices due to announcement of bonus, rights, dividends and splitting of stocks have been suitably adjusted. Lo and Mackinlay (1988) suggest that weekly and monthly data are superior to daily figures since they are free from sampling problems of biases due to bid-ask spreads, non-trading, etc. inherent in the daily prices. To test whether the weak form of efficient market hypothesis holds good for NIFTY Midcap 50 index based companies, three kinds of statistical tests have been conducted. Kolmogrov – Smirnov Goodness of Fit Test has been used to check the normality of data. In the parametric test, serial correlation coefficients have been computed whereas; Runs test has been used as non-parametric test.
HYPOTHESES
Following are the null hypotheses:
1. Share price movements of companies under NIFTY Midcap 50 are random.
2. The weak form of efficient market hypothesis holds good for NIFTY Midcap 50 index based companies.
ANALYSIS AND FINDINGS
KOLMOGROV – SMIRNOV GOODNESS OF FIT TEST
Kolmogrov – Smirnov Goodness of Fit Test is a non parametric test which is used to determine whether the data follow particular distribution (Uniform, Normal or Poisson). It is based on the comparison of samples’ cumulative distribution against the standard cumulative function for each distribution. Here normal distri-bution has been used.
From Table-1, it reflects that in case of twelve companies viz. (ABIRLA, ASHOKE LEYLAND, BIOCON, CESC, HINDPETRO, JSWENERGY, MRF, RELIANCE CAPITAL, SIEMENS, TATA CHEMICALS, TVS and VOLTAS) the value of P is insignificant at 5% significance level. That means the data is not normally distributed. However, for the balance eight companies viz. (ALLAHABAD BANK, BANK OF INDIA, GMAINFRA, GODREJIND, INDIACEM, L&T FINANCE, SAIL, and UNITECH) the value of P is significant at 5% significance level. That means the data is normally distributed.
TABLE – 1: KOLMOGROV SMIRNOV TEST
Name of Company Parameters Absolute Positive Negative K-S-Z P Value
ABIRLA Normal .138 .138 -.109 1.735 .005
ALLAHABAD BANK Normal .086 .062 -.086 1.084 .191
ASHOKE LEYLAND Normal .225 .225 -.133 2.823 .000
BANK OF INDIA Normal .100 .050 -.100 1.252 .087
BIOCON Normal .186 .186 -.162 2.331 .000
CESC Normal .220 .220 -.125 2.752 .000
GMAINFRA Normal .102 .102 -.066 1.275 .077
GODREJIND Normal .059 .052 -.059 0.736 .650
HINDPETRO Normal .237 .237 -.105 2.963 .000
INDIACEM Normal .084 .084 -.068 1.049 .221
JSWENERGY Normal .176 .176 -.109 2.205 .000
L&T FINANCE Normal .072 .072 -.039 0.900 .392
MRF Normal .179 .179 -.158 2.240 .000
RELIANCE CAPITAL Normal .176 .176 -.101 2.202 .000
SAIL Normal .095 .058 -.095 1.195 .115
SIEMENS Normal .154 .154 -.079 1.929 .001
TATA CHEMICALS Normal .182 .182 -.093 2.281 .000
TVS Normal .260 .260 -.217 3.255 .000
UNITECH Normal .089 .089 -.064 1.114 .167
VOLUME NO.6(2016),ISSUE NO.12(
DECEMBER
) ISSN2231-5756 The importance of testing of normality of data lies in the fact that parametric test like serial correlation is of no use if data is not normally distributed. In those cases it is appropriate to use non-parametric test like Run Test. Hence in this study for eight companies viz. (ALLAHABAD BANK, BANK OF INDIA, GMAINFRA, GODREJIND, INDIACEM, L&T FINANCE, SAIL, and UNITECH) where data is normally distributed serial correlation test as well as Run Test have been used. For rest of twelve companies viz. (ABIRLA, ASHOKE LEYLAND, BIOCON, CESC, HINDPETRO, JSWENERGY, MRF, RELIANCE CAPITAL, SIEMENS, TATA CHEMICALS, TVS and VOLTAS) where data is not normally distributed only Run Test has been used.SERIAL CORRELATION TEST
Serial correlation test is a parametric test which is used to find out auto correlation between current and previous data. If the correlation between current data and previous data is significantly positive then we infer that there exists certain trend in the data. Hence there is non-randomness in the data. If it is significantly negative then, we still infer that there is certain reverse relationship in the data, implying non-randomness in the data, if correlation between current and previous data is zero, only then we can infer that there is randomness in the data. For testing significance of autocorrelation Durbin-Watson test has been selected. The value of Durbin-Watson test static ‘d’ always lies between 0 - 4.If value of ‘d’ is substantially less than 2, then there is evidence that data series has positive autocorrelation, and if the ‘d’ is substantially greater than 2, then there is evidence that data series has negative auto-correlation, As a rule of thumb, if value of ‘d’ is less than 1 then it signifies strong positive correlation, and if it is greater than 3 then it signifies strong negative correlation. The Table-2 below shows the results of Durbin-Watson test for eight companies mentioned above. All the calculated ‘d’ values are lower than 1, which signify that there exists a strong positive autocorrelation in the data (share prices). That means there is no randomness in the movement of share prices of those companies. Hence our null hypothesis ‘share price movements of companies under NIFTY Midcap 50 are random’ is rejected. This implies that the weak form of efficient market hypothesis does not hold good for NIFTY Midcap 50 index based companies.
TABLE 2:DURBIN-WATSON TEST
Name of Company d Value
ALLAHABAD BANK 0.098 BANK OF INDIA 0.105
GMAINFRA 0.141
GODREJIND 0.240
INDIACEM 0.078
L&T FINANCE 0.121
SAIL 0.080
UNITECH 0.120
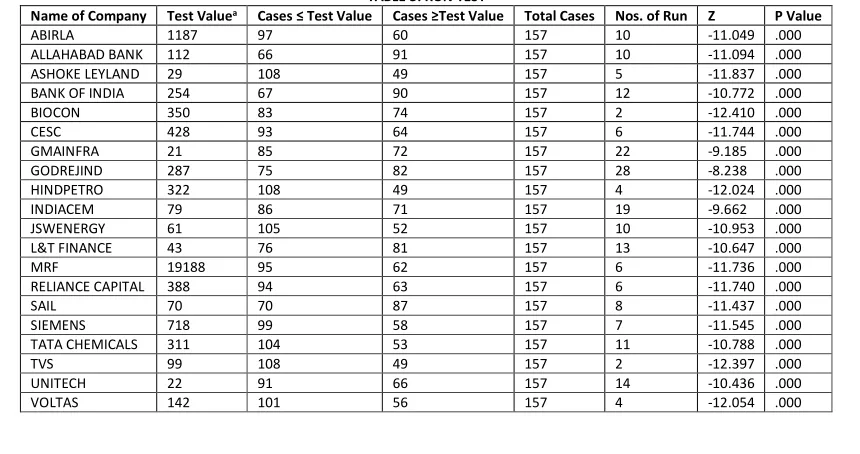
RUN TEST
Runs Test is a non-parametric test, which is used to test the randomness of the series which auto correlation fails to do. Runs Test is a traditional method used in the random walk model and ignores the properties of distribution. It determines whether successive price changes are independent. It ignores the absolute value in a time series and takes into consideration the price changes of the same sign. In this test actual number of runs is being compared with the expected number of runs. If the actual number of runs is not significantly different from the expected number of runs, then the price changes are considered independent, and if this difference is significant then the price changes are considered dependent. The expected number of runs can be obtained by applying the following formula: E (r) = 2 (n1 n2) / n1 + n2+1
Where, E (r) = Expected number of runs n1 = number of positive runs n2 = number of negative runs
The standard error of the expected number of runs of all signs may be obtained as: S.E = √2n1n2 (2n1n2-n1-n2) / (n1+n2)2 (n1+n2-1)
Where, S.E = Standard Error number of runs. The difference between actual number of runs and expected number of runs can be expressed by a standardized value ‘Z’ as under:
Z = R + 0.5 – E (r) / S.E
Where, R = Actual number of runs. 0.5 = Continuity adjustment. At 5% confidence level, if the calculated value of /z/ is between - 1.96 and + 1.96 then we accept the null hypothesis. The null hypothesis is rejected if the calculated value of /z/ is beyond - 1.96 and + 1.96. The null hypothesis for this test is that share price movements of companies under NIFTY Midcap 50 study are random.
The Table-3 below shows the results of Run Test for our sample companies. All the calculated ‘Z’ values are beyond - 1.96 having insignificant p value of 0.000.
That means we cannot accept our null hypothesis. Hence our null hypothesis ‘share price movements of companies under NIFTY Midcap 50 are random’ is rejected. This implies that the weak form of efficient market hypothesis does not hold good for NIFTY Midcap 50 index based companies.
TABLE 3: RUN TEST
Name of Company Test Valuea Cases ≤ Test Value Cases ≥Test Value Total Cases Nos. of Run Z P Value
ABIRLA 1187 97 60 157 10 -11.049 .000
ALLAHABAD BANK 112 66 91 157 10 -11.094 .000
ASHOKE LEYLAND 29 108 49 157 5 -11.837 .000
BANK OF INDIA 254 67 90 157 12 -10.772 .000
BIOCON 350 83 74 157 2 -12.410 .000
CESC 428 93 64 157 6 -11.744 .000
GMAINFRA 21 85 72 157 22 -9.185 .000
GODREJIND 287 75 82 157 28 -8.238 .000
HINDPETRO 322 108 49 157 4 -12.024 .000
INDIACEM 79 86 71 157 19 -9.662 .000
JSWENERGY 61 105 52 157 10 -10.953 .000
L&T FINANCE 43 76 81 157 13 -10.647 .000
MRF 19188 95 62 157 6 -11.736 .000
RELIANCE CAPITAL 388 94 63 157 6 -11.740 .000
SAIL 70 70 87 157 8 -11.437 .000
SIEMENS 718 99 58 157 7 -11.545 .000
TATA CHEMICALS 311 104 53 157 11 -10.788 .000
TVS 99 108 49 157 2 -12.397 .000
UNITECH 22 91 66 157 14 -10.436 .000
VOLTAS 142 101 56 157 4 -12.054 .000
VOLUME NO.6(2016),ISSUE NO.12(
DECEMBER
) ISSN2231-5756INTERNATIONAL JOURNAL OF RESEARCH IN COMMERCE, IT & MANAGEMENT
CONCLUSIONS
The theory and empirical studies on efficient market hypothesis have helped immensely in better understanding of the movement of share prices. This study examines the weak form efficiency of NIFTY Midcap 50 index based companies. Kolmogrov – Smirnov Goodness of Fit Test, Serial Correlation Test and Run Test have been conducted for the results.The study concludes that share price movements of companies under NIFTY Midcap 50 are not random during the study period. That means the weak form of efficient market hypothesis does not hold good for NIFTY Midcap 50 index based companies. The weak form of market efficiency prohibits abnormal profits to any investor using historical or current market prices. However, a market that is inefficient in the weak form will give investors an opportunity to make abnormal profit by studying historical or current price behaviour. Technical analysts use specific tools such as volume, moving averages and oscillators etc to forecast the price of a share. Hence, it can be concluded that investors may outperform the market due to its inefficiency, by undertaking, technical analysis of NIFTY Midcap 50 index based companies.
The findings of this study must be interpreted with reference to some of its limitations, which in turn provide motivation for further research. First, the sample has been taken only from NIFTY Midcap 50 index based companies, which means that the results should not be generalized for all Indian companies. This neces-sitates a much wider research based on a larger sample. Second, the period of study is for three years only starting from 1st April 2012 to 31st March 2015. The study of a longer period may change the findings. Third, statistical tests used in this study have its own inherent limitations which may affect the findings.
REFERENCES
1. Abdulnasser Hatemi-J, Bryan Morgan (2009), An empirical analysis of the informational efficiency of Australian equity markets, Journal of Economic Studies Vol. 36 No. 5, 437-445.
2. Allen, F., Brealey, R., Myers, S. (2011), Principles of Corporate Finance. New York: McGraw-Hill.
3. Barua, S.K. and Raghunathan, V (1986), “Inefficiency of the Indian Capital Market,” Vikalpa, Vol.11, No.3, July-September, pp 225-230.
4. Chaudhury, S K (1991), "Short-run Share Price Behaviour. New Evidence on Weak Form of Market Efficiency," Vikalpa, Vol 16, No 4, October-December, pp 17-21.
5. Chkraborty Madhumita (2006), “On validity of Random Walk Hypothesis in Colombo Stock exchange, Sri Lanka”, Decision, Vol33 (1), pp.135-161.
6. Das, S. and Pattanaik, S. (2011), Testing Random Walk Hypothesis for Bombay Stock Exchange and National Stock Exchange, Journal of Banking and Financial Services & Insurance Research, 1(6), pp 37-44.
7. De Bondt, W. F. M. and Thaler, R. (1985), Does the stock market overreact?, The Journal of Finance 40(3), 793–805. 8. Eakins, G., Mishkin, S. (2012). Financial Markets and Institutions. Boston: Prentice Hall.
9. Fama Eugene F. (1970), “Efficient Capital Markets: A Review of Theory and Empirical Work,” Journal of Finance 25, No.2, pp. 383-417. 10. Grossman, S. and Stiglitz, J. (1980), “On the impossibility of informationally efficient markets,” American Economic Review 70, 393–408. 11. Gupta, O P (1979). "The Random Walk Theory of Stock Market Price Behaviour—A Survey," Review of Commerce Studies, Vol 8, pp 51-75. 12. Jensen, MC (1978), ‘Some Anomalous Evidence Regarding Market Efficiency’, Journal of Financial Economics, 6(2/3), pp 95–101.
13. Kulkarni, N Suresh (1978). "Share Price Behaviour in India: A Spectral Analysis of Random Walk Hypothesis," Sankhya, The Indian Journal of Statistics, Vol 40, Series D, pp 135-162.
14. Lo, A., & MacKinlay, A. (1999). A Non-Random Walk Down Wall Street. Princeton: Princeton University Press.
15. Madhusoodan, T.P., (1998), “Persistence in the Indian Stock Market Returns: An application of Variance Ratio Test”, Vikalpa, Vol.23(4), pp.61-73. 16. Malkiel, B. G. (2003), “The efficient market hypothesis and its critics”, The Journal of Economic Perspectives 17(1), 59–82.
17. Poterba, J. M. and summers, L. H. (1988), Mean reversion in stock prices: Evidence and implications, Journal of Financial Economics 22(1), 27–59. 18. Pradhan B. B., Das K. B., Mishra P. K. (2009). “Empirical Evidence on Indian Stock Market Efficiency in Context of the Global Financial Crisis”. Global Journal
of Finance Management., 1(2), pp 149-157.
19. Saqib and Hanif, (2012), Testing Weak Form of Efficient Market Hypothesis: Empirical Evidence from South-Asia, World Applied Sciences journal 17(4), 414-427.
20. Sharma, J L (1983). "Efficient Capital Markets and Random Character of Stock Price Behaviour in a Developing Economy," Indian Economic Journal, Vol 31, No 2, pp 53- 65.
21. Shleifer, A. (2000), Inefficient Markets: An Introduction to Behavioral Finance, Oxford University Press, Oxford.
VOLUME NO.6(2016),ISSUE NO.12(
DECEMBER
) ISSN2231-5756REQUEST FOR FEEDBACK
Dear Readers
At the very outset, International Journal of Research in Commerce, IT & Management (IJRCM) acknowledges
& appreciates your efforts in showing interest in our present issue under your kind perusal.
I would like to request you to supply your critical comments and suggestions about the material published
in this issue, as well as on the journal as a whole, on our e-mail
for further
improve-ments in the interest of research.
If you have any queries, please feel free to contact us on our e-mail
.
I am sure that your feedback and deliberations would make future issues better – a result of our joint effort.
Looking forward to an appropriate consideration.
With sincere regards
Thanking you profoundly
Academically yours
Sd/-
Co-ordinator
DISCLAIMER
VOLUME NO.6(2016),ISSUE NO.12(
DECEMBER
) ISSN2231-5756