Spring 2019
Traffic incident detection using inrix data
Traffic incident detection using inrix data
Raviteja Raja Byna
Iowa State University, [email protected]
Follow this and additional works at: https://lib.dr.iastate.edu/creativecomponents
Part of the Software Engineering Commons, and the Systems Architecture Commons
Recommended Citation Recommended Citation
Byna, Raviteja Raja, "Traffic incident detection using inrix data" (2019). Creative Components. 147. https://lib.dr.iastate.edu/creativecomponents/147
Traffic Incident Detection using INRIX Data
By
Raviteja Raja Byna
A Creative Component submitted to the graduate faculty
in partial fulfillment of the requirements for the degree of
MASTER OF SCIENCE
Major: Computer Science
Program of Study Committee:
Anuj Sharma, Committee Member
Simanta Mitra, Co-major Professor
Gurpur Prabhu, Co-major Professor
Iowa State University Ames, Iowa
2019
TABLE OF CONTENTS
LIST OF TABLES ………3
LIST OF FIGURES ………..4
ACKNOWLEDGEMENTS……...………5
DEDICATION………...6
ABSTRACT………..7
CHAPTER 1. INTRODUCTION ………8
1.1 Motivation ………..8
1.2 Report Organization ………...9
CHAPTER 2. OVERVIEW ……….10
2.1 TIMELI ………..10
CHAPTER 3. ARCHITECTURE OF TIMELI ………...11
3.1 Lambda Architecture ……….11
3.2 Architecture Components ………..12
3.2.1 Data Streams ………...12
3.2.2 Data Ingestion Module ………12
3.2.3 In-memory Database ………...12
3.2.4 Data Processing Module ………..13
3.2.5 Database ………..13
3.2.6 TIMELI Web App ………...13
3.3 Technologies Explored ………...14
3.3.1 Data Ingestion: Kafka vs Flume vs Spring Boot Java ……….14
3.3.2 Data Processing Module: Apache Spark vs Apache Storm ………….14
3.3.3 In-memory Database: RedisDB ………...15
3.3.4 Database: MongoDB vs Azure CosmosDB vs MySQL ………..15
3.4 Finalized Architecture ……….17
CHAPTER 4. TRAFFIC INCIDENT DETECTION ON INRIX DATA ……….18
4.1 INRIX Data Source ……….18
4.2 Implementation Details ………...19
4.3 Traffic Incident Detection Algorithm ……….20
4.4 Detail explanation of the algorithm ………22
4.5 Threshold Data Computation ………..23
4.6 TIMELI Backend REST APIs ………24
CHAPTER 5. RESULTS ………..25
CHAPTER 6. FUTURE SCOPE ………..26
6.1 Improvements ……….26
6.1.1 Threshold Computation ………...26
6.1.2 Data Ingestion Module ………....26
6.1.4 Monitoring ...………26
CHAPTER 7. CONCLUSION ……….27
LIST OF TABLES
LIST OF FIGURES
Fig. 3.1 Lambda Architecture ……….11
ACKNOWLEDGEMENTS
DEDICATION
ABSTRACT
CHAPTER 1. INTRODUCTION
1.1 Motivation
United States has nearly264 million vehicles registered and 218 millions driversholding a valid driving license which makes it a busiest country in terms of road traffic. The amount of traffic is one of reasons for high number of traffic incidents. In 2015, there were some 6.3 million fatal, injury and property damage crashes that occurred in the U.S. alone. Traffic incidents also impacts pedestrians as the number of pedestrians killed in road traffic incidents is 0.6 million in 2015[3]. An traffic incident can occur because there is a congestion on the road and congestion occurs because of an accident, heavy traffic volume, road work, or bad weather condition. This leads to slower speeds, longer trip times, increased vehicular queuing, people are frustrated and engage in road rage, higher fuel congestion and loss of life[4].
It has been found that individual incidents (such as accidents or even a single car braking heavily in a previously smooth flow) may cause ripple effects (a cascading failure) which then spread out and create a sustained traffic jam when, otherwise, normal flow might have continued for some time longer[2]. Other reasons to congestion are (i) separation of work and residential areas where people work and live in different parts of the city which resulting in people to commute for work. In 2014, a total of 132.3 million people in the United States commute between their work and residential areas daily. (ii) Movement to obtain or provide goods and services, for instance, to purchase goods or attend classes people need to move about within the city. (iii) Inadequate transport infrastructure and services where buses and trains are overcrowded and people tend to drive their own car, hence, increasing the volume of traffic on road. To avoid this congestion, data of past months can be used to predict congestion on a particular road in advance and then appropriate steps can be taken to deal with it.
1.2 Report Organization
Chapter 2. OVERVIEW
Traffic Incident Detection using INRIX data is a part of TIMELI project which is being developed in INTRANS. In this chapter we provide brief description of TIMELI so as to have an idea of how traffic incident detection for INRIX is being used.
2.1 TIMELI
TIMELI (Traffic Incident Management Enabled by Large-data Innovations) is a software which integrates innovative data analytics techniques in order to monitor traffic conditions in real time, proactively control risk, quickly detect traffic incidents, identify the location and potential cause of these incidents and suggest traffic control alternatives. This software will be provided to DOTs where the operators will be alerted about any potential incident going in the area. The operators can then manually verify whether it is an incident or not by checking the live video feeds in that area.
CHAPTER 3. ARCHITECTURE OF TIMELI
This section describes architecture of TIMELI system.
3.1 Lambda Architecture
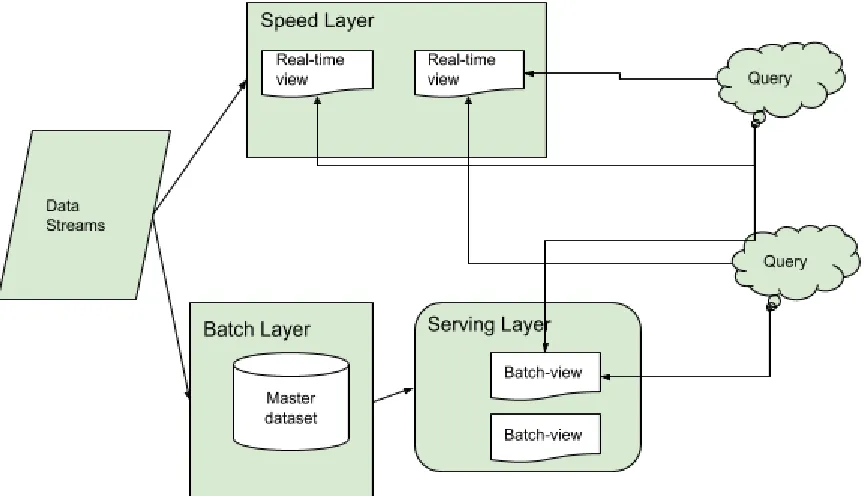
[image:13.612.75.507.228.476.2]The architecture of TIMELI follows Lambda architecture. Lambda architecture handles massive quantities of data and incorporates both batch and stream-processing methods. Lambda architecture is a data-processing architecture which consists of three layers: batch layer, speed (or real-time) layer, and a serving layer for responding to queries[14].
3.2 Architecture Components
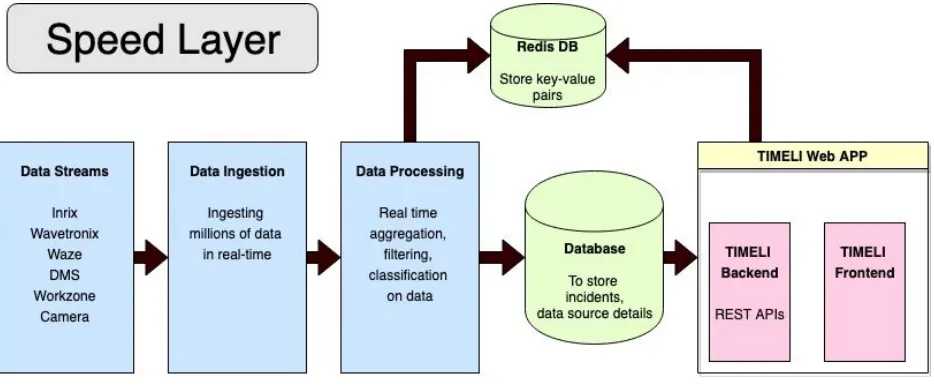
[image:14.612.76.543.138.332.2]This section briefly describes different components of the architecture.
Fig 3.2 TIMELI Architecture - Speed Layer
3.2.1 Data Streams
There are lot of data sources which can give information related to traffic on the road. Here, we will consider only INRIX data. INRIX data consists of the road network divided into multiple smaller segments. Each segment produces a time-series of the traffic state (average speed). These time-series are extensively large-scale, with thousands of data points being recorded daily per segment. These data sources can be accessed over http/https or ftp. Some of these data sources are restricted over DOT network.
3.2.2 Data Ingestion Module
This module acts as a Producer and gets the raw data from different data sources in real time. This module also does some preprocessing like editing of malformed xml, conversion of xml to csv and in some cases, smoothing of data. After preprocessing, it stores the csv file in the file system and also as a backup in Azure Blob Storage. For INRIX data, the data is queried every one minute.
3.2.3 In-memory Database
3.2.4 Data Processing Module
This module acts as a consumer and the csv file produced in real time by data ingestion module is consumed. For INRIX data, new csv file is consumed every minute. This module applies traffic detection algorithm and detects any anomaly and stores it into NoSQL database.
3.2.5 Database
DB is used to store incidents that are detected so that TIMELI Web App can consume and show it on the website. Also, it stores raw data for real-time heatmap for the incidents, camera inventory details, dms inventory details and more.
3.2.6 TIMELI Web App
3.3 Technologies Explored
Considering the abundant use cases for this project and also considering non-functional requirements like cost, performance, fault-tolerant, following technologies were finalized for each and every module.
3.3.1 Data Ingestion Module: Apache Kafka vs Apache Flume vs Spring Boot Java
Apache Kafka: It is a streaming platform acting as Publish and subscribe model, similar to a message queue or enterprise messaging system and records are stored in a streaming fashion and in a fault-tolerant durable way. The Kafka cluster stores streams of records as topics. Producers publish their data to their chosen topics. Consumers has a consumer group name and each subscribing consumer group has a consumer instance which receives the record corresponding to its topic.[5].
Apache Flume: Apache Flume is used to store data in a centralized data store such as HDFS(Hadoop Distributed File System). It collect, aggregate and transfer data streams from different sources. Flume is is designed to gather streaming data from different web servers. It is also configurable, highly reliable and manageable distributed data collection service. It is available open source[7].
Spring Boot Java: Spring Boot provides option similar to cron job in linux, to build a scheduler on the Spring applications. Scheduling is a process of executing the tasks for the specific time period. It is similar to cron job where you can download the data at frequent interval and store it in local VM, cloud, hdfs or data lakes[8].
We explored all the above technologies and decided to go with Spring Boot JAVA since Kakfa is costly ($1500 per month) when spawned as a cluster in Azure. Flume & Kafka can be spawned as standalone application which prevents us from using all its capabilities and since the data received was every 20 seconds or 1 minute Spring Boot JAVA did the job. We designed the producer in such a way that all the data sources are independent and if one fails another is not affected[7].
3.3.2 Data Processing Module: Apache Spark Streaming vs Apache Storm
With Spark, same codebase can be used for batch processing and stream processing, but it is not the case for Storm. Spark Streaming has a small advantage in that it has a dedicated company – Databricks – for support[9].
Hence, we started our development using spark, spawning a HDInsights cluster which was also costly ($1000). However, performance using Spark was good hence for cost effective solution, we launched a standalone Spark on a VM.
3.3.3 In-memory Database: RedisDB
Redis is an in-memory data structure store. It can be used as a database, cache and message broker. It supports vast amount of data structures such as strings, hashes, lists, sets, sorted sets with range queries, bitmaps, hyperloglogs, geospatial indexes with radius queries and streams[10].
Redis was the first choice for in-memory databases since it is well-known caching solution. Its capability to support lot of data structures which can’t be achieved with a vanilla key-value cache.[10] It also supports geo queries which is a major requirement for this project.
3.3.4 Database: MongoDB vs Azure CosmosDB vs MySQL
MongoDB: MongoDB is a NoSQL database . Becuase of its dynamic schema nature, unstructured data can be stored as column-oriented, document-oriented, graph-based or key-value store. Hence, each document can have its own unique structure and update new fields at anytime[11].
SQL: On the other hand, SQL databases use structured query language (SQL). It is famous and availble since many years which gives it an advantage in terms support and resources. However, it can be restrictive. For instance, schemas are predefined so one needs to specify the structure of the data before one can work with it. And henceforth, all of the data must follow the same structure. Adding and deleting new fields is difficult and tedious process.
When it comes to scalability, SQL databases are vertically scalable, which means that you can increase the load on a single server by increasing things like CPU, RAM or SSD. NoSQL databases, on the other hand, are horizontally scalable. This means that you handle more traffic by sharding, or adding more servers in your NoSQL database. NoSQL databases the preferred choice for large or ever-changing data sets[11].
stored in Cosmos DB and provides the same API’s like MongoDB. And it is cost effective too. Hence, decided to go with cosmosDB.
3.3.5 TIMELI Backend: Java vs NodeJS
Java: Java is a backend language and is independent of the platform it is run. Java is an old language, hence has more support.
NodeJS: Node.js modules are specific to the operating system. With Node.js, JavaScript is used both on the frontend and backend, which made it a breakthrough and it creates a more seamless infrastructure and also it is easier to migrate the code if needed. Frontend development is build with other languages different from Java. There are Java-specific frontend tools, such as JavaFX and Swing, but they cannot provide the same code uniformity as Node.js does.
Node.js also has following advantages:
1. Easier learning curve than Java, hence quick to pick up. 2. Node.js takes about 33% fewer lines of code than Java.
3. Non-blocking IO processing that is better for reading and writing operations in database, logging and real-time applications.
4. Also, since everybody knows javascript in a team, knowledge sharing within the team is quick and easy[12].
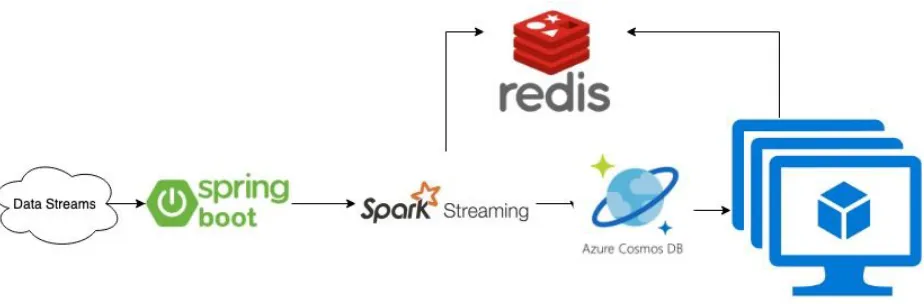
3.4 Finalized Architecture
CHAPTER 4.
TRAFFIC INCIDENT DETECTION ON INRIX DATA
4.1 INRIX Data Source
INRIX is a global SaaS and DaaS company that specializes in connected car services and
transportation analytics.[13] INRIX provides APIs over HTTP to access trillions of bytes of information about roadway speeds and vehicle counts from 300 million real-time anonymous mobile phones, connected cars, trucks, delivery vans, and other fleet vehicles equipped with GPS locator devices[13]. For this project, Iowa speed data is retrieved from Inrix, along with location and incident data. Speed data is used to detect congestion, location data is used to plot the incidents on the map and incident data is used to compare the predicted incidents with actual incidents predicted by Inrix.
Road network in Iowa is divided into segments. Inrix speed data represents speed of each of the segment on the road. Each segment is on an average of 0.5 miles. Following data is provided for each segment:
code: unique id of each segment
c-value: confidence value
score: confidence score
speed: speed of the segment
4.2 Implementation Details 4.2.1 Data Ingestion Module
INRIX data for Iowa is pulled every one minute using Spring Boot Scheduler. The file format of the data is in xml. And following fields are retrieved. After successfully retrieving the data, it is converted from xml to csv for further processing. CSV is a common data exchange format that is widely supported by consumer, business, and scientific applications. The database program most likely can export its data as "CSV"; the exported CSV file can then be imported by the spreadsheet program[15]. Both xml and csv files are stored it in the local machine. Every minute this csv file is replaced with new one. We also store the csv file for the whole day separately in another location for batch processing use case. Since the data is huge for 1 day (approximately 2.6 GB), at the end of the day per day file is moved to Azure Blob Storage.
4.2.2 RedisDB
Inrix location data is stored in the RedisDB as a key value pair, key being the segment and value being the location data. Some of the important fields of location data are next segment, previous segment, road name, segment length, start latitude, start longitude, end latitude, end longitude and direction of the segment.
Also, Threshold data is stored in RedisDB. This value is for each interstate segments and speed value should be always greater than this threshold value otherwise this may be a potential candidate for incident. Currently, threshold data is updated every month manually. In future, this has to be manually updated.
Also, list of target routes are also stored in RedisDB. This project considers only interstate roads in Iowa but Inrix provides data for all the roads in Iowa. Hence, target routes are used to filter out the interstate data.
Alse, list of segments within in 2 miles for each segment is stored in RedisDB. Since this information is static and redis has geo query capabilities, this data is pre-processed and stored in in-memory database.
4.2.3 Data Processing Module
4.3 Traffic Incident Detection Algorithm
Traffic_Incident_Detection_Algorithm()
tep 1 readthecsvfile
S :
tep 2 filtersegmentswhichare
S : :
(a) Interstatesegments
(b) c−value = 30 > andscore = 30
(c) segmentlength > 0.2 miles
(d) Segmentspeed < 45 mph
tep 3 if (speed threshold_speed)
S : <
f (incident_count 3)
i <
etincident_state P OT ENT IAL_INCIDENT
s =
lseif (incident_count 3)
e =
etincident_state INCIDENT
s =
etcurrent_incident true
s =
etevent_id generateEventId(incident)
s =
toreInDB(incident)
s
lseif (incident_count 3)
E >
etincident_state IN_P ROGRESS
s =
f (speed threshold_speed)
i >
f (incident_count 3)
i <
etincident_state NO_INCIDENT
s =
lseif(overcount 5)
e <
etincident_state MAY_BE_OV ER
s =
lseif(overcount 5)
e =
etincident_state OV ER
s =
etcurrent_incident false
s =
pdateInDb(incident)
u
enerateEventId(segment)
g
tep 1 getallnearBySegments(segment)
S :
tep 2 foreachnearBySegments
S :
f (nearBySegment.currentIncident = true)
i =
vent_id nearBySegment.event_id
e =
tep 3 elseif (segment.last_incident_time 60 min)
S : <
vent_id last_event_id
e =
tep 4 elseevent_id “date segment_id”
tep 5 returnevent_id
S :
earBySegments(segment) returnsallthesegmentswithin 2 milesonthesameroad
n :
toreInDB(incident) StorestheincidentdocumentintheCosmosDBusingMongoDBAP Is.
s :
pdateInDb(incident) UpdatestheincidentdocumentinCosmosDBandupdatestheend_timestamp.
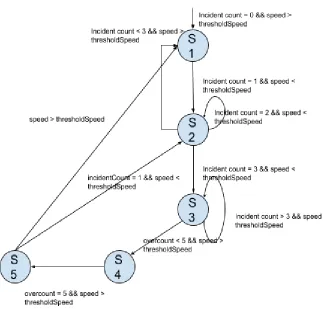
[image:23.612.74.397.204.513.2]u :
Fig 4.1 State Machine Design for Step 3 of the algorithm
4.4 Detail explanation of the algorithm
As per the requirements, incidents needs to be detected for interstate segments only. Hence, first interstate segments needs to be filtered out and these target routes are retrieved from RedisDB.
INRIX reports two parameters, condence score and c-value. This represents the reliability of each traffic record. These two parameters are provides because the quality of probe-based speed data depends on the number of probe vehicles available.
Condence score can take 3 values: 10, 20, and 30.
Confidence Score Indicates
30 only when real-time probe vehicles are used for reporting real-time speed
10 When historical traffic speed data is used to report traffic speed of a segment due to unavailability of probe vehicles
20 When a mix of real-time probe data and historical speed data is used
Table 4.1 Confidence Score
C-value is an reliability parameter provided by INRIX only when condence score is 30. C-value can range from 0-100 and provides a relative measurement of number of probe-vehicles used for real-time speed report. Since traffic incident detection requires real-time speed reports, we used traffic speed data corresponding to condence score of 30 and c-value greater than 30[16].
Also, filter out the segments which are less than 0.2 miles since those segments are ramps which are outliers. And since Federal Highway Administration guidelines state that congested conditions occur in freeways when average speed in a road-segment is less than 45 mph (Systematics, 2005), we filter out these segments whose speed is less than 45mph[16].
The main logic starts here, where processed data is being used and incidents are detected. Threshold data is stored in RedisDB which gets updated every month manually. Incident is detected as POTENTIAL INCIDENT if the speed is less than the threshold speed for a given segment.
I. If the above condition occurs consecutively for 3 times, we consider it as an incident and store it in database and a unique event_id is assigned to it.
III. Also, If the above condition occurs consecutively for 3 times and there is an incident occured within last 60 minutes then same event_id is assigned and stored in database. Incident is detected as MAY_BE_OVER if the segment is already considered to have an incident in previous minute and the speed is greater than threshold value.
I. If the above condition occurs consecutively for 5 minutes then that segment is no longer an incident and database is updated with end_timestamp.
4.5 Threshold Data Computation
In the paper by Pranamesh[16], threshold computation is done using following method:
Univariate speed threshold determination: Normal traffic condition varies depending on the time of day and day of the week. Hence, the location and scale parameters are determined for each day of the week, and 15-minute periods of the day for each segment. Threshold speed values over 15-minute intervals of each day of the week are determined using the previous 8 weeks of traffic data for the same segment for the given day of the week and period of the day. Outlier detection is an important task in statistical analysis and signicant research has been performed for development of robust models to detect outliers from noisy data streams[16].
Following fields are the output from this method:
code - segment_id
weekday - day of the week (Mon, Tues, ..)
hour - hour of the day (0, 1, …, 23)
period - 15-minute period of each hour (0,1,2,3)
median - median speed
iqd - Interquartile distance
Threshold value is calculated based on below formula:
hresholdV alue median (2 iqd)
4.6 TIMELI Backend REST APIs
To visualize these incidents on the frontend, REST APIs were build in the backend. For instance, API to get the list of incidents every minute from the database. Following are the list of APIs that were written to satisfy the user requirements.
1. Get Incidents: To retrieve the latest incidents detected by Data Processing module. 2. Get Historical Incidents: To retrieve all the incidents
3. Get Raw data for nearby Segments: Retrieve all the raw data for segments within 5 miles. 4. Update Incident as False incident: If operator verifies it as not an incident mark it as
false.
5. Update Incident as Complete: Once the incident is Over, the operator can mark it as complete.
6. Get Camera Data: Get List of all the camera from the database
7. Get Nearby cameras: Fetch all the cameras within 2 miles radius of the incident. 8. Get Dms data: Get list of all the dms data from the database
CHAPTER 5. RESULTS
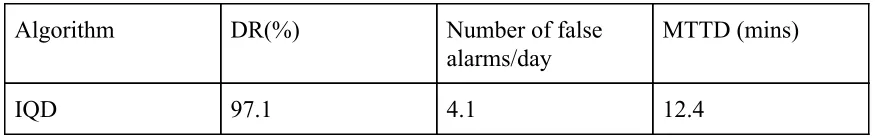
Traffic data is stored continuously for all interstates in Iowa and it generates around 2.6 GB of data per day. Threshold computation algorithm considers last 2 months while performing the algorithm. The paper[16] uses Apache Pig Latin, a high level map-reduce, to analyse the massive dataset (approximately 500 GB) and generate valuable data about the performance of each road segment separately. This valuable data comes in the form of threshold speed values for each segment over the time of the day and different days of the week. These threshold values are used to develop Traffic Detection algorithm which treat traffic incidents as outliers or anomalies in the data stream. The threshold values are used and calculate Interquartile Distance (IQD). Following table determines the Detection Rate (DR), Mean Time to Detect (MTTD) and number of false alarms/day.
Detection Rate (DR) is defined as the ratio of the total number of incidents detected to the 6 total number of incidents actually occurred, given by Equation 1. DR = Total number of detected incidents Total number of actual incidents ×100%[16].
Mean Time to Detect (MTTD) is defined as the ratio of the total time elapsed between 20 detecting incidents to the number of incidents detected, given by Equation 3. MT T D = Total time used to detect incidents Total number of incidents detected ×100%[16].
Algorithm DR(%) Number of false
alarms/day
MTTD (mins)
[image:27.612.106.546.453.522.2]IQD 97.1 4.1 12.4
CHAPTER 6. FUTURE SCOPE
6.1 Improvements
Considering the issues faced during running of this incident detection algorithm, there are lot of improvements that can be made.
6.1.1 Threshold Computation
Currently, Univariate speed threshold determination method is used to determine the threshold for each segment for every 15-minute period. There is another method mentioned in the paper which is Multivariate Spatio-Temporal Threshold Denoising. Since Univariate threshold computation does not take into consideration. Hence, on the topology of the tra ffic network or temporal correlations between the time windows. , the thresholds computed can be highly noisy and variable across contiguous roadway segments. To compensate for this, paper proposes to improve the quality of the estimated thresholds using the spatio-temporal information[1].
Also, currently, threshold speed data is updated manually. This computation and update can be done automatically by scheduling weekly Hadoop cluster launch and computing the threshold values and updating the same in RedisDB.
6.1.2 Data Ingestion Module
There have been cases where data is failed to be download and in this case, data is lost for that instance and wait for another minute to receive the next data. Instead, introduce the mechanism of retries using Spring Boot @Retryable.
6.1.3 Monitoring
There have been cases when the modules stops running because of no space left on device, exceptions in the code and there is no monitoring mechanisms for it. Use Azure Alert monitoring or nagios to monitor the running processes on these machine.
CHAPTER 7. CONCLUSION
Incident detection is important in the field of transportation, to reduce the severity of incident. By detecting congestion on the roads, Traffic Incident Managers are informed immediately so that they can take further action based on the severity of the incident and avoid further damage. So leverage as many data sources as possible to detect anomalies on the roads with accuracy, speed and efficiency.
For better performance, criticality of the use-cases and real-time processing requirements in this project, there is a need to build a software using the latest technologies available in the market. And lambda architecture perfectly suits to satisfy these requirements as described in this paper. In this project, we utilize several data sources to detect incidents and one of the data source is INRIX. This module is designed as an independent module that can be integrated in any project. This software can be further improved and scaled easily since this is installed on Azure Cloud. These modules are independently written so that they can be ported to another cloud with no changes in the core logic.
REFERENCES
[1] Pranamesh Chakraborty, Chinmay Hegde, Anuj Sharma “Data-driven parallelizable traffic incident detection using spatio-temporally denoised robust thresholds”
[2] “PFI:BIC- A Smart Service System for Traffic Incident Management Enabled by Large-data Innovations (TIMELI)”
https://nsf.gov/awardsearch/showAward?AWD_ID=1632116&HistoricalAwards=false
[3] “Road Accidents in US” https://www.statista.com/topics/3708/road-accidents-in-the-us/ [4] “Traffic Congestion” https://www.wikiwand.com/en/Traffic_congestion
[5] “Apache Kafka” https://kafka.apache.org/intro
[6] “Apache Flume” https://www.wikiwand.com/en/Apache_Flume
[7] “Apache Kafka vs Apache Flume” https://www.educba.com/apache-kafka-vs-flume/
[8] “Spring Boot Scheduling”
https://www.tutorialspoint.com/spring_boot/spring_boot_scheduling.htm
[9] “Apache Storm vs Spark Streaming”
https://www.ericsson.com/en/blog/2015/7/apache-storm-vs-spark-streaming
[10] “RedisDB” https://redis.io/
[11] “SQL vs MongdDB”
https://medium.com/xplenty-blog/the-sql-vs-nosql-difference-mysql-vs-mongodb-32c9980e67b2
[12] “Java vs Node JS”
https://da-14.com/blog/nodejs-vs-java-backend-language-large-software-development
[13] “INRIX” https://www.wikiwand.com/en/INRIX
[14] “Lambda Architecture” https://www.wikiwand.com/en/Lambda_architecture
[15] “CSV” https://www.wikiwand.com/en/Comma-separated_values
[16] Chakraborty, Hess, Sharma, Knickerbocker “OUTLIER MINING BASED TRAFFIC INCIDENT DETECTION USING BIG DATA ANALYTICS”