Please cite this article as: R. Davarnejad, P. Hosseinitabar, Application of Iron Electrode in Textile Industry Wastewater Treatment Using Electro-fenton Technique: Experimental and Statistical Study, International Journal of Engineering (IJE), TRANSACTIONS A: Basics Vol. 29, No. 7, (July 2016) 887-897
International Journal of Engineering
J o u r n a l H o m e p a g e : w w w . i j e . i rApplication of Iron Electrode in Textile Industry Wastewater Treatment Using
Electro-fenton Technique: Experimental and Statistical Study
R. Davarnejad*, P. Hosseinitabar
Department of Chemical Engineering, Faculty of Engineering, Arak University, Arak, Iran
P A P E R I N F O
Paper history: Received 10 April 2016
Received in revised form 28 May 2016 Accepted 02 June 2016
Keywords: COD Reduction Color Reduction Electro-fenton Iron Optimization
A B S T R A C T
The application of synthetic colors in textile industries and their entry into the water and groundwater is an environmental problem because of being very toxic material. The synthetic colors which are used in textile dyeing (plyacrilic and polyester) are usually dispersing colorants. They derive the azo and anthraquinone chemicals. Electro-Fenton process is an efficient technique which can degrade the recalcitrant wastewaters. The main goal of the present study was to examine the effect of iron electrodes (as a cheap and available material) on industrial textile wastewater treatment by electro-Fenton technique. The experiments were conducted to evaluate the effects of reaction time, current density, pH, H2O2/Fe2+ molar ratio and volume ratio of H2O2 to textile wastewater (TW) (ml/l) on the
process. Response surface methodology (RSM) was used to consider the effects of five independent variables on the COD and color removal from the wastewater and optimize the operating conditions. The optimum conditions were obtained at reaction time of 71.74 min, current density of 40.11 mA/cm2, pH 2.84, H
2O2/TW of 2.03 (ml/l), H2O2/Fe2+ molar ratio of 3.89 for COD removal of 76.33%.
Furthermore, optimum conditions were found at reaction time of 75.97 min, current density of 67.04 mA/cm2, pH 2.98, H
2O2/TW of 1.69 (ml/l), H2O2/Fe2+ molar ratio of 2.98 for color removal of 79.33%.
doi: 10.5829/idosi.ije.2016.29.07a.02
1. INTRODUCTION1
A great amount of wastewater in the textile industry is generated from dyeing operations [1]. Various methods have been used for textile industry wastewater treatment such as adsorption [2], coagulation [3], electro-coagulation [4] and sonication [5]. A combination of Fenton and electrochemical processes which is called electro-Fenton (EF) process can improve the oxidation efficiency [1]. The traditional Fenton process is widely used as a suitable treatment method for highly concentrated wastewater due to producing hydroxyl radicals [6, 7].
Applicability of the traditional Fenton process is limited by the acidic pH, the formation of iron sludge and high cost of hydrogen peroxide [6, 8]. Electro-chemical advanced oxidation processes (EAOPs) based on
1*Corresponding Author’s Email: [email protected] (R. Davarnejad)
Fenton’s reaction chemistry are eco-friendly methods that have recently received much attention for wastewater remediation (such as photo-Fenton, Fenton-like and electro-Fenton processes) [8]. The most popular EAOP is the electro-Fenton process which can proceed by a chain reaction [9-11]. The hydroxyl radicals obtained from the initial reaction are generated at the surface of a high-oxygen over voltage anode.
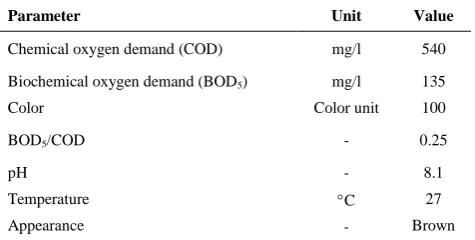
TABLE 1. Characteristics of the used wastewater
Parameter Unit Value
Chemical oxygen demand (COD) mg/l 540
Biochemical oxygen demand (BOD5)
Color
mg/l
Color unit 135
100
BOD5/COD - 0.25
pH
Temperature
Appearance
-
C
-
8.1
27
Brown
The dyeing sewage contains the toxic and resistant molecules. According to the literature, some methods such as coagulation and flocculation cannot remove these molecules. The other techniques such as activated carbon only substitute a contaminant with another molecule. Therefore, a supplementary treatment is requested. The electro-Fenton process completely decomposes the organic contaminants and converts them into CO2, H2O and non-toxic materials [13]. The electrode material is an effective parameter in the electro-Fenton process. The reaction rate on electrode surface has a direct relation with anode material. The most applied electrode (as an anode) in electro-Fenton process is platinum. Since it is an expensive material, a cheaper one is encouraged [6, 14, 15]. The efficiency of electro-Fenton process highly depends on the cathode material because the regeneration of hydrogen peroxide and Fe2+ ions in cathode surface are accelerated. Iron as cathode can also be used as a proper material for the electro-Fenton process. It increases Fe2+ ions regeneration and reduces the iron salts [9, 11, 14]. Cruz-Gonzalez optimized the operating conditions for the acid yellow 36 decolorization by electro-Fenton process to remove 98% of color [16]. The color removal from textile wastewater by electro-Fenton process using a three-dimensional graphite cathode was carried out by Chih-Tawang. 70.6% of removal was investigated in this research [17]. According to another research, COD was reduced from industrial textile wastewater by electro-Fenton process using an activated carbon fiber cathode. The maximum efficiency was reported around 75.2% [18].
In this research, the effects of various parameters such as reaction time, pH, current density, H2O2/ Fe2+ molar ratio and H2O2/TW (ml/l) on the COD and color removal from industrial textile wastewater were carefully considered during treating by the electro-Fenton process. Furthermore, the iron electrodes (as a cheap source of Fe2+ ions) were used. The response surface methodology (RSM) was used to minimize the number of experiments and optimize the operating conditions [9, 19-22].
2. EXPERIMENT
2. 1. Materials and Methods
2. 1. 1. Wastewater Sampling and Characterizati-on The study was conducted on industrial wastewater samples obtained from Khomein Textile Company (Khomein, Iran). The main contaminant agents of water in the textile industry are the synthetic fibers like polyacrylic and polyester. The wastewater sample was taken from the industrial sewage basin. The industrial sewage basin is a product of the function of dyeing system and is an output of this system. The sewage basin is a large tank in which the wastewater is treated by several processes. There are various sewage basins such as stabilization, aeration and sedimentation basin. The sewage enters into a close tank for stabilization purpose for 12 h. The oxidation process occurs in the presence of 1 g/l calcium hypochlorite at 10 min. The oxidized sewage is then pumped to the aeration basin. The surplus COD which was not treated by chemical method is treated by microorganisms (activated sludge). According to the factory report, the efficiency of this process is around 57% for COD removal and around 65% for color removal. According to the literature, electro-Fenton as an efficient, rapid and compressed technique can treat the toxic wastewater. Furthermore, the colloids and suspended particles are removed from the reaction environment during the electro-Fenton process. Therefore, this is ecologically more acceptable [6, 23].
The wastewater sample used in this research was taken from the stabilization basin before any treatment. 40 liter of sample from the industrial sewage basin was taken and saved in a plastic container. It was immediately transported to Arak University (Chemical Engineering Research Lab). All experiments were done during few days and all samples were kept inside a refrigerator (at a temperature of 4 C). COD and color of processed samples were tested by an online UV visible. COD and color were evaluated by the standard method [24]. COD was determined by acidic digestion (open reflux) method at 150 C for 2h, using potassium dichromate as oxidant, followed by titration with iron (II) sulfate and ammonia. In this measurement, pH was adjusted to 4. The initial color was evaluated and reported by the company. The characteristics of this wastewater are presented in Table 1.
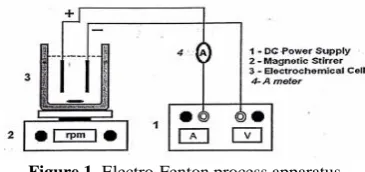
and measured by a pH meter (model: METTLE-TOLEDO 320, UK). In each run, 250 cm3 of the sample was placed in an electrolytic cell and pH was adjusted. The cell was a beaker with 400 cm3 capacity, which functioned as a reactor at laboratory scale. The chemicals [H2O2 30%, FeSO4.7H2O, sulfuric acid and sodium hydroxide (Merck grades, Germany)] were added into the wastewater and electro-Fenton reactions were started with switching on the power supply. Hydrogen peroxide easily releases an active oxygen atom. Therefore, H2O2 concentration is normally expressed by the active oxygen. The cell was placed on the magnetic stirrer (Labinco, Netherland) and iron sulfate was entirely dissolved. A pair of electrodes (anode and cathode) made of iron was placed in the cell and solution was mixed at 400 rpm. Stirrer should integrate the mixture without vortex creation because it will change the current density [9, 25]. The effective area of the electrodes in the solution was 1 cm2 with dimensions of 1 cm × 1 cm and the spacing between the electrodes was 2.5 cm. The distance between electrodes and their areas have direct influence on the current density although it does not affect the process in the distance range of 1.5-2.5 cm [6]. After placing the electrodes in the solution a direct current (DC) power supply [Kala Gostaran-e-Farda, Iran (30V & 3A)] was used to provide the desired current. The electro-Fenton apparatus used in this research is shown in Figure 1.
At the end of each run, samples were filtered through the filter paper [Whatman, England (S&S 5891)] and the filtrate was then analyzed in terms of COD and color. COD and color were respectively measured at wavelenths of 438 and 647 nm using a UV-Vis spectrophotometer (HACH, US) calibrated by the supplier. The filtered samples were put in the spectrophotometer while the blank was water. The absorption amount for each sample was found at 438 and 647 nm for COD and color, respectively.
According to the chromate test as explained above and the reported wavelength validation, the initial sample was diluted in five different volumes (50, 100, 200, 500 and 1000 cm3) and absorption amounts were obtained for these five samples at 438 nm (calibration curve for COD). Similar procedure was carried out for color (at 647 nm), as well. Finally, the COD and color removal can be calculated by Equation (1):
Removal (%) = i 0
i
C C
C
×100 (1)
where, Ci and C0 are initial and final sample concentrations, respectively.
2. 1. 3. Experimental Design and Statistical Analysis In this research, the amounts of consumed salt and H2O2 were exactly determined by two ratios. In fact, 250 cm3 of textile wastewater was utilized and H2O2 mole was obtained from H2O2/TW (ml/l). Then, the salt mole was found from H2O2/Fe2+ molar ratio. However there are several researches on these ranges selection [9, 11, 25, 26] but, some experiments were done to confirm or modify them for this case-study. The applied ranges for various parameters are shown in Table 2.
The design expert software (Stat-Ease, US, 7.0.0 open source) was used for the experimental design, data analysis, suitable model correlation and graph plotting. The independent variables were reaction time (X1), current density (X2), pH (X3), H2O2/TW (ml/l) (X4) and H2O2/Fe2+ molar ratio (X5). COD and color removal (Y1 and Y2, respectively) were considered as the dependent variables. The performance of this process was evaluated by COD and color removal.
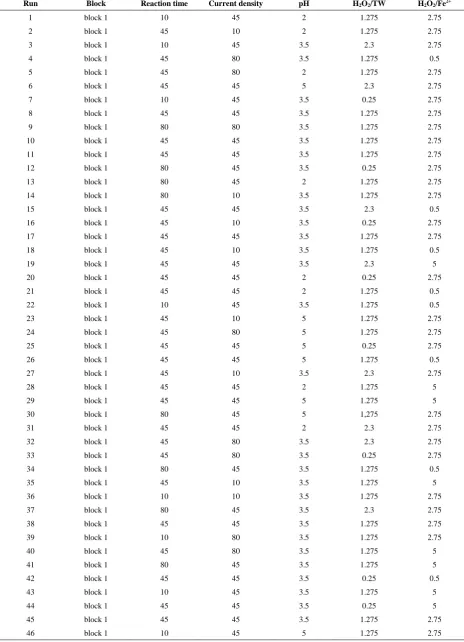
Furthermore, the experimental design and optimization were conducted using the Central Composite Design (CCD). Each variable was coded with low, medium and high level (-1, 0, 1) in the CCD as shown in Table 3. As shown in Table 4 (matrix design obtained from the design expert software) 46 experiments with their conditions were designed.
Figure 1. Electro-Fenton process apparatus
TABLE 2. The used ranges for various parameters in
electro-Fenton process
3 Range Reference
Reaction time 10-80 (min) [9, 11, 25, 26] Current density 10-80 (mA/cm2) [9, 11, 25]
pH 2-5 [9, 11, 25]
H2O2/TW 0.25-2.3 (ml/l) [11]
H2O2 /Fe2+ 0.5-5 (mole/mole) [9, 11, 25]
TABLE 3. Independent variables and their levels obtained from the statistical software
Symbol Factor Coded levels of variables
-1 0 +1 -alpha alpha +alpha
×1 Reaction time 10 45 80 -38.24 45 128.24
×2 Current density 10 45 80 -38.24 45 128.24
×3 pH 2 3.5 5 -0.06 3.5 7.06
×4 H2O2/TW 0.25 1.27 2.3 -1.16 1.27 3.71
TABLE 4. Experimental matrix design for overall optimization
Run Block Reaction time Current density pH H2O2/TW H2O2/Fe2+
1 block 1 10 45 2 1.275 2.75
2 block 1 45 10 2 1.275 2.75
3 block 1 10 45 3.5 2.3 2.75
4 block 1 45 80 3.5 1.275 0.5
5 block 1 45 80 2 1.275 2.75
6 block 1 45 45 5 2.3 2.75
7 block 1 10 45 3.5 0.25 2.75
8 block 1 45 45 3.5 1.275 2.75
9 block 1 80 80 3.5 1.275 2.75
10 block 1 45 45 3.5 1.275 2.75
11 block 1 45 45 3.5 1.275 2.75
12 block 1 80 45 3.5 0.25 2.75
13 block 1 80 45 2 1.275 2.75
14 block 1 80 10 3.5 1.275 2.75
15 block 1 45 45 3.5 2.3 0.5
16 block 1 45 10 3.5 0.25 2.75
17 block 1 45 45 3.5 1.275 2.75
18 block 1 45 10 3.5 1.275 0.5
19 block 1 45 45 3.5 2.3 5
20 block 1 45 45 2 0.25 2.75
21 block 1 45 45 2 1.275 0.5
22 block 1 10 45 3.5 1.275 0.5
23 block 1 45 10 5 1.275 2.75
24 block 1 45 80 5 1.275 2.75
25 block 1 45 45 5 0.25 2.75
26 block 1 45 45 5 1.275 0.5
27 block 1 45 10 3.5 2.3 2.75
28 block 1 45 45 2 1.275 5
29 block 1 45 45 5 1.275 5
30 block 1 80 45 5 1,275 2.75
31 block 1 45 45 2 2.3 2.75
32 block 1 45 80 3.5 2.3 2.75
33 block 1 45 80 3.5 0.25 2.75
34 block 1 80 45 3.5 1.275 0.5
35 block 1 45 10 3.5 1.275 5
36 block 1 10 10 3.5 1.275 2.75
37 block 1 80 45 3.5 2.3 2.75
38 block 1 45 45 3.5 1.275 2.75
39 block 1 10 80 3.5 1.275 2.75
40 block 1 45 80 3.5 1.275 5
41 block 1 80 45 3.5 1.275 5
42 block 1 45 45 3.5 0.25 0.5
43 block 1 10 45 3.5 1.275 5
44 block 1 45 45 3.5 0.25 5
45 block 1 45 45 3.5 1.275 2.75
3. RESULTS AND DISCUSSION
3. 1. Regression Models and Statistical Analysis For the purpose of data analysis, analysis of variance (ANOVA) was continuously controlled. The regression model in the software was chosen. The combined effect of parameters on removal was checked by R2. Some small coefficients were ignored. The final correlations for COD [Equation (2)] and color removal [Equation (3)] prediction were investigated as:
COD removal (%) = 73.95 +7.33 A +4.43 B- 3.64 C + 5.08D +2.95 E+1.19AB – AC + 2.32 AD + 3.65 AE – 1.5 BC + 1.13 BE – 0.87 CD – 1.14 CE – 0.052 DE - 4.04 A2–9.28 B2 – 7.06 C2-7.67D2–8E2
(2)
Color removal (%) = 74.12 +7.86 A +3.54B – 2.81 C +4.78 D +3.2 E + 1.49 AB – 1.25 AC + 1.75 AD + 2.94 AE – 1.53 BC – 1.22 BD + 2.06 BE – 0.77 CD + 0.68 CE +1.51 DE – 2.45 A2 –9.69B2 -6.92C2–9.22D2 – 7.75 E2
(3)
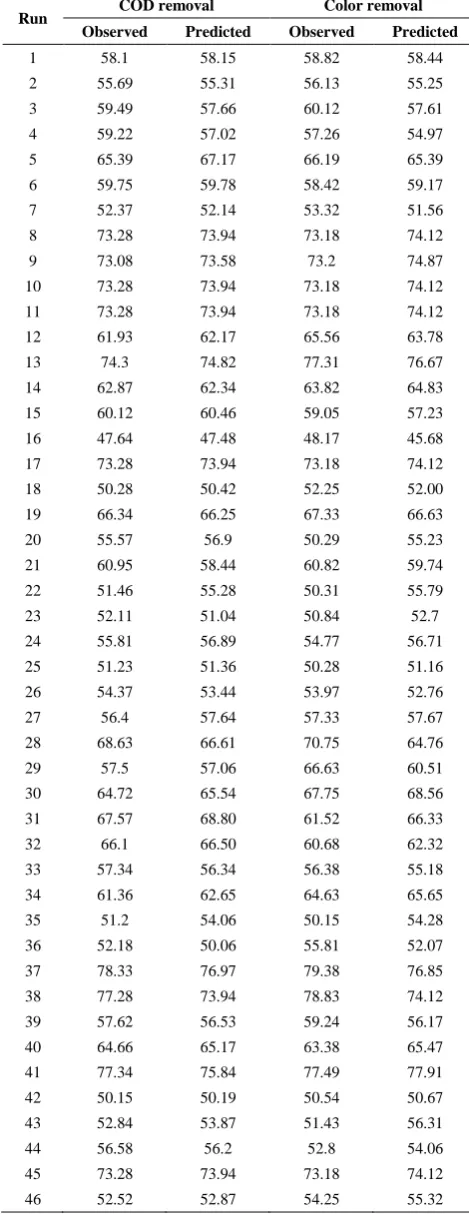
where, A, B, C, D and E are reaction time, current density, pH , H2O2/TW (ml/l) and H2O2/Fe2+ molar ratio, respectively. The experimental data (observed) and predicted ones (based on the above equations) for COD and color removal are shown in Table 5.
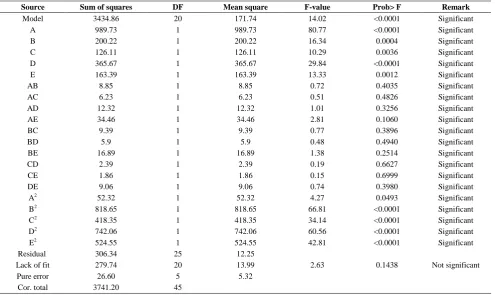
Tables 6 and 7 show the ANOVA for quadratic equation terms of COD and color removal, respectively. Analysis of variance which contains fitness test was conducted for evaluation of meaningful effects of process variables on each response. The meaningfulness of fitness test for a model means that the model is so well superposed on the points that it can be used for value prediction. The high amounts of F-value show that major differences in responses can be explained by regression model and the models are meaningful for COD and color removal. The prob>F-value shows that the correlation terms statistically are significant (for less than 0.05) or insignificant (for more than 0.05) [11, 14].
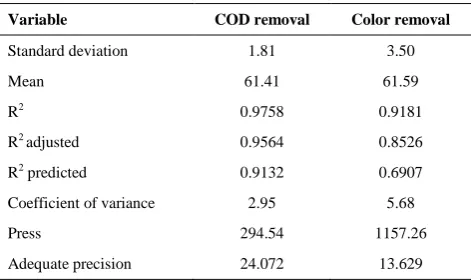
The statistical results for quadratic equation for COD and color removal are represented in Table 8. High amounts of R2 (0.9181 and 0.9758 for COD and color removal, respectively) show that quadratic equation is consistent with experimental data [11, 14, 27]. The closeness of R2, R2 adjusted, R2 predicted to one indicate that regression model is in good agreement with the experimental data. The coefficient of variance (CV) as the ratio of the standard error of estimate for the mean value of the observed response shows reproducibility of the model [14, 28]. The adequate precision (AP) measures the signal to noise ratio. AP is compared to the range of the predicted values at the design points to the average prediction error [11, 14]. The AP value greater than four is favorable and shows a proper signal. It means that the predicted models can direct the defined space by CCD.
TABLE 5. Observed and predicted data for COD and color
removal
Run COD removal Color removal
Observed Predicted Observed Predicted
1 58.1 58.15 58.82 58.44
2 55.69 55.31 56.13 55.25
3 59.49 57.66 60.12 57.61
4 59.22 57.02 57.26 54.97
5 65.39 67.17 66.19 65.39
6 59.75 59.78 58.42 59.17
7 52.37 52.14 53.32 51.56
8 73.28 73.94 73.18 74.12
9 73.08 73.58 73.2 74.87
10 73.28 73.94 73.18 74.12
11 73.28 73.94 73.18 74.12
12 61.93 62.17 65.56 63.78
13 74.3 74.82 77.31 76.67
14 62.87 62.34 63.82 64.83
15 60.12 60.46 59.05 57.23
16 47.64 47.48 48.17 45.68
17 73.28 73.94 73.18 74.12
18 50.28 50.42 52.25 52.00
19 66.34 66.25 67.33 66.63
20 55.57 56.9 50.29 55.23
21 60.95 58.44 60.82 59.74
22 51.46 55.28 50.31 55.79
23 52.11 51.04 50.84 52.7
24 55.81 56.89 54.77 56.71
25 51.23 51.36 50.28 51.16
26 54.37 53.44 53.97 52.76
27 56.4 57.64 57.33 57.67
28 68.63 66.61 70.75 64.76
29 57.5 57.06 66.63 60.51
30 64.72 65.54 67.75 68.56
31 67.57 68.80 61.52 66.33
32 66.1 66.50 60.68 62.32
33 57.34 56.34 56.38 55.18
34 61.36 62.65 64.63 65.65
35 51.2 54.06 50.15 54.28
36 52.18 50.06 55.81 52.07
37 78.33 76.97 79.38 76.85
38 77.28 73.94 78.83 74.12
39 57.62 56.53 59.24 56.17
40 64.66 65.17 63.38 65.47
41 77.34 75.84 77.49 77.91
42 50.15 50.19 50.54 50.67
43 52.84 53.87 51.43 56.31
44 56.58 56.2 52.8 54.06
45 73.28 73.94 73.18 74.12
TABLE 6. Analysis of variance for response surface quadratic model terms for COD removal
Source Sum of squares DF Mean square F-value Prob> F Remark
Model 3312.20 20 165.61 50.39 < 0.0001 Significant
A 860.69 1 860.69 261.87 < 0.0001 Significant
B 313.73 1 313.73 95.45 < 0.0001 Significant
C 211.63 1 211.63 64.39 < 0.0001 Significant
D 413.00 1 413.00 125.66 < 0.0001 Significant
E 139.12 1 139.12 42.33 < 0.0001 Significant
AB 5.69 1 5.69 1.73 0.2003 Significant
AC 4.00 1 4.00 1.22 0.2805 Significant
AD 21.53 1 21.53 6.55 0.0169 Significant
AE 53.29 1 53.29 16.21 0.0005 Significant
BC 9.00 1 9.00 2.74 0.1105 Significant
BD 0.000 1 0.000 0.000 1.0000 Significant
BE 5.11 1 5.11 1.55 0.2241 Significant
CD 3.03 1 3.03 0.92 0.3464 Significant
CE 5.18 1 5.18 1.57 0.2211 Significant
DE 0.011 1 0.011 3.354E-003 0.9543 Significant
A2 142.25 1 142.25 43.28 < 0.0001 Significant
B2 751.68 1 751.68 228.70 < 0.0001 Significant
C2 435.28 1 435.28 132.43 < 0.0001 Significant
D2 513.50 1 513.50 156.23 < 0.0001 Significant
E2 558.05 1 558.05 169.79 < 0.0001 Significant
Residual 82.17 25 3.29
Lack of fit 68.84 20 3.44 1.29 0.4208 Not significant
Pure error 13.33 5 2.67
Cor. total 3394.37 45
TABLE 7. Analysis of variance for response surface quadratic model terms for color removal
Source Sum of squares DF Mean square F-value Prob> F Remark
Model 3434.86 20 171.74 14.02 <0.0001 Significant
A 989.73 1 989.73 80.77 <0.0001 Significant
B 200.22 1 200.22 16.34 0.0004 Significant
C 126.11 1 126.11 10.29 0.0036 Significant
D 365.67 1 365.67 29.84 <0.0001 Significant
E 163.39 1 163.39 13.33 0.0012 Significant
AB 8.85 1 8.85 0.72 0.4035 Significant
AC 6.23 1 6.23 0.51 0.4826 Significant
AD 12.32 1 12.32 1.01 0.3256 Significant
AE 34.46 1 34.46 2.81 0.1060 Significant
BC 9.39 1 9.39 0.77 0.3896 Significant
BD 5.9 1 5.9 0.48 0.4940 Significant
BE 16.89 1 16.89 1.38 0.2514 Significant
CD 2.39 1 2.39 0.19 0.6627 Significant
CE 1.86 1 1.86 0.15 0.6999 Significant
DE 9.06 1 9.06 0.74 0.3980 Significant
A2 52.32 1 52.32 4.27 0.0493 Significant
B2 818.65 1 818.65 66.81 <0.0001 Significant
C2 418.35 1 418.35 34.14 <0.0001 Significant
D2 742.06 1 742.06 60.56 <0.0001 Significant
E2 524.55 1 524.55 42.81 <0.0001 Significant
Residual 306.34 25 12.25
Lack of fit 279.74 20 13.99 2.63 0.1438 Not significant
Pure error 26.60 5 5.32
TABLE 8. Quadratic model ANOVA results for COD and color removal
Variable COD removal Color removal
Standard deviation 1.81 3.50
Mean 61.41 61.59
R2 0.9758 0.9181
R2 adjusted 0.9564 0.8526
R2 predicted 0.9132 0.6907
Coefficient of variance 2.95 5.68
Press 294.54 1157.26
Adequate precision 24.072 13.629
3. 2. Process Optimization and Validation The optimum operating conditions for COD and color removal were obtained using the software. In this software, numerical optimization was used to achieve the maximum amounts of COD and color removal. In fact, all variables were targeted to be in a range and COD and color removal were goaled to be maximized. In order to confirm the reliability of the obtained optimum conditions, the theoretical and experimental data were compared. Both data are illustrated in Table 9. There is a very good agreement between the experimental data (observed) and theoretical ones (predicted).
Furthermore, Figure 2 compares the predicted data with the experimental ones. Both data properly cover each other when line R2 comes close to 1.
As found in this research, the optimum removal data were around 76.33% and 79.33% for COD and color removal, respectively. Moreover, the wastewater was analyzed in terms of BOD5 at the optimum condition. Therefore, BOD5/COD ratio was at 0.36.
In order to compare the electro-Fenton with Fenton process, an experiment was done at the optimum conditions without power supply. According to the recent experiment, the COD and color removals were around 66.59% and 67.47%, respectively (while they were 76.33% and 79.33% in the electro-Fenton process).
According to the literature, Torrades and García-Montaño reported 62.9% and 76.3% for COD removal by Fenton and photo-Fenton process from two effluents obtained from polyamide and polyester dyeing processes, respectively [29]. Duarte et al. obtained 66.3% COD removal by heterogeneous Fenton process in a continuous packed-bed reactor using Fe/activated carbon as catalyst [24]. Manenti et al. reduced the COD of wastewater from 1.2 g/l to 139 mg/l (around 88%) using a three-step process (electrocoagulation, photo-Fenton and biological oxidation) [30].
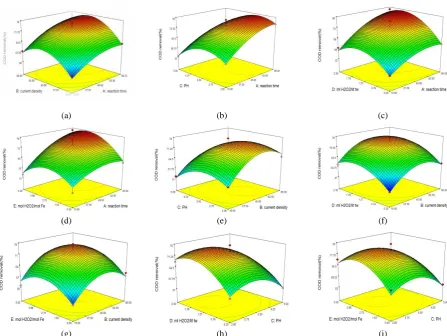
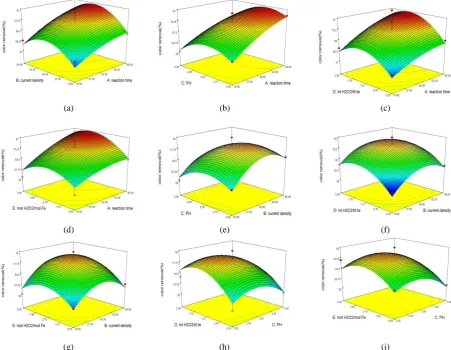
3. 3. Three-dimensional Plots of the Regression Using design expert software, the 3D plots for COD and color removal were drawn as shown in Figures 3 and 4 which show the effect of various operating parameters on COD and color removal, respectively. All variables have important roles in creating the optimum state and reaching the maximum amount of responses. The reaction time has a positive effect on COD and color removal. As shown in Figures 3 (a,b,c,d) and 4 (a,b,c,d), the removal increases with reaction time while the removal rate decreases. This is due to the reactants reduction and undesirable side reactions possibility in the cell [15]. The current density plays an important role in the electro-Fenton process because it controls the formation of the hydroxyl radical and the concentration of ferrous ions in the solution [6, 9, 11].
As shown in Figure 3 (e,f,g), COD removal increases when the current density increases from 10 to 40.11 mA/cm2. As shown in Figure 4 (e,f,g), color removal increases when the current density increases from 10 to 67 mA/cm2. This trend can be attributed to greater production of OH• at the surface of the anode and also higher electro-regeneration of ferrous ions from ferric ions at high current density, which increased the efficiency of Fenton chain reactions. The continuous conversion of Fe3+ into Fe2+ is a great advantage compared to chemical Fenton system [9, 25]. Hydrogen peroxide decomposes on the anode when the current density increases (more than the optimum value). In fact, OH• and hydrogen peroxide on the cathode generate water and the removal consequently decreases [14, 31].
Moreover, the value of pH solution is an important factor in the electro-Fenton process. Most of the studies show that the optimal value of pH is 2-5 [6-9, 11]. The pH enhancement (for pH>5) decreases the E-Fenton efficiency, rapidly. This is due to the H2O2 instability in the basic solution (H2O2 rapidly decomposes to water). Furthermore, H2O2 exchanges to H3O2+ (H2O2 cannot be changed to OH• by Fe2+) when pH decreases (for pH<2) [6, 7, 11].
As shown in Figure 3 (h,i), COD removal decreases when pH increases from 2.84 to 5. Moreover, color removal decreases with pH increasing from 2.98 to 5 as illustrated in Figure 4 (h,i). In fact, pH has an optimum level in the electro-Fenton process. Iron ions (in special Fe3+) settle when pH increases (more than the optimum value). Therefore, the Fenton reaction and removal decrease. More OH‾ and iron hydroxide [Fe(OH)2] are also produced at optimum pH. Therefore, it (with coagulant factors) causes more aggregation of suspended materials. The electro-Fenton efficiency will finally be improved [6, 23].
H2O2/TW (ml/l) and H2O2/Fe 2+
TABLE 9. Optimum conditions found by software (predicted) and experimental verification (observed) for COD and color removal
Response
Reaction time (min)
Current density (mA/cm2)
pH
H2O2
TW (ml/l)
H2O2
Fe2+
(mole/mole)
Removal (%)
Error%
Observed Predicted
COD removal 71.74 40.11 2.84 2.03 3.89 76.33 78.93 3.4
Color removal 75.97 67.04 2.98 1.69 3.09 79.33 81.04 2.2
(a) (b)
Figure 2. Predicted vs. actual values for (a) COD removal and (b) color removal
(a) (b) (c)
d)
) (e) (f)
(g) (h) (i)
Figure 3. Three-dimensional diagram of COD removal as a function of: (a) reaction time and current density, (b) reaction time
(a) (b) (c)
(d) (e) (f)
(g) (h) (i)
Figure 4. Three-dimensional diagram of color removal as a function of: (a) reaction time and current density, (b) reaction time
and pH, (c) reaction time and H2O2/TW (ml/l), (d) reaction time and H2O2/Fe2+ molar ratio, (e) current density and pH, (f) current density and H2O2/TW (ml/l), (g) current density and H2O2/Fe2+ molar ratio, (h) pH and H2O2/TW (ml/l) and (i) pH and H2O2/Fe2+ molar ratio.
An increase in H2O2 amount (an increase in a reactant) leads to COD and color removal. COD and color removal decrease when H2O2 increases (more than the optimal amount). This is due to hydroxyl radicals absorption [8, 9] and their conversion into hydroperoxyl radicals which have weaker oxidation power [9, 32].
The efficiency decreases when Fe2+ increases (more than the optimum value). This is due to the hydroxyl radicals consumption. Moreover, the generated ferric ions (Fe3+) decompose hydrogen peroxide in the cell. This has an undesired effect on the electro-Fenton process due to the OOH° generation [15, 32].
As shown in Figure 3 (j), COD removal decreases when H2O2/TW (ml/l) increases from 2.03 to 2.3. Furthermore, color removal decreases when H2O2/TW (ml/l) increases from 1.69 to 2.3 as shown in Figure 4 (j).
Moreover, there is an optimum level for H2O2/Fe2+ molar ratio as shown in Figures 3 (j) and 4 (j).
4. CONCLUSION
It is also concluded that iron electrode (as a cheap and available material) can properly treat an industrial textile wastewater by electro-Fenton process in terms of COD and color.
5. REFERENCES
1. Sahinkaya, S., "COD and color removal from synthetic textile wastewater by ultrasound assisted electro-fenton oxidation process", Journal of Industrial and Engineering Chemistry, Vol. 19, No. 2, (2013), 601-605.
2. Yilmaz, E., Memon, S. and Yilmaz, M., "Removal of direct azo dyes and aromatic amines from aqueous solutions using two β-cyclodextrin-based polymers", Journal of Hazardous Materials, Vol. 174, No. 1, (2010), 592-597.
3. Sabur, M., Khan, A. and Safiullah, S., "Treatment of textile wastewater by coagulation precipitation method", Journal of Scientific Research, Vol. 4, No. 3, (2012), 623-633.
4. Kobya, M., Bayramoglu, M. and Eyvaz, M., "Techno-economical evaluation of electrocoagulation for the textile wastewater using different electrode connections", Journal of Hazardous Materials, Vol. 148, No. 1, (2007), 311-318. 5. Tezcanli-Guyer, G. and Ince, N., "Degradation and toxicity
reduction of textile dyestuff by ultrasound", Ultrasonics Sonochemistry, Vol. 10, No. 4, (2003), 235-240.
6. Nidheesh, P. and Gandhimathi, R., "Trends in electro-fenton process for water and wastewater treatment: An overview", Desalination, Vol. 299, (2012), 1-15.
7. Neyens, E. and Baeyens, J., "A review of classic fenton’s peroxidation as an advanced oxidation technique", Journal of Hazardous Materials, Vol. 98, No. 1, (2003), 33-50.
8. Lee, H. and Shoda, M., "Removal of cod and color from livestock wastewater by the fenton method", Journal of Hazardous Materials, Vol. 153, No. 3, (2008), 1314-1319. 9. Mohajeri, S., Aziz, H. A., Isa, M. H., Zahed, M. A. and Adlan,
M. N., "Statistical optimization of process parameters for landfill leachate treatment using electro-fenton technique", Journal of Hazardous Materials, Vol. 176, No. 1, (2010), 749-758.
10. Guinea, E., Arias, C., Cabot, P. L., Garrido, J. A., Rodriguez, R. M., Centellas, F. and Brillas, E., "Mineralization of salicylic acid in acidic aqueous medium by electrochemical advanced oxidation processes using platinum and boron-doped diamond as anode and cathodically generated hydrogen peroxide", Water Research, Vol. 42, No. 1, (2008), 499-511.
11. Davarnejad, R., Mohammadi, M. and Ismail, A. F., "Petrochemical wastewater treatment by electro-fenton process using aluminum and iron electrodes: Statistical comparison", Journal of Water Process Engineering, Vol. 3, (2014), 18-25. 12. Panizza, M. and Cerisola, G., "Application of diamond
electrodes to electrochemical processes", Electrochimica Acta, Vol. 51, No. 2, (2005), 191-199.
13. Kuo, W., "Decolorizing dye wastewater with fenton's reagent", Water Research, Vol. 26, No. 7, (1992), 881-886.
14. Daneshvar, N., Oladegaragoze, A. and Djafarzadeh, N., "Decolorization of basic dye solutions by electrocoagulation: An investigation of the effect of operational parameters", Journal of Hazardous Materials, Vol. 129, No. 1, (2006), 116-122.
15. Jia—fa, J. C. c. Z., "Progress and prospect in electro—fenton process for wastewater treatment", Journal of Zhejiang University SCIENCEA, Vol. 8, (2007), 1118-1125.
16. Cruz-Gonzalez, K., Torres-Lopez, O., Garcia-Leon, A., Guzman-Mar, J., Reyes, L., Hernandez-Ramirez, A. and
Peralta-Hernandez, J., "Determination of optimum operating parameters for acid yellow 36 decolorization by electro-fenton process using bdd cathode", Chemical Engineering Journal, Vol. 160, No. 1, (2010), 199-206.
17. Wang, C.-T., Hu, J.-L., Chou, W.-L. and Kuo, Y.-M., "Removal of color from real dyeing wastewater by electro-fenton technology using a three-dimensional graphite cathode", Journal of Hazardous Materials, Vol. 152, No. 2, (2008), 601-606.
18. Wang, C.-T., Chou, W.-L., Chung, M.-H. and Kuo, Y.-M., "COD removal from real dyeing wastewater by electro-fenton technology using an activated carbon fiber cathode", Desalination, Vol. 253, No. 1, (2010), 129-134.
19. Garcia-Segura, S., Almeida, L. C., Bocchi, N. and Brillas, E., "Solar photoelectro-fenton degradation of the herbicide 4-chloro-2-methylphenoxyacetic acid optimized by response surface methodology", Journal of Hazardous Materials, Vol. 194, (2011), 109-118.
20. Khataee, A. R., Zarei, M. and Moradkhannejhad, L., "Application of response surface methodology for optimization of azo dye removal by oxalate catalyzed photoelectro-fenton process using carbon nanotube-ptfe cathode", Desalination, Vol. 258, No. 1, (2010), 112-119.
21. Virkutyte, J., Rokhina, E. and Jegatheesan, V., "Optimisation of electro-fenton denitrification of a model wastewater using a response surface methodology", Bioresource Technology, Vol. 101, No. 5, (2010), 1440-1446.
22. Azami, M., Bahram, M., Nouri, S. and Naseri, A., "Central composite design for the optimization of removal of the azo dye, methyl orange, from waste water using fenton reaction", Journal of the Serbian Chemical Society, Vol. 77, No. 2, (2012), 235-246.
23. Gogate, P. R. and Pandit, A. B., "A review of imperative technologies for wastewater treatment I: Oxidation technologies at ambient conditions", Advances in Environmental Research, Vol. 8, No. 3, (2004), 501-551.
24. Duarte, F., Morais, V., Maldonado-Hodar, F. and Madeira, L. M., "Treatment of textile effluents by the heterogeneous fenton process in a continuous packed-bed reactor using Fe/activated carbon as catalyst", Chemical Engineering Journal, Vol. 232, (2013), 34-41.
25. Davarnejad, R. and Sahraei, A., "Industrial wastewater treatment using an electrochemical technique: An optimized process", Desalination and Water Treatment, (2015), 1-13.
26. Ghanbari, F. and Moradi, M., "A comparative study of electrocoagulation, electrochemical fenton, electro-fenton and peroxi-coagulation for decolorization of real textile wastewater: Electrical energy consumption and biodegradability improvement", Journal of Environmental Chemical Engineering, Vol. 3, No. 1, (2015), 499-506.
27. El-Ghenymy, A., Garcia-Segura, S., Rodriguez, R. M., Brillas, E., El Begrani, M. S. and Abdelouahid, B. A., "Optimization of the electro-fenton and solar photoelectro-fenton treatments of sulfanilic acid solutions using a pre-pilot flow plant by response surface methodology", Journal of Hazardous Materials, Vol. 221, (2012), 288-297.
28. Korbahti, B. K., Aktas, N. and Tanyolac, A., "Optimization of electrochemical treatment of industrial paint wastewater with response surface methodology", Journal of Hazardous Materials, Vol. 148, No. 1, (2007), 83-90.
29. Torrades, F. and Garcia-Montano, J., "Using central composite experimental design to optimize the degradation of real dye wastewater by fenton and photo-fenton reactions", Dyes and Pigments, Vol. 100, (2014), 184-189.
V. J., "Assessment of a multistage system based on electrocoagulation, solar photo-fenton and biological oxidation processes for real textile wastewater treatment", Chemical Engineering Journal, Vol. 252, (2014), 120-130.
31. Gao, S., Yang, J., Tian, J., Ma, F., Tu, G. and Du, M., "Electro-coagulation–flotation process for algae removal", Journal of
Hazardous Materials, Vol. 177, No. 1, (2010), 336-343. 32. Pignatello, J. J., Oliveros, E. and MacKay, A., "Advanced
oxidation processes for organic contaminant destruction based on the fenton reaction and related chemistry", Critical Reviews in Environmental Science and Technology, Vol. 36, No. 1, (2006), 1-84. .
Application of Iron Electrode in Textile Industry Wastewater Treatment Using
Electro-fenton Technique: Experimental and Statistical Study
R. Davarnejad, P. Hosseinitabar
Department of Chemical Engineering, Faculty of Engineering, Arak University, Arak, Iran
P A P E R I N F O
Paper history: Received 10 April 2016
Received in revised form 28 May 2016 Accepted 02 June 2016
Keywords: COD Reduction Color Reduction Electro-fenton Iron Optimization
ديكچ ه
تسا یطیحم تسیس لکطم کی یبآ یاَ متسیس ي بآ ٍب اَ نآ ديري ي یجاسو عیاىص رد یعًىصم یاَ گور سا ٌدافتسا لاًمعم )زتسا یلپ ي کیلیزکا یلپ( یجاسو تعىص رد ٌذض ٌدافتسا یعًىصم یاَ گور .ذىتسَ یمس رایسب داًم لماض ازیس ید یاس گور داًم يزتکلا ذىیازف .ذىضاب یم نًىیکازتوآ ي يسآ تاقتطم سا اُوآ .ذىتسَ سزپس
تسا ذمآراک کیىکت کی نًتىف
ٌدام کی ناًىع ٍب( هَآ ديزتکلا ییاراک ٍک تسا نآ یلصا فذَ ٍعلاطم هیا رد .ذَد صَاک ار اُبلاضاف یتخس ذواًتیم ٍک ا شير ٍب یجاسو باسپ ی ٍیفصت رد ار )سزتسد لباقي ناسرا ی يزتکل
تیاذَ یا ٍوًگ ٍب تاطیامسآ .میىک یسرزب نًتىف
تبسو ي هَآ نًی ٍب نژيرذیَ ذیسکازپ یلًم تبسو ،یساب ي یذیسا ی ٍجرد ،نایزج یلاگچ ،صىکاي نامس زیثات ات ذوذض ات ات ذض ٌدافتسا خساپ ی ٍیير شير .ذىىک یبایسرا ذىیآزف دزکلمع یير ار یجاسو باسپ ٍب نژيرذیَ ذیسکازپ یمجح زیث
ار یتایلمع طیازض ي ذىک یبایسرا باسپ رد گور ي سایو درًم ییایمیض نژیسکا زتماراپ يد فذح یير ار لقتسم زیغتم جىپ نامس رد ٍىیُب طیازض .ذىک ٍىیُب 74
/ 71 نایزج یلاگچ ،ٍقیقد 11
/ 40 زبازب یذیسا ی ٍجرد ،عبزم زتم یتواس زب زپمآ یلیم
84 / 2 ٍب نژيرذیَ ذیسکازپ یمجح تبسو ، زبازب باسپ
03 / 2 هَآ نًی ٍب نژيرذیَ ذیسکازپ یلًم تبسو ي زتیل زب زتیل یلیم
زبازب 89 / 3 راذقم ٍب سایو درًم ییایمیض نژیسکا فذح یازب 33
/ 76 نامس رد ٍىیُب طیازض ٌيلاع ٍب .ذمآ تسد ٍب ،% 97
/ 75
نایزج یلاگچ ،ٍقیقد 04
/ 67 زبازب یذیسا ی ٍجرد ،عبزم زتم یتواس زب زپمآ یلیم 98
/ 2 نژيرذیَ ذیسکازپ یمجح تبسو ،
زبازب باسپ ٍب 69
/ 1 زبازب هَآ نًی ٍب نژيرذیَ ذیسکازپ یلًم تبسو ي زتیل زب زتیل یلیم 98
/ 2 راذقم ٍب گور فذح یازب
33 / 79 .ذمآ تسد ٍب ،%