606
Copyright © 2011-15. Vandana Publications. All Rights Reserved.
Volume-5, Issue-2, April-2015 International Journal of Engineering and Management Research Page Number: 606-610
Investment Pattern of Investors in Aruppukottai Town
Kajapriya R1, Surya R2 1,2
M. Phil Research Scholar, Department of Management Studies, VHNSN College (Autonomous), Virudhunagar, INDIA
ABSTRACT
Currently, investors could find diverse avenues to invest their earnings. Investors are always expects for better returns and each investor have his/her own investment pattern. This paper puts-forth the factors motivating the investors to invest in particular avenue, analyzing the attitude of the investors while choosing the venue for investment and to understand the preference of the investors, the respondents are provided with questionnaire for primary data and the collected data have been analyzed by percentage and chi-square analysis.
Keywords---- Investment pattern, Investors attitude, Preference, Investment Avenue
I.
INTRODUCTION
“Never depend on single income, Make investment to create a second source”- Warren buffet. The dictionary sense of investment is to entrust money in order to receive financial return or to make utilize of the money for potential benefits or advantages. People consign money to investments with a hope to increase their future wealth by investing money to spend in future livings. Investment benefits both economy and the society. It is an outgrowth of economic development and the maturation of modern capitalism. For the economy as a whole, aggregate investment sanctioned in the current period is a major factor in determining aggregate demand and, hence, the level of employment.
Investments are often thought of as pieces of
paper rather than part ownership of a company. Investors are often impatient to sell a good stock. Investors often make a distinction between money easily made from investments, savings or tax refunds and hard earned money found money is more readily spent or wasted. Investors often take a short term viewpoint. Recent market losses lead to suspicion and caution, while recent gains lead to action. Investors follow the crowd, and are heavily influenced by other investors or compelling news; they fail to check out the real facts. Investors become obsessed with prices and trend watching, rather than solid information. Each person has his own personal psychology and response style.
II. METHODOLOGY
Equity investors on the Indian bourses have had a rather smooth ride over the past decade, with charts continuing to rise till the sharp fall during the global slowdown in late 2008. Fortunately, the markets have bounced back. The market mood depends on investment patterns adopted by entities such as FIIs, hedge funds, endowment funds, mutual funds and retail investors (Money Today, 2011).
Investors Attitude towards Investment
• The study has been performed among 100 respondents as a sample size.
• The survey has been conducted in the location of Aruppukottai Town.
• The sample has been selected by the method of convenience sampling.
• Both primary and secondary data has been collected for analysis through different sources. • Primary Data has been collected by using
questionnaire method.
• Questionnaire was framed with the questions related to the investor’s demographic profile and investment pattern of investors.
607
Copyright © 2011-15. Vandana Publications. All Rights Reserved.
III. DATA ANALYSIS AND
INTERPRETATION
Table No. 1
Table of Demographic Classification
S. No.
Demographic Variables No. of Responses
(%)
1 Gender Male 56.00
Female 44.00
2 Age < 25 04.00
26-35 59.00
36-45 9.00
46-55 15.00
>56 13.00
3 Educational Status
Illiterate 08.00 Primary 08.00 H. S. C 18.00
Degree 16.00
PG Degree 37.00 Dip/ITI/Other 13.00 4 Status of
Occupation
Farmer 16.00
Home Maker 02.00 Employed 32.00 Business 14.00 Professional 16.00
Others 20.00
5 Annual Income < 60, 000 20.00 60001-120000 14.00
120001-180000
27.00 > 180000 39.00 6 Marital Status Married 58.00 Unmarried 42.00
Source: Primary Data
The exceeding table 1 shows that out of the 100 sample respondents
(1) 56 per cent of them belong to male category;
(2) 59 per cent of the respondents fall in the age group of 26-35 years;
(3) A significant number of investors (37) have Post Graduate level educational qualification;
(4) 32 per cent of them are employed;
(5) 39 percent of the investors fall in the income group of above Rs.1, 80,000 and
(6) Majority of them (58 per cent) are married.
A most preferable 10 different avenues of investment have been listed in the questionnaire and investors are
requested to reveal their pattern of investment.
Table No. 2
Various Investment Avenues
Sl. No
Investment Avenues No. of Respondents
1 Bank Deposits (RD/FD) 75
2 Company Deposits 8
3 Post office Savings 45
4 LIC 74
5 Chit Funds 8
6 Mutual Funds 17
7 Government Bonds 8
8 Corporate Securities 11 9 Bullion (Gold / Silver) 72
10 Real Estate 39
Source: Primary Data
Table 2 represents that 75 were invested in Banks followed by LIC (74) and Bullion (72). Similarly 45,39,17,11,8,8,8 investors have invested in Post Office Small Savings Schemes, Real Estate, Mutual Fund, Corporate Securities, Chit Fund and Company Deposits respectively.
Table No. 3 Type of Investors
S. No Types of Investors No. of
Respondents (%)
1 Risk Averters 51.00
2 Risk Moderates 39.00
3 Risk Takers 10.00
Source: Primary Data
The exceeding table exposes that out of the 100 sample respondents 51 per cent of the respondents fit in to ‘Risk Averter’ category, which means they do not want to invest in the risky assets.
Table No. 4
Various periods of Investments of Respondents
S. No
Investment Avenues
< 1 year
1-3 years
3-5 years
> 5
years Total
1 Bank Deposits 8 9 15 43 75 2 Company
Deposits 0 0 5 3 8
3 Post office
Savings 2 15 9 19 45
4 LIC 6 11 8 49 74
608
Copyright © 2011-15. Vandana Publications. All Rights Reserved.
6 Mutual Funds 4 5 8 0 17 7 Government
Bonds 1 0 0 7 8
8 Corporate
Securities 2 2 5 2 11
9 Bullion (Gold /
Silver) 6 18 14 34 72 10 Real Estate 1 8 8 22 39
Source: Primary Data
Table 4 represents that maximum of investors holding their investments more than five years, which clearly represents that most of the investors are deciding for long term investment for better returns.
Table No. 5
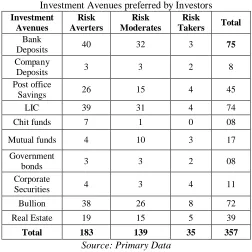
Investment Avenues preferred by Investors
Investment Avenues
Risk Averters
Risk Moderates
Risk
Takers Total
Bank
Deposits 40 32 3 75
Company
Deposits 3 3 2 8
Post office
Savings 26 15 4 45
LIC 39 31 4 74
Chit funds 7 1 0 08
Mutual funds 4 10 3 17
Government
bonds 3 3 2 08
Corporate
Securities 4 3 4 11
Bullion 38 26 8 72
Real Estate 19 15 5 39
Total 183 139 35 357
Source: Primary Data
Table 5 represents the investment avenues preferred by the Risk Averters, Risk Moderates, and Risk Takers are listed.
Table 6 represents the investment decisions based on educational status of the investors. Around 43 investors are influenced to invest just because of their own decision.
Table No. 7
Investment Interval based on Income Annual Income
(In Rs.) S.
No
Interval
in MakingBelow 60,001 to 1,20,001
Above 1,80,000Total
Investment 60,000 1,20,000 to
1,80,000
1 Weekly 0 0 0 1 1
2 Monthly 6 5 4 10 25
3 Quarterly 1 5 4 3 13
4
Half-Yearly 3 2 10 9 24
5 Annually 10 2 9 16 37
Total 20 14 27 39 100
Source: Primary Data
609
Copyright © 2011-15. Vandana Publications. All Rights Reserved.
Table No. 8Motivational Factors of Investors to Invest in Different investment avenues
Ranking in Order
S.
No Motivational 1 2 3 4 5 6 7 8 Total
Factors
1 Security 4 40 21 20 8 4 2 0 100
2 Safety 76 17 5 3 0 1 0 0 100
3 Liquidity 2 12 18 24 29 9 4 2 100
4 Income tax benefit 0 3 4 9 11 32 16 25 100
5 Higher rate of
return 14 15 31 22 15 0 2 1 100 6 Protection from
inflation 0 0 2 3 0 8 26 61 100 7 Capital
appreciation 3 11 14 16 15 18 17 6 100 8 Easy purchase 1 2 5 3 22 29 33 4 100
Total 100 100 100 100 100 100 100 100
Source: Primary Data
Table 8 represents the Motivational Factors of Investors to Invest in Different investment avenues.
Table No. 9
Investment Related Documents protection
Investment Documents No. of Respondents (%)
Yes 73 (73%)
No 27 (23%)
Source: Primary Data
Table No. 10 Investment Evaluation Choice
Investment Evaluation No. of Respondents (%)
Yes 37 (37%)
No 63 (63%)
Source: Primary Data
Table No. 11
Investment Evaluation Choice Interval
Interval No. of Respondents (%)
Monthly 5 (13.51%)
Quarterly 7 (18.91%)
Half yearly 10 (27.07%)
Annually 15 (40.54)
Total 37 (100%)
Source: Primary Data
Table No. 12
Financial Magazines, Newspaper, weeklies Subscription
Financial Magazines,
Newspaper, weeklies No. of Respondents (%)
Yes 12 (12%)
No 88 (88%)
Total 100 (100%)
Source: Primary Data
IV. FINDINGS OF THE STUDY
• The above study confirms that majority of the investors are giving much importance for the factor “Safety.”
• Similarly investment avenues such as Bank deposits, LIC polices and Bullion has been preferred by the individual investors.
• The attitude of the investors towards the protection of investment document is high and low towards investment evaluation.
• That majority of our respondents are come under 26-35 age category and 58 respondents are married out of 100 respondents.
• Investors who have preferred post office small savings schemes, Bank deposits, LIC policies, Government bonds, Real estate have invested for Above 5 years.
• Interval in making investment is not affected by Annual Income of the respondents.
• Majority of the investors (73%) are preserving their investment related documents. Majority of the investors (63%) do not have the habit of evaluating the performance of their investment choice.
• Out of the 37 investors 40.54 percent of them have been evaluating their investments once in a year.
• It can be inferred that 88% of the respondents have not subscribed for financial weeklies/magazines or newspapers to gain knowledge about various investment avenues
V
.SUGGESTION AND CONCLUSION
610
Copyright © 2011-15. Vandana Publications. All Rights Reserved.
REFERENCES
[1] BrammaBhatt et al., A study on Investors Behavior on Investment Avenues in Mumbai Fenil. TRANS Asian Journal of Marketing and Management Research, Vol. 1 (1), pp. 41-79, 2012.
[2] C.R. Kothari, Research methodology: methods and techniques, Vishwa Prakashan, New Delhi, pp. 21-151. 1999.
[3] CRISIL Report. Risk Management Skill: Key to Bank’s Survival. The Financial Express, Daily, Vol. 6 (10), 2010.
[4] D. Cooper and Schindler, Business research methods, Tata McGraw Hill, New Delhi, pp. 138 -170, 2007.
[5] Natarajan L, Investment Management (Security Analysis and Portfolio Management), Margham Publications, Chennai, 2005.
[6] Prasanna Chandra, Investment Analysis and Portfolio Management, 3rd Edition, Tata McGraw Hill Education Pvt, New Delhi. 2009.