17
Copyright © 2011-15. Vandana Publications. All Rights Reserved.
Volume-5, Issue-2, April-2015
International Journal of Engineering and Management Research
Page Number: 17-21
An Approach to Improve the Performance of Compressor & Pneumatic
System Efficiency of the Manufacturing Plant
Amit Meshramˡ, Saket Dharamshahare², Roshni Hinge³
1,2,3
PG Student M-Tech (Mechanical Engineering Design), Department of Mechanical Engineering, Priyadarshini College of Engineering Nagpur, Maharashtra, INDIA
ABSTRACT
An efficient compressed air system does not just happen; it is the product of good planning to ensure minimum pressure loss in the distribution system and the removal of most contaminants. Obviously an inefficient system results in higher cost per unit of compressed air, shortened components life and reduced capacity of compressor. These problems all cost to industry million of dollars a year. This paper highlights how to improve the performance or efficiency of compressor and how to overcome the air leakages in the compressed air system such that it impact on energy conservation techniques in minimizing the energy loss in Industries.
Keywords--- Cost, Compressed air Drive, Dryer,
Efficiency, Galvanization (Galva), Losses, Leakages, Reduction.
I.
INTRODUCTION
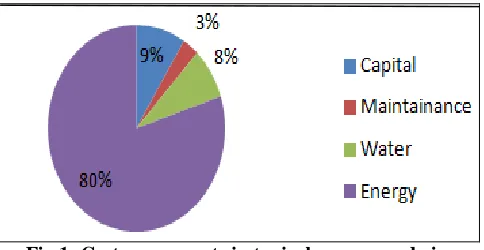
Industrial plant use compressed air throughout their production operations, which is produced by compressed air units ranging from 5 hp to 50,000 hp. The U.S Department of energy (2003) reports 70% to 90% of compressed air is lost in the form of unusable heat, friction, misuse and noise. For this reasons compressors and compressed air system are important areas to improve energy efficiency in industrial plant. It is noted that the running cost of compressor is far higher than that the actual cost of compressor itself as shown in fig. Energy saving from system improvement can range 20 to 50 % or more of electricity consumption resulting in thousands of dollars. A properly managed air system can save energy, reduce maintenance, reduce downtime, increase production, improved product quality.
Fig 1: Cost components in typical compressed air system
Compressed air system consists of supply side which include compressor and air treatment and demand side which include storage and end use equipment. A properly managed supply side will result in clean dry air being delivered at appropriate pressure in a dependable and cost effective manner. A properly managed demand side minimizes waste air and uses compressed air for appropriate applications.
II.
MAIN
COMPONENTS
OF
COMPRESSED
AIR
SYSTEMS
Intake air filters: Prevent dust from entering the
compressor.
Inter staged coolers: Reduce the temperature of air before it enters to the next stage to reduce work of compression and increase efficiency.
After coolers: The objective is to remove the moisture
from air by reducing the temperature.
Air dryers: The remaining traces of moisture are to be
removed by air dryers as air for pneumatic equipment has to be free from moisture.
18
Copyright © 2011-15. Vandana Publications. All Rights Reserved.
remove moisture from the compressed air.
Receivers: air receivers are provided as storage and
smoothening pulsating air output reducing pressure variation from the compressor.
III.
TYPES
OF
COMPRESSERS
A] Positive Displacement Compressor: In this type of compressor given quantity of air or gas is entrapped in compression chamber and the volume it occupies is mechanically reduced, causing corresponding pressure rise prior to discharge. There are two types of positive displacement compressor.
I. Reciprocating type: It is widely used in air and
refrigerant compression, it work on piston assembly, the compressor capacity is directly proportional to its speed.
II. Rotary compressor: Rotary compressor has rotors
in place of pistons and gives continuous pulsation free discharge. They operate at high speed and generally provide higher output than reciprocating compressor, its type Lobe compressor, Screw compressor, Rotary vane.
B] Dynamic Compressor: Dynamic compressors impart velocity energy to continuously flowing air by means of impellers rotating at very high speed. The velocity energy changes into pressure energy both by impellers and the discharge volutes. Its types are:
I. Centrifugal compressor.
II. Axial compressors.
Table 1: General selection criteria of compressor (Confederation to Indian Industries)
SPECIFICOBJECTIVEOFTHESTUDY
• Optimum utilization of existing assets.
• To improve the efficiency of compressor.
• To study and overcome the air leakages.
• Study and analysis of benefit of VFD.
• To focus on energy conservation in Industry.
IV.
RESEARCH
METHODOLOGY
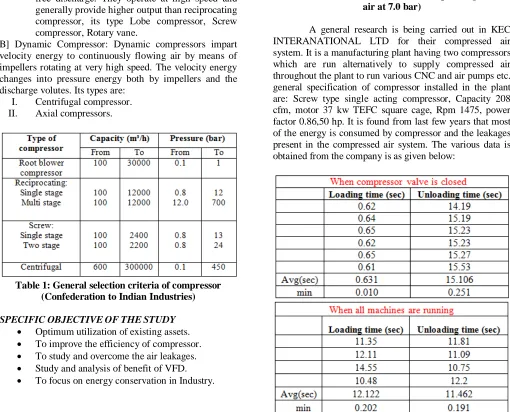
Leakages cause the wastage of energy in an industrial air system. Leakages drop the pressure of the system due to which pneumatic equipment operate less efficiently. Leaks increased the running time of compressor. According to NATURAL RESOURCES OF CANADA even a small leakage in the system can add significant cost.
Table 2: (Based on Rs. 5 / kWh; 8000 operating hours; air at 7.0 bar)
19
Copyright © 2011-15. Vandana Publications. All Rights Reserved.
Table 3: Different readings in the plant (including Galva)
Leakage % = (load time / load time + unload time) = 24.74 %
It shows that the system efficiency is only 75.25 %
Compressor capacity= 208 cfm Cut in pressure (kg/cm2) = 6.5 Avg load time (min) = 0.111 Cut out pressure (kg/cm2) = 7.5 Avg unload time (min) = 0.338
Load KW drawn = 1.732 x V x loading current x power factor / 1000
= 1.732 x 440 x 68 x 0.86 / 1000 = 44.566
Unload KW drawn = 1.732 x V x unloading current x power factor / 1000
= 1.732 x 440 x 33.5 x 0.86 / 1000 = 21.955
Leakages quantity (cfm/min) = (load time / load + unload time) x compressor capacity
= 51.42
Leakages /day (cfm/day) = leakages qty x 60 x 24 = 74046.15
Specific power for compressed air generation (kwh/cfm) =
load kw drawn/ comp capacity x 60 =44.566/208 x 60
= 0.00357
Energy lost due to leakage / day (kWh) =
74046.15 x 0.00357 = 264.42
Energy lost due to leakage/ year (kWh) = 95191.33 IF COST OF PER UNIT IS RS 5/-
PER DAY LOSS RS = 1560.08 PER YEAR LOSS RS = 561630.02
The percentage of leakage is 24.74% and system efficiency is 75.25%.
V.
ANALYSIS
METHODOLOGY
To overcome this inefficiency of the compressor in KEC INTERNATIONAL LTD following analysis is done:
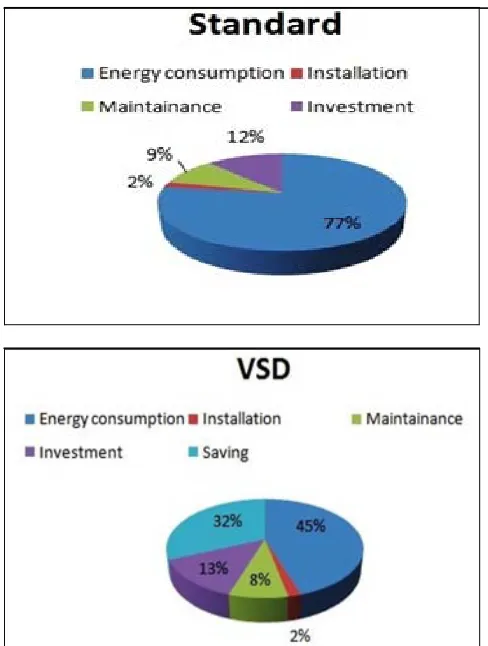
a) VFD: VARIABLE SPEED DRIVE with the help of
VSD compressor is able to follow the fluctuating demand by varying the speed of the drive motors they reduce the total energy consumption by compressor to a minimum extent and save up to 30-35 % of energy. The VSD compressor can prove to be of a great help in order to reduce the expenditure in running the compressor and thereby helps to reduce the overall production cost.
20
Copyright © 2011-15. Vandana Publications. All Rights Reserved.
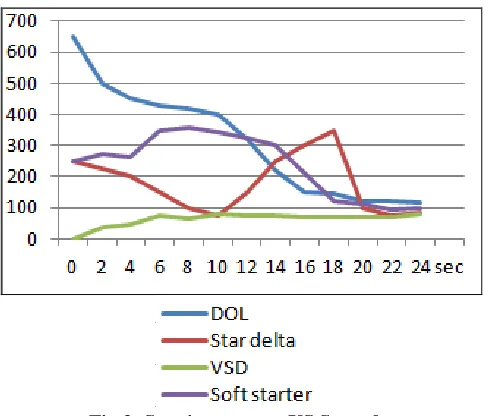
Fig 3: Starting current VS Seconds
The key feature of VSD compressor is the capability to follow the fluctuating air demand by varying the speed of its drive motor and cut the cost of compressed air energy up to 35% Avg =12.95 Kw approx.
Cost of power saving = 12.95 Kw-Hr x 24 Hrs x 30 Days x 12 Months x Rs5 /-
= Rs 5, 59,440/- (per year)
b) Reduced losses in pipes: Selection of piping system is the main factor hence we have to concentrate on selection of pipe, configuration, diameter, insulation etc because they have their own impact on energy consumption of system. Hence we have to use Aluminum pipe because they posses clean air, light weight, low dilatation, good internal quality, versatility, simple assembly, quick modification etc
Fig 4: losses in pipes
Pipe bore (mm)
Pressure drop per 100 m
Equivalent power loss in kw
40 1.80 9.5
65 0.22 1.2
80 0.04 0.2
100 0.02 0.1
Table 4: Typical pressure drop in compressed air line of different size pipe
c) Air intake temperature: Air intake temperature should
be less because every 4degree rise in inlet air temperature will rise in higher energy consumption by 1 5 to achieve output.
d) Pressure drop in air filters: pressure drop in air filters should be less because for every 250mm WC increases across the suction path due to choked filters etc, the compressor power increased by 2% for the same output.
e) Segregation: Segregation should be made of high and
low pressure requirement, it is advisable to generate low pressure and high pressure air separately and feed to the respective section.
f) Other factors: other factors also to be taken into
consideration like minimizing leakages, pressure control, proper maintenance and condensate removals etc
VI.
EXPECTED
OUTCOMES
The following output is to be made by adopting the various techniques as mentioned above.
BEFORE
21
Copyright © 2011-15. Vandana Publications. All Rights Reserved.
Leakages /day (cfm/day) = 74046.15
Energy lost due to leakage / day (kWh) = 264.42
LEAKAGES = 24.74%
VII.
CONCLUSION
AFTER
Avg load time (min) = 0.071 Avg unload time (min) = 0.445 Leakages quantity (cfm/min) = 28.62 Leakages /day (cfm/day) = 41213.02
Energy lost due to leakage / day (kWh) = 147.17
LEAKAGES = 13.76 %
From the case study made on compressor & pneumatic system in KEC INTERNATIONAL LTD it can be concluded that with the help of various process mention it this paper we can improve the performance of the compressor as well as efficiency of the compressed air system in various industries and it will be boon for energy conservation in industries. The analytical data provided in this paper is just a mathematical approach to show the various components. This practice will lead India to save electricity as much as possible.
REFERENCES
[1] DuanLiping (2011), Analysis of the relationship
between international cooperation and scientific
publications in energy R&D in China, Applied Energy, 88(12), 4229-4238.
[2] McKane, A and Medaris, B. The Compressed Air Challenge-Making A Different For US Industry 2003. [3] National Productivity Council India. Compressors. In Technology Menu For Efficient Energy Use, motor Drive System (NPC) 1993
[4] Sustainable Energy Development Office Government Of Western Australia Compressed Air System 2002. [5] US Department Of Energy (US DOE) Energy Efficiency And Renewable Energy, Improving Compressed Air System Performance DEO/GO-102003-1822.2003 [6] US Department Of Energy, Energy Efficiency And Renewable Energy, Industrial Technology Program Energy Tips-Compressed Air Tip Sheet 3, 2004
[7] Nirmal Kumar C.Nair, Garimella Niraj (2010), Battery energy storage systems: Assessment for small-scale
renewable energy integration, Energy and Buildings,42
(11),21-27.
[8] SaidurR.,IslamM.R.,RahimN.A.,SolangK.H.(2010),,A
review on global wind energy policy, Renewable and
Sustainable Energy Reviews,9(1)1744-1762
[9] NoamLior (2008), Energy resources and use:
Thepresentsituationandpossiblepathstothefuture,Energy,33( 6),842-857
[10] P.Grolier A Method To estimate The Performance Of Reciprocating Compressor, International Compressor Engineering Conference, Paper 1510(2002)