681
Copyright © 2011-15. Vandana Publications. All Rights Reserved.
Volume-5, Issue-2, April-2015
International Journal of Engineering and Management Research
Page Number: 681-688
Coastal Hazard Zonation between Vembar and Kallar Coasts of Tuticorin
using High Resolution Satellite Images and GIS
M. Rajamanickam1, M. M. Poonkodi2, K. Senthamarai3, A. Mohamed Sathik4, B. Jose Ravindra Raj5, R. Vijaya Sarathy6, K. R. Keerthi Raman7, V. Santhosh Raja8
1
Centre for Disaster Management, PRIST University, Thanjavur, INDIA
2,3,4
Post Graduate Student, Department of Civil Engineering, PRIST University, Trichy-Thanjavur Highway,Vallam, Thanjavur, INDIA
5,6,7,8
Assistant Professor, Department of Civil Engineering, PRIST University, Trichy-Thanjavur Highway,Vallam, Thanjavur, INDIA
ABSTRACT
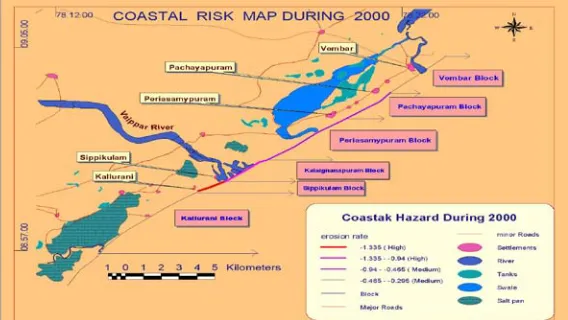
Some of the most vulnerable and hazardous regions of the Indian subcontinent, stretching more than 7000 km with high population density lie along the coastal borders. Most of these zones are frequented by several hazards, like storms, cyclones, hurricanes, tornadoes, tidal effects and similar natural and weather – related calamities. While natural hazards like flood and drought-which too cause widespread destruction and death- can be minimized and controlled, mitigation in coastal sectors expecting forewarning and evacuation – stands beyond human control. In our study the remote sensing techniques and beach profile studies have been attempted to identify the geomorphic features and shoreline changes. LISS III 2001 and LISSIII and PAN merged data of the year 2001 have been utilized to prepare the coastal geomorphologic features. In addition, Geographic Information System (GIS) software’s viz ARCGIS 10 version is used as a tool to delineate the coastal hazard zonation map for better perspective management. Beach profile studies have also been carried out to delineate the changes in the beach morphology. The variables like coastal geomorphology, geology, shoreline changes, and degree of shoreline stabilization, over wash penetration, wave damage and regional tectonic movements have been integrated to delineate the coastal hazard in the study area. Based on the GIS analysis and the degree of coastal erosion, it has been classified as (i) very high, (ii) high (iii) medium (iv) low. Thus the study area has been categorized into four different zones viz. (i) very high at Kalaignanapuram, (ii) high at Periyasamypuram and Sippikulam (iii) medium (iv) low at Vembar and Pachyapuram. Based on the zonation classification, we have prepared the coastal risk map.
Keywords---- LISS III, PAN, GIS, Beach profile
I.
INTRODUCTION
682
Copyright © 2011-15. Vandana Publications. All Rights Reserved.
II.
STUDY AREA
The investigated area is located in the coastal tract of southern Tamilnadu. The coastal stretch between Kallar and Vembar extends over a distance of about 24 km in length. The area is located between 80 55’ to 90 55’N and 780 10’ to 780
III.
METHODOLOGY
19’E covering the districts of Ramanathapuram and Tuticorin (Fig.1). The investigated area is chiefly underline by Precambrian gneisses, charnockites and granites besides Quaternary sediments. The stretch of coastal can be classified as a shoreline of emergence as identified from the beach ridges scattered (Loveson, 1994; Chandrasekar et al, 2000).The major geomorphological features like shoreline, , beach ridges, etc were demarcated from LISSIII and PAN merged data of Kallar and Vembar coast (Chandrasekar et al, 2000).The pattern of drainage in this area is mainly controlled and influenced by the presence of rivers like Gundar, Vembar, Vaippar and Kallar.
3.1. Beach Profile Survey
The Measurements of monthly beach profile taken at the six stations covers 24 km length coastal stretches. The profile measurements were taken perpendicular to the coast. The ‘Stack and horizon’ method (La Fond (1954), Prasada Rao, 1985) was used for beach profile survey. The leveling above mean sea level, MSL and below sea level, MSL data are adjusted to MSL datum using fixed benchmark of known elevation, located behind the beach. During the lowest-low period, so that maximum length of the beach crosses section was exposed. Commonly beach has two or three site profile. reference point of site from where all measurements are made from the reference point. The end of the profile is the offshore steep, near the wave break point where there is a marked steep. Figure shows the typical beach profile components and its segments.Figure.2 shows a schematic of a beach profile and its segments. Using Abney level and ranging poles, the slope of all profile segment are recorded (eg. slope 1 for profile segment A-B). Distance of ground along each segment profile is also recorded (eg. distance d1 for segment A-B). shown in Figure.2.
3.2. Coastal Hazard Delineation
In the present research the hazard maps were prepared based on collection of beach profile parameters like beach length, Beach width, and beach slope and erosion and accretional area estimation. The coastal hazard map was prepared using Arcinfo 7.2.1 GIS software’s that could combines geographic data (the field data, location of man-made and natural features on the earths Surface) and other types of information (names, classifications, addresses and much more) for answering queries, Performing analysis, and generating thematic maps. For
this study, the various coastal related spatial data’s like geology, geomorphology, relief, and shoreline change…. so on, similarly attribute data are generated, finally generated all the maps were integrated and coastal hazard delineation method was followed by cumbers method (2000c) used mean annual and monthly beach change rates were used to establish five coastal erosion categories namely, very high, High, Moderate/Medium and Low/Very low(shown Table.1)in our study area the coastal hazard maps were prepared based on coastal erosion information on different years like 2000, 2001 and 2002. Finally, coastal hazard map was prepared.
IV.
RESULTS AND DISCUSSIONS
4.1) Monthly Beach Sand Change Rate
The verification of beach profile levels measured from November 2000 to October 2001 was collected. In additionally the seasonal variation of beach profile on pre monsoon 2002 and Monsoon 2002 were collected. The monthly sand level variation trends during different months are shown in Table (2) showings the monthly sand levels between the study areas were shown.
The Vembar is located at the northern most part of the study area; the beach is characterized by cliff coast. As observed from the Table (3) the beach sand change rate higher in April, June and July months. The sand loss of sand from February, March and May, August, October and November months, because of during the southwest monsoon, the strong wave convergence towards SW direction, which gave rise to sand level on beaches. In additionally the average Beach sand change was ranges from 6.2 to 6.6m/year.
In the same way, Pachayapuram Station, sand is added to the profile from 2nd half on NE monsoon, hot weather season (except May month) and southwest monsoon. During the post monsoon season, the high secondary waves and current prevail. Resulting large mass of area has been losses during the season; the beach erosion rate is ranging from 6.7 to 9.8 m /month. The average beach sand change rate is ranging from 8.19m – 8.13m/mmonth.
The next to Periasamypuram beach has experienced eroded during second half of NE monsoon (the beach erosion rate ranges from 6.7 to 7.9m/month (shown in table no.3), the hot weather season (Erosion rate ranges from 6.2m to 6.8m/month).In additionally during the post monsoon season (4.5 m-6.4m).more over, the beach sand level rises on first half of NE Monsoon, this period the wind direction changed and sand accumulated and reached maximum by the 1st
Similarly At station Kalaignanapuram the beach exposed with rock outcrops, that exposed at 20 m inside the sea and the inshore is studded with rocks like
683
Copyright © 2011-15. Vandana Publications. All Rights Reserved.
horseshoe. The major erosion due to the primary waves break at the rock exposures and only the secondary waves are surging type and rarely break at the shore, there is no on-shore and offshore transport movement takes place (Chandrasekar, 2002). Referring to table 1 the monthly erosion takes place on hot weather season. The sand change rate 5.9 to 6.3 m/month and southwest monsoon (5.8 –6.9m/month) and sand level was added during September and October month. The average beach sand level change is ranging from 6.92- 8.45m/year.
At station Sippikulam was located at the Vaippar riverbank. There are offshore island situated nearer to the coastline (Chandrasekar, 1996). These act as a barrier to the northerly littoral drift the beach has experienced erosion activity higher in all seasons. The changes appeared are mainly due to wave and waves generate currents at this station. During the 2nd half of NE monsoon the sand losses from 6.4m to 6.6m/month and hot weather season the sand level from 7.2 to 8.9m/month at the same time, during the post monsoon the erosion rate ranging from 7.8 to 8.4m/month.More over the beach profile sand change rate range is from 7.56m – 7.86m/year.
As observed from Table (2) the beach has experienced accretion during 3rd
At station Vembar, the coastal change is mainly falls under medium (-0.1to -1.0) too low (1.0-0) hazard category was observed. This coast is exposed into erosion and accretion activity and sediment transport on coast is very low, stable in all months. As compared to other station, at Pachayapuram the coastal erosion hazard category comes under Low (1.0-0) there is sediment transport is higher than other station. At station
Periasamypuram the coastal hazard is comes under medium category (-0.1—1.0) and also high hazard is observed during April, June and September months. The monthly hazard categories are shown in table.4.
half of NE monsoon, hot weather, SW monsoon and post monsoon season (except August).The predominantly the accretion activity is more than erosion activity, Due to supply of sediment to the beach by Kallar river. During the first half of NE monsoon the erosion activity is more, this season not enough sediment supply to the beach the sediments moves towards offshore.
4.2 Coastal Hazard Mapping
The categorization of Coastal hazards was guided by Cambers (2000c), Class hazard intervals for different categories were established as shown in Table.1.To study coastal hazards, Beach Profile survey was carried out from 2000 to 2001, 2002 .coastal hazard map is shown in Fig.3.4.5.The coastal risk maps prepared using GIS technology. The various risk zones are identified based on various parameters such as Beach width, beach sand change rate, and distance from water and vegetation cover. In additionally with available information the coastal hazard is categorizes into Very high, High, Medium, Low, Very Low. The coastal hazard ranking is based on beach sand change rate of different monthly beach sand change of year 2001 tabulated in table(4).As well as the different yearly change also tabulated in table(5).
4.2.1. Monthly coastal hazard on 2001
4.2.2. Coastal hazard on 2000- 2003
The coastal hazard is medium (-0.1 to -1.0) range in Vembar, Pachayapuram ,Periasamypuram and Kalluarani. Where Kalaignanapuram and Sippikulam have High hazard category ( -1.01 to 2) this may due to heavy erosion occurs in all months. During the year of 2001 the similar results are getting. During the year of 2002 the coast is not exposed erosion at Vembar,Pachayapuram station, hazard category ranging from (1.0 to 0).At station Kalaignanapuram and Sippikulam the coastal hazard category comes under High to very high. More over Kallurani have medium hazard..
V.
CONCLUSION
This research has attempted to delineate coastal erosion and its hazards at Kallar and Vembar coast. It describe the various ways in coastal erosion mapping as well as coastal risk assessment .The developed coastal hazard maps, we have to assess threats and impact of change in the coastal zone. The final hazard map would helpful for Coastal managers welcome any improvements gained from their integration with analysis and reporting tools extends the functionality of the GIS to create a spatial decision making environment to support the user through their decision making process.
REFERENCES
[1] Chandrasekar, N., Sudheer, A.S., Rajamanickam, G.V., 1996, ‘Studies on littoral sediment transport along the Southern Coast of Tamilnadu’ presented at IXth
[5] Chandrasekar, N., Anil Cherian., Rajamanickam, M. and Rajamanickam, G.V., 2000, Coastal landform Convention on Geological. Congress, University of Roorkee, 60-63.
[2] Chandramohan, P., 1998, Long shore Sediment transport model with particular reference to the Indian Coast.Indian.Journal of Marine Science, 20, 110-114. [3] Chandrasekar, N., Anil Cherian ., Rajamanickam. M. and Rajamanickam, G.V. , 2001, Influence of garnet sand mining on beach sediment dynamics between Periyathalai and Navaladi Coast, Tamilnadu , Journal of Indian Associan of Sedimentologists,21, 223-233.
684
Copyright © 2011-15. Vandana Publications. All Rights Reserved.
mapping between Tuticorin and Vaippar using IRS – IC Data,Indian Journal of Geomorphology, 5, 114-120. [6]
Chauhan,P.,Nayak,S.,Ramesh,R.,Krishnamoorthy,R.andRa machandran,S., 1996,Remote Sensing of suspended sediments along the Tamilnadu coastal waters, Journal of Indian Society of Remote Sensing,24, 105-114.
[7] Lafond, E.C. and Prasada Rao, R,1954, ‘ Beach erosion cycles near Waltair on the bay of Bengal ‘ A.U. Memoirs in Oceano , 63-77.
[8] Loveson, V.J.,1994, ‘Geological and geomorphological investigations related to sea level variation and heavy mineral accumulation along the southern Tamilnadu beaches’ unpublished PhD thesis, University of Madurai Kamaraj , October.
[9] Nayak,S.,2002, ‘ Application of Remote Sensing to coastal zone management in India’ presented at International Seminar on Resource and Environmental Management,34,.23-27.
[10] Prasannakumar, S.,1985 ‘Studies on sediment transport in the surf zone along certain beaches of Kerala’ unpublished PhD thesis, University of Cochin, October.
[11] Rajamanickam, G.V. and Gujar, A.R., 1984, Sediment depositional environment in some bays in central west coast of India, Indian Journal of Marine Science, 13, 53-59.
List of Tables
Table.1. showing the categorization of Coastal hazards interval for guided by Cambers (2000c)
Table.2.Monthly Erosion and accretion of different stations with respect to January during the year of 2001 - ((+) – Accretion; (-) – Erosion)
Station 2nd Hot weather season half of
NE monsoo)
SW monsoon
Post monsoon Season
1ST half of NE monsoon J F M A M J J A S O N D Vembar 0 - - + - + + - + - - + Pachayapuram 0 + + + - + + - - - - + Periasamypuram 0 - - - + - - - + + Kalaignanapuram 0 + - - - + - - + Sippikulam 0 - - - - Kallurani 0 + + + + + + - + + - - Total + Events 0 3 2 3 1 3 4 0 3 1 1 4
Beach Change Rates (Meters/Year)
Hazard Categories
-2.01+ Very high
-1.01 to –2 High
-0.01 to -1.0 Medium
685
Copyright © 2011-15. Vandana Publications. All Rights Reserved.
Table.3.Monthly sand level variation during November 2000 to 2002
Table.4. Monthly Beach Change rate (m /month) at different location of the study area (With respect to
January month 2001) (VH-Very High, H-High, M-Medium, L-Low, VL-Very Low)
Station Beach profile Nov 2000
Dec 2000
Feb 2001
Mar 2001
Apr 2001
May 2001
June 2001
July 2001
Augu 2001
Sep 2001
Oct 2001 Vembar Beach sand
change
Hazard category -0.18
M
0.41
L
-0.61
M
-0.85
M
1.36
VL
-1.23
H
1.12
VL 0.96
L
-0.17
M
0.13
L
-0.67
M Pachaya puram Beach sand
change
Hazard category -51
M
0.42
L
1.56
VL 1
L
1.12
L
-0.11
M
0.86
L
0.16
L
-0.29
L
-1.48
H
-1.46
H
Periasamy Puram
Beach sand change
Hazard category 0.47
L 0.6
L
-0.06
M
-0.19
M
-1.09
H
-0.76
M
-1.59
H
1.75
VL
-0.58
M
-1.75
H
-2.5
VH
Kalaignana puram
Beach sand change
686
Copyright © 2011-15. Vandana Publications. All Rights Reserved.
Table.5. Yearly Beach Change rate (m /year) at different location of the study area (With respect to year 2000)
List of Figures
Fig.1.Location Map of the study area Hazard category
M L M VH M VH VH H VH VH VH
Sippikulam Beach sand change
Hazard category -0.59
M
-2.08
VH
-2.05
VH -0.24
M
-0.17
M
-1.91
H
-2.03
VH -0.87
M
-1.34
H
-1.06
H
-0.75
M
Kallurani Beach sand change
Hazard category 1.92
VL 3.24
VL 1.38
L
-0.56
M
-0.82
M
-0.87
M
-0.35
M
-0.45
M
2.47
VH
-0.29
M
-0.17
M
Station &
GPS location
Erosion Rate 2000
Hazard Category (2000)
Erosion Rate 2001
Hazard Categor y (2001)
Erosion Rate 2002
Hazard Category (2002)
Vembar
09° 04’ 51” - 78° 22 ‘ 43
-0.295
”
Medium -1.16 High 0.788 Low
Pachayapuram
09° 03’ 82” 78° 20’ 96
-0.465
”” Medium -0.41 Medium 0.893 Low
Periasamypuram 09° 02’ 91” 78° 19’ 6
-0.535
”” Medium -1.07 Medium -1.141 High
Kalaignanapuram 09° 01’ 40” 78°18’ 01
-0.94
” High -1.805 High -2.264 Very High
Sippikulam
08°59’ 78” 78° 15’ 20
-1.335
” High -1.635 High -1.158 High
Kallurani
08°59’ 01” 78°14 ‘ 83
-0.295
687
Copyright © 2011-15. Vandana Publications. All Rights Reserved.
Figure .2. Beach Profile components
First profile segment A-B
d1 = distance along slope from A to B
h1 = horizontal distance from A to B
v1 = vertical drop for segment A-B
A1 = cross-sectional area for segment A-B
A1 = ½ (h1) (v1)
Second profile segment B-C
d2 = distance along slope from B to C
h2 = horizontal distance from B to C
v2 = vertical drop for segment B-C
A2 = cross-sectional area for segment B-C
A2 = h2[1/2 d2 + d1]
Total cross-sectional area (A) = A1+ A2+ ... + An
Total beach width (W) = h1+ h2+ ...+ hn
Where n= number of profile segments
688
Copyright © 2011-15. Vandana Publications. All Rights Reserved.
Fig.4.showing coastal hazard map during 2001