http: // www.ijrtsm.com© International Journal of Recent Technology Science & Management 24
ISSN : 2455-9679
[Rajeev, 4(11), Nov 2019] Impact Factor : 3.340
IJRTSM
INTERNATIONAL JOURNAL OF RECENT TECHNOLOGY SCIENCE & MANAGEMENT
“
SIMULATION OF MOUNTAIN BIKE FRAME USING FEM
”
Rajeev Gupta
1 Assistant Professor, Dept. of Mechanical Engineering, AITR, Indore, MP, India
ABSTRACT
Bikes keep on being the primary method of transport for the low and center salary families. This is on the grounds that the bike is both condition and individuals inviting. India is the biggest maker of bikes next just to China. It creates around 1.26 crore bikes each year. Considering the rising energizes cost and contamination, the bicycles are viewed as perfect. These can be kept up at low expenses. Since their commencement bikes have given society a wellspring of transportation, exercise, entertainment and game. New bike outlines are commonly persuaded by weight or potentially firmness contemplations and regularly fuse the utilization of superior designing materials. To be sure, aggressive bicycling has advanced the utilization of different progressed basic materials including non-ferrous amalgams (for example principally aluminum and titanium) and fortified polymers (for example carbon and graphite fortified epoxies). Both the edge structure and the material add to rider's vitality utilization. Vitality is exhausted for drive and versatile distortion of the casing. Along these lines a minimization of casing's all out mass and diversion are basic.
Most current bike outlines have basic structure for example jewel molded casing (Figure 2). It was in 1895 after a few remained essentially unaltered since that time. The requirement for low weight combined with high quality and solidness has prompted proceeding with trail and advancement of elite materials for dashing bikes The answer for the relating issue is to change to the most dependable and a demonstrated apparatus of basic building; the Finite Element Analysis Method (FEA).
Keyword:
Mountain bike frame, Finite element analysis, Frame building material tube geometry.
I.
INTRODUCTION
The demonstrating for the casing began with advancement of a few ideas for the exhibition of the edge. When an idea was chosen and sketch explicit structures that would use the idea settled on already. A precious stone casing was chosen to be structured as it was the most essential casing to be investigated. For that a jewel surrounded bike model from a standard bike size geometry diagram (Table 1) was chosen. From that a size for an individual with a tallness of 5 feet 10.75 inches an edge was developed. The chart variation of the frame size with height of the rider is as follows: Here,
C-t = This refers to the length of the seat tube, from the base to the top.
C-c =This is similar to the c-t measurement except the top of the seat tube is defined by the in the intersection of the center of the top tube and center of the seat tube.
http: // www.ijrtsm.com© International Journal of Recent Technology Science & Management 25
ISSN : 2455-9679
[Rajeev, 4(11), Nov 2019] Impact Factor : 3.340
Inseam (In.) Height Shoe size Frame size cm (c-t) Top tube cm (c-t)
36 6'4'' 11.5 62 59 35.5 6'2.5'' 11 61 58 34.75 6'1'' 10.5 60 57.5 34.25 6'0'' 10.5 59 57 33.75 5'10.75'' 10 58 56.5
33 5'9.5'' 9.5 57 56 32.5 5'8.75'' 9 56 55.5
32 5'8'' 9 55 55 31.25 5'7'' 8.5 54 54.5 30.75 5'6'' 8 53 54
30 5'5' 7.5 52 53 29.5 5'4.5'' 7 51 52 29 5'4'' 7 50 51 28.5 5'3'' 6 49 51
Figure 1: Tubing diagram of the bike frame
II.
REVIEW
OF
FRAME
BUILDING
MATERIAL
There are a wide variety of materials used in bicycle frames. Bike frames were originally made from wood, but modern frames are made primarily from aluminum, steel, titanium and carbon fiber. Some of the less common materials used in creating frames include bamboo, thermoplastics and magnesium. The materials used in analysis are namely:
1. Aluminum 6061-T6. 2. Aluminum 7005-T6.
The materials used for mountain bicycle frames have a wide range of mechanical properties. These properties can be seen in Table 2.
Table 2: Mechanical properties of common bicycle frame materials
Alloy Density
(g/cc) Modulus of Elasticity (GPa) Poisson’s Ratio Ultimate Tensile Strength (MPa) Tensile Yield Strength (MPa) Shear Modulus (GPa) Aluminum 6061-T6
2.7 68.9 0.33 310 276 26 Aluminum
7005-T6
2.78 71 0.32 370 317 27
Table 3: Properties of frame materials
Alloys Weldability and Machinability Cost per kg (US $)
http: // www.ijrtsm.com© International Journal of Recent Technology Science & Management 26
ISSN : 2455-9679
[Rajeev, 4(11), Nov 2019] Impact Factor : 3.340
Tube Geometry
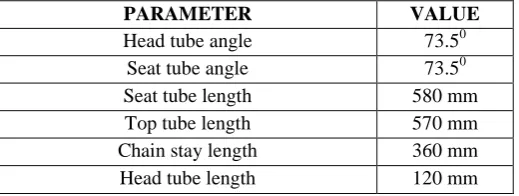
Frame geometry dimensions were taken from the standard mountain bike frame to characterize the overall tube layout geometry. The dimensions taken are standard dimensions used to characterize the geometry of the frame. These dimensions can be seen in Table 4.
Table 4: Geometry values for the solid model of the bicycle frame
PARAMETER VALUE
Head tube angle 73.50 Seat tube angle 73.50 Seat tube length 580 mm Top tube length 570 mm Chain stay length 360 mm Head tube length 120 mm
Theoretical analysis of bike frames
The modeled bicycle frame is made to apply with following load cases as a part of the investigation of the frame. The load cases are applied on all the 5 frames individually. The load cases are namely:
1) Static start up. 2) Steady state pedaling. 3) Vertical impact. 4) Horizontal impact. 5) Rear wheel braking.
Figure 2: Bike frame truss
Finite element analysis of Mountain bike frame using ANSYS
To verify the analytical result of stresses for bicycle frame it is compared with FEA analysis. The problem to be modeled is a simple bicycle frame shown in the following figure 9. The frame is to be built of 2 different alloys (Table1).
http: // www.ijrtsm.com© International Journal of Recent Technology Science & Management 27
ISSN : 2455-9679
[Rajeev, 4(11), Nov 2019] Impact Factor : 3.340
III.
RESULTS
AND
DISCUSSIONS
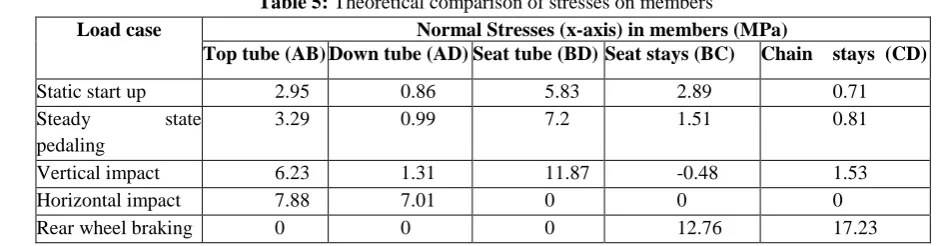
Theoretical stresses on members
As there are 2 different alloys, so we have to make 2 different tables in order to present the resultant stress in different loading cases for all alloys.
1. Aluminum 6061-T6
Table 5: Theoretical comparison of stresses on members
Load case Normal Stresses (x-axis) in members (MPa)
Top tube (AB) Down tube (AD) Seat tube (BD) Seat stays (BC) Chain stays (CD)
Static start up 2.95 0.86 5.83 2.89 0.71 Steady state
pedaling
3.29 0.99 7.2 1.51 0.81 Vertical impact 6.23 1.31 11.87 -0.48 1.53 Horizontal impact 7.88 7.01 0 0 0 Rear wheel braking 0 0 0 12.76 17.23
2. Aluminum 7005-T6
Table 6: Theoretical comparison of stresses on members
Load case Normal Stresses (x-axis) in members (MPa)
Top tube (AB) Down tube (AD)
Seat tube (BD)
Seat stays (BC)
Chain stays (CD)
Static start up 5.13 0.18 7.93 3.13 0.08 Steady state pedaling 6.43 0.53 9.01 4.53 2.56 Vertical impact 10.68 2.25 15.67 7.63 2.87 Horizontal impact 6.94 6.77 0 0 0 Rear wheel braking 0 0 0 12.13 16.71
Finite element analysis results by ANSYS
1.Aluminum 6061-T
Table 7: Comparison of stresses on members
Load case Normal Stresses (x-axis) in members (MPa)
Top tube (AB)
Down tube (AD)
Seat tube (BD)
Seat stays
(BC)
Chain stays
(CD)
Static start up 3.29 0.92 5.66 3.296 0.92
Steadystate pedaling 3.76 1.097 6.4 1.095 1.003
Vertical impact 6.6 1.86 11.32 -0.51 1.86
Horizontal impact 8.17 6.3 0 0 0
http: // www.ijrtsm.com© International Journal of Recent Technology Science & Management 28
ISSN : 2455-9679
[Rajeev, 4(11), Nov 2019] Impact Factor : 3.340
2.Aluminum 7005-T6
Table 8: Comparison of stresses on members
Load case Normal Stresses (x-axis) in members (MPa)
Top tube
(AB) Down tube (AD) Seat tube (BD) Seat stays (BC) Chain stays (CD)
Static start up 5.58 0.23 7.56 3.6 0.13 Steady state pedaling 6.57 0.56 8.77 4.37 3.9 Vertical impact 11.16 2.54 15.13 7.2 3.24 Horizontal impact 7.08 6.23 0 0 0 Rear wheel braking 0 0 0 12.64 16.87
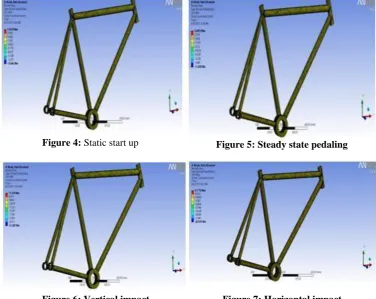
Figure 4: Static start up Figure 5: Steady state pedaling
Figure 6: Vertical impact Figure 7: Horizontal impact
http: // www.ijrtsm.com© International Journal of Recent Technology Science & Management 29
ISSN : 2455-9679
[Rajeev, 4(11), Nov 2019] Impact Factor : 3.340
IV.
COMPARISON
OF
STRESS
ON
MEMBERS
BY
THEORETICAL
AND
F.E.A.
Aluminum 6061-T
a) Static start up:
Table9: Comparison of stresses on members, Static start up
TOP TUBE
DOWN TUBE
SEAT TUBE
SEAT STAYS
CHAIN STAYS
STATIC START UP (ANALYTICAL) 2.95 0.85 5.83 2.89 0.712 STATIC START UP (FEA) 3.29 0.92 5.66 3.29 0.92 % DIFFERENCE 10.33 7.6 3 12.15 22.6
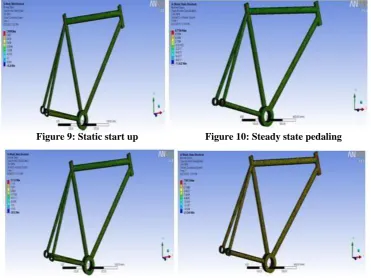
Figure 11: Vertical impact Figure 12: Horizontal impact
Figure 13: Rear wheel braking
http: // www.ijrtsm.com© International Journal of Recent Technology Science & Management 30
ISSN : 2455-9679
[Rajeev, 4(11), Nov 2019] Impact Factor : 3.340
b) Steady state pedaling:
Table 10: Comparison of stresses on members, Steady state pedaling
TOP TUBE DOWN TUBE SEAT TUBE SEAT STAYS CHAIN STAYS STEADY STATE PEDALING
(ANALYTICAL) 3.29 0.99 7.2 1.51 0.81 STEADY STATE PEDALING (FEA) 3.76 1.09 6.4 1.37 1 % DIFFERENCE 12.5 9.1 12.5 10.2 19
c) Vertical impact:
Table 11: Comparison of stresses on members, Vertical impact
TOP
TUBE DOWN TUBE TUBE SEAT STAYS SEAT CHAIN STAYS
VERTICAL IMPACT (ANALYTICAL) 6.23 1.31 11.87 -0.48 1.53 VERTICAL IMPACT (FEA) 6.6 1.86 11.32 -0.51 1.86 % DIFFERENCE 5.6 29.56 4.85 5.88 17.74
d) Horizontal Impact:
Table 12: Comparison of stresses on members, Horizontal impact
TOP
TUBE DOWN TUBE TUBE SEAT STAYS SEAT CHAIN STAYS
HORIZONTAL IMPACT
(ANALYTICAL) 7.88 7.01 0 0 0 HORIZONTAL IMPACT (FEA) 8.17 6.3 0 0 0 % DIFFERENCE 3.54 11.26 0 0 0
e) Rear wheel braking:
Table 13: Comparison of stresses on members, Rear wheel braking
TOP
TUBE DOWN TUBE TUBE SEAT STAYS SEAT CHAIN STAYS
REAR WHEEL BRAKING
(ANALYTICAL) 0 0 0 12.76 17.23 REAR WHEEL BRAKING (FEA) 0 0 0 13.11 17.5 % DIFFERENCE 0 0 0 2.66 1.54
Aluminum 7005-T
a)Static start up:
Table 14: Comparison of stresses on members, Static start up
TOP TUBE DOWN TUBE SEAT TUBE SEAT STAYS CHAIN STAYS
http: // www.ijrtsm.com© International Journal of Recent Technology Science & Management 31
ISSN : 2455-9679
[Rajeev, 4(11), Nov 2019] Impact Factor : 3.340
b)Steady state pedaling:
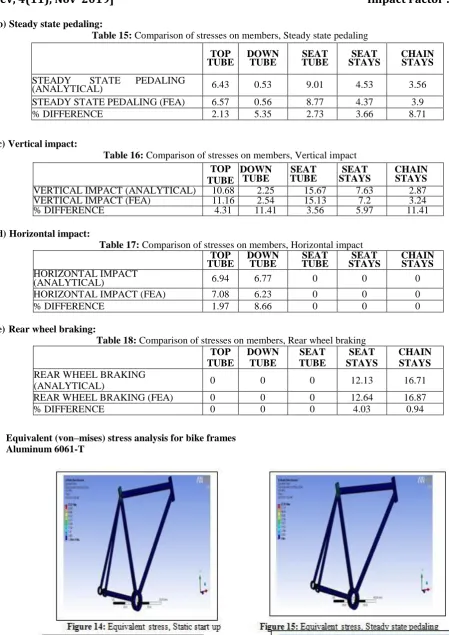
Table 15: Comparison of stresses on members, Steady state pedaling
TOP
TUBE DOWN TUBE TUBE SEAT STAYS SEAT CHAIN STAYS
STEADY STATE PEDALING
(ANALYTICAL) 6.43 0.53 9.01 4.53 3.56 STEADY STATE PEDALING (FEA) 6.57 0.56 8.77 4.37 3.9 % DIFFERENCE 2.13 5.35 2.73 3.66 8.71
c)Vertical impact:
Table 16: Comparison of stresses on members, Vertical impact
TOP TUBE
DOWN TUBE
SEAT TUBE
SEAT STAYS
CHAIN STAYS
VERTICAL IMPACT (ANALYTICAL) 10.68 2.25 15.67 7.63 2.87 VERTICAL IMPACT (FEA) 11.16 2.54 15.13 7.2 3.24 % DIFFERENCE 4.31 11.41 3.56 5.97 11.41
d)Horizontal impact:
Table 17: Comparison of stresses on members, Horizontal impact
TOP
TUBE DOWN TUBE TUBE SEAT STAYS SEAT CHAIN STAYS
HORIZONTAL IMPACT
(ANALYTICAL) 6.94 6.77 0 0 0 HORIZONTAL IMPACT (FEA) 7.08 6.23 0 0 0 % DIFFERENCE 1.97 8.66 0 0 0
e)Rear wheel braking:
Table 18: Comparison of stresses on members, Rear wheel braking
TOP TUBE
DOWN TUBE
SEAT TUBE
SEAT STAYS
CHAIN STAYS
REAR WHEEL BRAKING
(ANALYTICAL) 0 0 0 12.13 16.71 REAR WHEEL BRAKING (FEA) 0 0 0 12.64 16.87 % DIFFERENCE 0 0 0 4.03 0.94
http: // www.ijrtsm.com© International Journal of Recent Technology Science & Management 32
ISSN : 2455-9679
[Rajeev, 4(11), Nov 2019] Impact Factor : 3.340
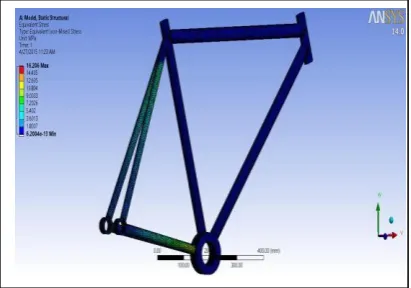
Figure 16: Equivalent stress, Vertical impact Figure 17: Equivalent stress, Horizontal impact
Figure 18: Equivalent stress, Rear wheel braking
Table 19: Comparison of equivalent stresses on members
Load case
Equivalent (von-Mises) Stress in members (MPa) Top tube
(AB)
Down tube (AD)
Seat tube (BD)
Seat stays (BC)
Chain stays (CD)
http: // www.ijrtsm.com© International Journal of Recent Technology Science & Management 33
ISSN : 2455-9679
[Rajeev, 4(11), Nov 2019] Impact Factor : 3.340
Figure 21: Equivalent stress, Vertical impact Figure 22:Equivalent stress, Horizontal impact
Figure 23: Equivalent stress, Rear wheel braking
Table 20: Comparison of equivalent stresses on members
Load case
Equivalent (von-Mises) Stress in members (MPa) Top tube
(AB)
Down tube (AD)
Seat tube (BD)
Seat stays (BC)
Chain stays (CD)
Static start up 10.34 0 11.64 9.05 0 Steady state pedaling 10.68 5.34 12.02 9.35 4.01 Vertical impact 20.69 12.93 23.28 18.1 2.58 Horizontal impact 32.42 28.81 0 0 0 Rear wheel braking 0 0 0 13.37 15.04
Comparison Of Maximum Stress Obtained For Different Cases
The maximum values of stresses obtained for the different loading cases for different alloys are compared in order to ascertain the properties of material alloy to take the impact of the loading (Table 20).
Table 21: Comparison of maximum stress (MPa) obtained for different cases
ALLOYS
Maximum stress obtained for different cases (Mpa)
Static start up
Steady state pedaling
Vertical impact
Horizontal impact
Rear wheel
braking
Aluminum 6061-T 23.25 23.75 46.5 28.96 16.2 Aluminum 7005-T 11.64 12.02 23.28 32.42 15.04
Comparison Of Maximum Deformation Obtained For Different Cases
http: // www.ijrtsm.com© International Journal of Recent Technology Science & Management 34
ISSN : 2455-9679
[Rajeev, 4(11), Nov 2019] Impact Factor : 3.340
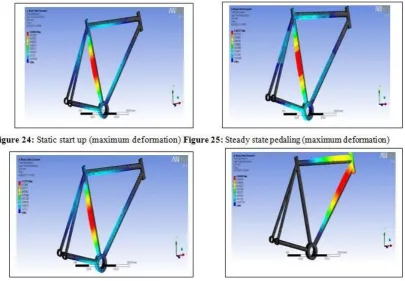
Figure 26: Vertical impact (maximum deformation) Figure 27: Horizontal impact (maximum deformation)
Figure 28: Rear wheel braking (maximum deformation), Aluminum 6061-T
Table 22: Comparison of maximum deformation (mm) obtained for different cases
ALLOYS
Maximum deformation obtained for different cases (mm)
Static start up
Steady state pedaling
Vertical impact
Horizontal impact
Rear wheel
braking
Aluminum 6061-T 0.023 0.024 0.047 0.049 0.56 Aluminum 7005-T 0.068 0.069 0.137 0.05 0.54
Aluminum 7005-T happens to be the most deformed alloy with a deformation of 0.068, 0.069, 0.137 and 0.05 mm for static start up, steady state pedaling, vertical impact and horizontal impact loading cases respectively.
http: // www.ijrtsm.com© International Journal of Recent Technology Science & Management 35
ISSN : 2455-9679
[Rajeev, 4(11), Nov 2019] Impact Factor : 3.340
Factor Of Safety
Factor of safety decides the structural capacity of a system beyond the expected loads or actual loads. Factor of safety is decided by the minimum value for any case of a particular alloy. The more the factor of safety the more is the chance of material alloy to bear the loading case.
Factor of Safety = Material Strength / Design Load
Table 23: Factor of safety for different loading cases
ALLOYS
Factor of safety obtained for different cases
Static start up
Steady state pedaling
Vertical impact
Horizontal impact
Rear wheel
braking
Aluminum 6061-T 11.87 11.62 5.93 9.52 15 Aluminum 7005-T 15 15 14.5 9.77 15
The least factor of safety of 5.93 is for Aluminum 6061-T frame on the vertical impact loading case. The highest factor of safety happens to be for Titanium-6Al-4V frame where for each case it is 15. Here for all alloys the factor of safety happens to be above 2 which is a safe case for any designed model. It means that all the alloys can withstand the applied loads without any failure. Besides from Table 77 the increasing order of safety factor for alloys can be as follows: Aluminum 6061-T < Aluminum 7005-T
IV.
V.
M
ODALA
NALYSISVibration analysis is made to be performed on all the 5 material alloy frames. No boundary condition is applied on the bike frames. Seat tube is supported so as to make the bike frames stable for the vibration test. When the simulation has finished the mode shapes are made visible
Aluminum 6061-T
http: // www.ijrtsm.com© International Journal of Recent Technology Science & Management 36
ISSN : 2455-9679
[Rajeev, 4(11), Nov 2019] Impact Factor : 3.340
Figure 33: Mode 5, 340.54 Hz Figure 34: Mode 6, 368.11 Hz
Figure 37: Mode 3, 301.71 Hz Figure 38: Mode 4, 324.53 Hz
Figure 39: Mode 5, 340.61 Hz Figure 40: Mode 6, 368.27 Hz
Table 24: Comparison of natural frequencies of the bike frames (Hz)
ALLOYS
NATURAL FREQUENCY OF THE BIKE FRAMES (Hz)
MODE 1 MODE 2 MODE 3 MODE 4 MODE 5 MODE 6
http: // www.ijrtsm.com© International Journal of Recent Technology Science & Management 37
ISSN : 2455-9679
[Rajeev, 4(11), Nov 2019] Impact Factor : 3.340
The modal analysis clearly suggests the dynamic behavior of the bike frames on free vibration conditions. The mode shapes quantify the vibration pattern of the material alloy. The 1st mode shape obtained defines the 1st vibration obtained for the bike frame on free vibration. From Table 78 we can deduce the mode shape obtained for different alloys. The increasing order of frequency is as follows:
Aluminum 6061-T < Aluminum 7005-T
The increasing order of deformation can be made out from the figure (124-154) which is as follows:
Aluminum 7005-T<Aluminum 6061-T
Frame Weight
Table 25: Comparison of frame weight (kg)
ALLOYS FRAME WEIGHT (Kg)
ALUMINUM 6061-T 2.28 ALUMINUM 7005-T 2.52
VI.
CONCLUSION
A mountain bike frame is designed with standard dimensions for a person with a height of 5 feet 10.75 inches. It has been designed for off road cycling. The dimensions of the frame are in accordance to the industry standards.
The design methodology was such chosen that the designer should have more control over outcome of Results. The inner and outer diameter of top tube, seat tube and down tube is 33 mm and 29 mm with a Thickness of 2mm. The inner and outer diameter of seat stays and chain stays are 23 mm and 21 mm with a thickness of 1mm. The lengths of the tubes are taken in accordance to the rider’s height. The lengths are close to industry standard. Modeling of the designed bike frame is done in NX Unigraphics 7.5 software. The bike frame is designed in 2 different material alloys so as to analyze and compare the frame material according to one’s need. For these 2 frames, 5 different load cases are defined in order to make out the stress and deformation in each frame. Normal stress analysis along x-axis is also performed in ANSYS software with the same loading cases. The stresses obtained from both the theoretical (analytical) and ANSYS are compared and a difference of 0% to 42.6% is seen in the results but the average difference is around 5% which can validate the ANSYS results as there is difference in meshing standard in both the analysis. Equivalent (von-Mises) stress analysis for all material alloys for all load cases is performed in ANSYS to make a comparative study. Results of all cases reveal that the maximum stress in the member of the bike frames is less than the yield strength in tension for the material selected. A comparative study is also made for the total deformation in the members of alloys for all load cases. Aluminum alloys are light weight but are easily deformed.
REFERENCES
1) Wu Chia-Chin, (2013), Static and dynamic analyses of mountain bikesand their riders.PhD thesis, University of Glasgow, UK, 2013.
2) Arola D, Reinhall PG, Jenkins MG, Iverson SC. 1999. An experimental analysis of a hybrid bicycle frame. Exp Tech. May/June: 21–24.
3) DerekCovill and Steven Begg, 2014, parametric finite element analysis of bicycle frames geometries, a School of Computing, Engineering and Mathematics, University of Brighton, Lewes Rd, Brighton, BN2 4GJ, UK.
4) J. Enright. Simulation of Mountain Bike Dynamics. Industrial Project Report, 5) Department of Mechanical Engineering, University of Glasgow, UK, 2007.
http: // www.ijrtsm.com© International Journal of Recent Technology Science & Management 38
ISSN : 2455-9679
[Rajeev, 4(11), Nov 2019] Impact Factor : 3.340
7) Forest Dwyer, (2012), Material and Design Optimization for an Aluminum Bike Frame, WORCESTER POLYTECHNIC INSTITUTE.
8) Joachim Vanwalleghem, Wim Van Paepegem, Mia Loccufier, Ives De Baere Damping and vibration behaviour of flax-carbon composite bicycle racing frames, Materials Science and Engineering Department, Ghent University (UGent),Gent, Belgium, Joachim.Vanwalleghem.
9) Lessard, L., Nemes, J., Lizotte, P. 1995. Utilization of FEA in the design of composite bicycle. Composites, 26(1), 72-74.
10) M. Levy and G.A. Smith. Effectiveness of Vibration Damping with Bicycle Suspension Systems. Sports Engineering, Vol., 8, No. 2, pp. 99-106, 2005.