Volume 1; Issue 1; Page No. 63-73
e
63
Bio computational analysis of protein sequence of sickle cell anemia
Vishwanath K V, Dr. Mahesh Pattabhiramaiah & Keerthi Ramesh
Centre for Applied Genetics, Department of Zoology, Jnanabharathi, Bangalore University,
Bangalore - 560056
Email:[email protected]
Abstract
Sickle cell anemia is a genetically inherited disease in which the people who suffer from this disease develop abnormally shaped red blood cells - an elongated shape like a sickle instead of the normal spherical shape of hemoglobin - which decrease its affinity to oxygen, there by causing dysfunctions of the normal body activity. Bio-computational analysis of sickle cell anemia protein reveals that the protein is hydrophobic in nature due to presence of high non-polar residue contents. The aliphatic index computed by Expasy‘s Prot-Param infers most of these proteins are stable and isoelectric values revealed that it is highly thermo stable at wide range of temperatures, ranging from 69.28 to 124.33. The secondary structure of the protein analyzed using SOPMA server revealed the presence of more alpha helix and coils. Multiple sequence alignment of sickle cell anemia revealed highly conserved regions. The RNA structure was predicted by using Gene-bee service software, a set of homologous sequences as the stems with their free energy. Protein homology prediction using (Swiss model) reveals probability and scoring for a particular template and confidence level and percentage of Identity and this can be used for the management of the disease.
Key Words: Sickle cell anemia, hemoglobin, SOPMA, ProtParam, Multiple sequence alignment, Gene bee service, Swiss model.
1. Introduction
Sickle cell disease (SCD) is a family of blood disorders including sickle beta thalassemia and sickle cell anemia (SS and SC types). Persons with SCD have a preponderance of red blood cells that become hardened, brittle, and sickle-shaped when they release oxygen. This hardening and sick ling of hemoglobin may result in vaso-occlusion, swelling, and pain episodes.
Sickle cell disease affects two millions of people worldwide, and more than three hundreds millions people have sickle cell trait worldwide. Person with trait leads a normal life but the diseased person suffers from various complications throughout the life such as anemia, bone & joint pain, joint swelling, recurrent infection, osteomyelitis, necrosis of bone, aplastic crises, abdominal pain, splenic sequestration crises, hepato-splenomegaly etc. [17].
Sickle cell anemia is caused by a single amino acid replacement in the β-chain of the human hemoglobin at the sixth position, with a glutamate residue replaced by a valine residue; Glutamate is negatively charged and hydrophilic and tends to stay on the surface of the protein in the aqueous environment in the blood. In contrast, valine is non-polar and hydrophobic residue and tends to shrink into the middle of the protein. The deformed protein molecules then forms bundles and distort the red blood cells that carries them resulting in the characteristic shape of a sickle. It is generally true that amino acids of different polarity rarely replace each other [21]. Whereas amino acids with similar polarity can replace each other quite frequently [22].
Sickle cell anemia may not be as well-known as, malaria or other diseases. However, it is one of the most prevalence genetic diseases in the world. This is true for many reasons but principally because it is the most common manifestation of and chief source of life disruption resulting from Sickle cell disease (SCD).
The current pace of high-throughput protein sequencing programs has provided researchers with a bewildering array of sequence and biological data to contend with. Identification of proteins of interest from a particular biological study requires the application of bioinformatics tools to process and priorities the data. Sequence analysis and physicochemical characterization of proteins using bio-computation tools have been done by many researchers and reported [2, 10, 13, & 11]. From a protein function standpoint, transfer of annotation from known proteins to a novel target is currently the only practical way to convert vast quantities of raw sequence data into meaningful information.
e
64
e
64
e64
e
64
e64
e
64
e64
e
64
e64
e
64
e
64
e
64
e
64
e64
e
64
e64
e
64
e64
e
64
e64
e
64
prediction of membrane-spanning regions and their orientation. The algorithm is based on the statistical analysis of TM base, a database of naturally occurring trans-membrane proteins.
The prediction is made using a combination of several weight-matrices for scoring
[7].MUSCLE stands
for Multiple Sequence Comparison by Log- Expectation. MUSCLE is claimed to achieve both better average accuracy and better speed than ClustalW2 or T-Coffee. The protein 3D model and its characteristics can be predicted by Swiss model server [18]. Reverse Translate accepts a protein sequence as input and uses a codon on usage table to generate a DNA sequence representing the most likely non-degenerate coding sequence. Further Computer-aided techniques for the efficient identification and optimization of novel molecules with a desired biological activity have become a part of the drug discovery process.The objective of this study was to perform bio-computational analysis of sickle cell anemia in order to characterize the sequence and to determine its physicochemical characteristics which might play a significant role in understanding the structure and function in progression and management of the disease.
2. Materials and Methods
Protein sequence retrieval: The Protein Sequences of sickle cell anemia (9 sequences) were retrieved in FASTA format from NCBI (Table 1).
Amino acid Composition: The amino acid composition of selected proteins were computed using the tool CLC workbench (www.clc.bio.com), tabulated in (Table 2).
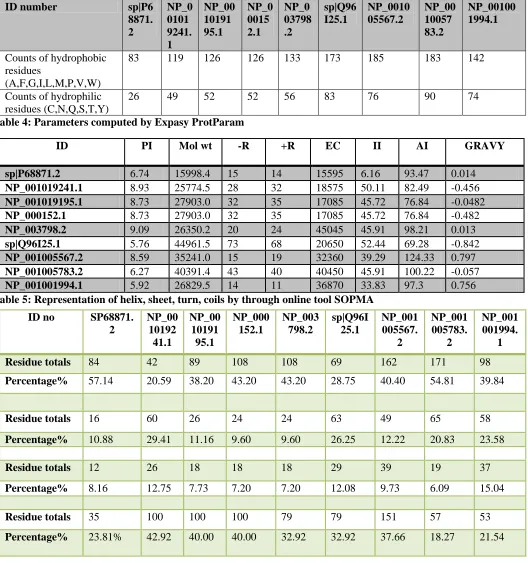
Primary structure analysis: Counts of hydrophobic and hydrophilic residues were calculated from the primary structure analysis by CLC workbench (Table 3).
Physio-chemical parameters: The physicochemical parameters such as theoretical isoelectric point (Ip), molecular weight, total number of positive and negative residues, extinction coefficient, instability index [5] aliphatic index [4] and grand average hydropathy (GRAVY) [8] were computed using the Expasy’s ProtParam server [12], and tabulated in (Table 4).
Secondary structure prediction: The secondary structure was predicted by self-optimized prediction method with alignment by SOPMA server [2] (Table 5).
SVM prot analysis: The protein function prediction and classification of proteins were analyzed using SVM Prot (http://jing.cz3.nus.edu.sg/cgi-bin/svmprot.cgi.) (Table 6).
Trans-membrane region prediction: Trans-membrane helices were predicted by the TMpred software (http://www.ch.embnet.org/software/TMPRED_form.html) (Fig 1).
Sequence Homology Analysis: The sequence homology was analyzed by MUSCLE
(http://www.ebi.ac.uk/Tools/msa/muscle/) (Fig 2).
RNA structure prediction: The protein sequences were reverse transcribed to DNA using Sequence manipulation suite (SMS) (http://www.bioinformatics.org/sms2/rev_trans.html). The reverse transcribed DNA was converted to RNA using transcriptional and translational tool (http://www.attotron.com/cybertory/analysis/trans.html). RNA structure was predicted using (http://www.genebee.msu.su/services/rna2_reduced.html) (Fig 3). The free energy of stems was predicted (Table 7).
Swiss model: Homology-modeling was performed using SWISS-MODEL accessible via the ExPASy web server. (http://swissmodel.expasy.org/) (Fig 4).
e
65
e
65
e65
e
65
e65
e
65
e65
e
65
e65
e
65
e
65
e
65
e
65
e65
e
65
e65
e
65
e65
e
65
e65
e
65
Table 2: Representation of amino acids frequencies in Sickle cell anemia
e
66
e
66
e66
e
66
e66
e
66
e66
e
66
e66
e
66
e
66
e
66
e
66
e66
e
66
e66
e
66
e66
e
66
e66
e
66
Table 4: Parameters computed by Expasy ProtParam
ID PI Mol wt -R +R EC II AI GRAVY
sp|P68871.2 6.74 15998.4 15 14 15595 6.16 93.47 0.014
NP_001019241.1 8.93 25774.5 28 32 18575 50.11 82.49 -0.456 NP_001019195.1 8.73 27903.0 32 35 17085 45.72 76.84 -0.0482 NP_000152.1 8.73 27903.0 32 35 17085 45.72 76.84 -0.482 NP_003798.2 9.09 26350.2 20 24 45045 45.91 98.21 0.013 sp|Q96I25.1 5.76 44961.5 73 68 20650 52.44 69.28 -0.842 NP_001005567.2 8.59 35241.0 15 19 32360 39.29 124.33 0.797 NP_001005783.2 6.27 40391.4 43 40 40450 45.91 100.22 -0.057 NP_001001994.1 5.92 26829.5 14 11 36870 33.83 97.3 0.756 Table 5: Representation of helix, sheet, turn, coils by through online tool SOPMA
ID number sp|P6
8871. 2
NP_0 0101 9241. 1
NP_00 10191 95.1
NP_0 0015 2.1
NP_0 03798 .2
sp|Q96 I25.1
NP_0010 05567.2
NP_00 10057 83.2
NP_00100 1994.1
Counts of hydrophobic residues
(A,F,G,I,L,M,P,V,W)
83 119 126 126 133 173 185 183 142
Counts of hydrophilic residues (C,N,Q,S,T,Y)
26 49 52 52 56 83 76 90 74
ID no SP68871. 2
NP_00 10192
41.1
NP_00 10191
95.1
NP_000 152.1
NP_003 798.2
sp|Q96I 25.1
NP_001 005567.
2
NP_001 005783.
2
NP_001 001994.
1
Residue totals 84 42 89 108 108 69 162 171 98
Percentage% 57.14 20.59 38.20 43.20 43.20 28.75 40.40 54.81 39.84
Residue totals 16 60 26 24 24 63 49 65 58
Percentage% 10.88 29.41 11.16 9.60 9.60 26.25 12.22 20.83 23.58
Residue totals 12 26 18 18 18 29 39 19 37
Percentage% 8.16 12.75 7.73 7.20 7.20 12.08 9.73 6.09 15.04
Residue totals 35 100 100 100 79 79 151 57 53
e
67
e
67
e67
e
67
e67
e
67
e67
e
67
e67
e
67
e67
e67
e67
e67
e
67
e67
e
67
e67
e
67
e67
e
67
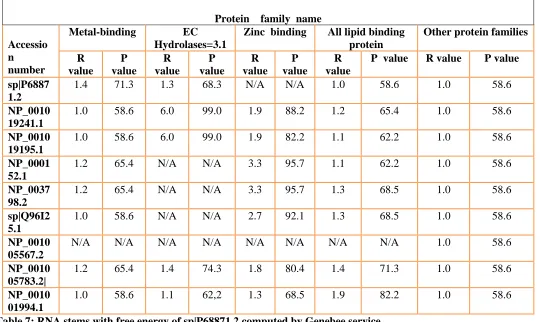
Table 6: SVM prot analysis
Table 7: RNA stems with free energy of sp|P68871.2 computed by Genebee service
Stem no 1 2 3 4 5 6 7 8 9 10 11 12 13 14 15 16 17 18
Free energy(K kal/mol) -23. 400 000 -16. 500 000 -13 .8 00 00 0 -11 .6 00 00 0 -10 .7 00 00 0 -9. 90 00 00 -9.8 00 00 0 -9. 60 00 00 -8. 80 00 00 -8.8 00 00 0 -8. 20 00 00 -8. 10 00 00 -7. 80 00 00 -7.30 000 0 -6. 80 00 00 -6. 50 00 00 -6.30 000 0 -6.100000
(Fig 1)TMpred graph (sp P68871.2).
(Fig2): Multiple sequence alignment MUSCLE (sp P68871.2)
Protein family name
Accessio n number
Metal-binding EC Hydrolases=3.1
Zinc binding All lipid binding protein
Other protein families
R value P value R value P value R value P value R value
P value R value P value
sp|P6887 1.2
1.4 71.3 1.3 68.3 N/A N/A 1.0 58.6 1.0 58.6
NP_0010 19241.1
1.0 58.6 6.0 99.0 1.9 88.2 1.2 65.4 1.0 58.6
NP_0010 19195.1
1.0 58.6 6.0 99.0 1.9 82.2 1.1 62.2 1.0 58.6
NP_0001 52.1
1.2 65.4 N/A N/A 3.3 95.7 1.1 62.2 1.0 58.6
NP_0037 98.2
1.2 65.4 N/A N/A 3.3 95.7 1.3 68.5 1.0 58.6
sp|Q96I2 5.1
1.0 58.6 N/A N/A 2.7 92.1 1.3 68.5 1.0 58.6
NP_0010 05567.2
N/A N/A N/A N/A N/A N/A N/A N/A 1.0 58.6
NP_0010 05783.2|
1.2 65.4 1.4 74.3 1.8 80.4 1.4 71.3 1.0 58.6
NP_0010 01994.1
e
68
e
68
e68
e
68
e68
e
68
e68
e
68
e68
e
68
e
68
e
68
e
68
e68
e
68
e68
e
68
e68
e
68
e68
e
68
Conserved sequences for hierarchical clustering, primary constructions, identity percentage strong and weakly similar sequences is predicted.
Identity (*): Strongly similar (:): Weakly similar (.)
(Fig 3) RNA structure predicted by Genebee service (sp|P68871.2)
e
69
e
69
e69
e
69
e69
e
69
e69
e
69
e69
e
69
e
69
e
69
e
69
e69
e
69
e69
e
69
e69
e
69
e69
e
69
Model 1 Model 2 Model 3
(Fig 5): Model building using SWISS model of sp|P68871.2
e
70
e
70
e70
e
70
e70
e
70
e70
e
70
e70
e
70
e
70
e
70
e
70
e70
e
70
e70
e
70
e70
e
70
e70
e
70
3. Amino acid composition
The results of Primary sequence analysis of sickle cell anemia proteins analyzed by CLC work bench revealed the sequence length of amino acids ranged from 146-401 aa tabulated in (Table 1). Most abundant amino acids were Alanine (A), (0.102) (spP68871.2), Glycine (G), (0.121) (NP_003798.2), Leucine (L) (0.146), (NP_003798.2) and valine. The least amino acid was found to be Proline (P) 0.02 (NP_001001994.1), Histidine (H) 0.01 (sp|Q96I25.1), Cysteine (C) 0.01 in a protein, (Table 2) which promotes the phenomenon of sickle cell anemia by inactivating components of the Heminology, one of the major causes for promoting sickle cell anemia activity.
4. Primary sequence analysis
The result of primary structure analysis suggests that most of the sickle cell anemia is hydrophobic in nature due to presence of high non-polar residues content (Table 3). The hydrophobic residues are alanine, phenylalanine, glycine, isoleucine, leucine, methionine, proline, valine and tryptophan. The hydrophilic residues are Cysteine, asparagines, glutamine, serine, threonine and tyrosine. The highest hydrophobic count of 183 (NP_001005783.2) and the least hydrophobic count of 83 (sp|P68871.2) was recorded. The highest hydrophilic count of 90 (NP_001005783.2) and the least hydrophilic count of 26 (sp|P68871.2).
5. Physico-chemical properties
Amino acid sequence was used here to predict the physicochemical properties of using ProtParam (Table 4). By using physicochemical properties, we can predict the stability of protein structure. Instability index value should be below 40 is structure is stable, above 40 leads to structural instability.
Results showed that sickle cell anemia has molecular weight of 44961.5 Daltons (sp|Q96I25.1) with its sequence length 401 and least was found to be 15998.4 Daltons (sp|P68871.2) with its sequence length 147.
Extinction co-efficient of sickle cell anemia at 280nm is ranging from 15595 to 45045 this infers that the protein can absorb the Light at 280nm. The extinction co-efficient can be used to calculate the concentration of a protein in solution. Isoelectric point is the pH at which the surface of protein is covered with charge but net charge of protein is zero. pI of sickle cell anemia found to be basic in nature. Isoelectric point predicted ranged from 8.32 – 9.23 (Table 4) which are soluble in basic buffers. Useful for developing buffer system for purification of proteins.
The Aliphatic index of a protein is defined as the relative volume occupied by aliphatic side chains: alanine, valine, isoleucine, and Leucine, are ranging from 69.28 to 124.33, which infers positive factor for thermo stability.
The Grand Average hydropathy (GRAVY values) showed that all proteins are hydrophobic ranging from 0.0482 to -0.842 supports the insoluble nature of Sickle cell anemia proteins. It can play a role in substrate recognition. Here the protein sequences showing negative that indicates stability of the protein. In particular, hydrophobic amino acids can be involved in binding/recognition of ligands.
6. Secondary structure prediction
Computational methods were used to predict secondary structure of protein using SOPMA program. For SOPMA analysis, primary sequence of protein was submitted to program. The above said program provided detailed information on structures of Helices, coils and strands of sickle cell anemia. The secondary structure prediction of protein are analyzed by SOPMA are predicted 57.14% are good secondary structure.
The secondary structure of helix, extended from 84 to 171 residues and the helix range was (20.59% -57.14%), sheet extended from 16 to 65 residues the range (9.60%-29.41%) and turn 12 to 39 residues its range (6.09%-15.04%). The secondary analysis showed that Sickle cell anemia contain more random coils and helix range: (18.27% -42.92%) (Table 5) than Beta sheets and turn.
Being hydrophobic, Leucine prefers to be buried in protein hydrophobic cores. It also shows a preference for being within alpha helices more so than in beta strands. Sickle cell anemia Secondary structure are listed in (Table 4) which shows more structure is alpha helix follows random coil share grater percent of structure in the protein than extended strand and beta turns. The very high coil structural content of Sickle cell anemia is due to the rich content of more flexible Alanine and hydrophobic Glycine amino acids. Proline has a special property of creating links in polypeptide chains and disrupting ordered secondary structure.
The consequence in which most of the amino acid side chains of transmembrane segments is non-polar (e.g. Ala, Val, Leu, Ile, Phe) and the very polar CO-NH groups (peptide bonds) of the polypeptide backbone of trans membrane segments which participates in hydrogen bonding (H-bonds) in order to lower the cost of transferring them into the hydrocarbon interior. This bonding is most easily accomplished with alpha-helices for which all peptide bonds are H-bonded internally.
7. Support vector machines (SVM) method
e
71
e
71
e71
e
71
e71
e
71
e71
e
71
e71
e
71
e
71
e
71
e
71
e71
e
71
e71
e
71
e71
e
71
e71
e
71
which may involve proteins with diverse sequence distribution. It has been employed in protein studies including protein– protein interaction prediction, fold recognition, solvent accessibility and structure prediction. The prediction accuracy ranges from 1.1 to 99% in this study. Thus SVM classification of protein functional family, a potentially developed into a protein function prediction tool to complement methods based on sequence similarity and clustering. SVMProt shows a certain degree of capability for the classification of distantly related proteins and homologous proteins of different function and thus may be used as a protein function prediction tool that complements sequence alignment methods. Based on the classification of proteins of our interest and its values, we predict that, these proteins may help in designing drugs for sickle cell anemia (Table 6).
8. Transmembrane prediction
The prediction of transmembrane helices in integral membrane proteins is an important aspect of bioinformatics. The most successful methods to date not only predict individual transmembrane helices, but rather attempt to predict the full topology of the protein, i.e. the total number of transmembrane helices and there in/out orientation relative to the membrane [19]. Reliable methods for discrimination between membrane proteins and soluble proteins and for topology prediction have important applications in genome analysis, and can be used to extract global trends in membrane protein evolution [20].TM base is a database of transmembrane proteins and their helical membrane- spanning domains. Possible transmembrane helices, of the accession number sp|P68871.2, the sequence positions inside to outside 4 helices is found and outside to inside 4 helices is found. Transmembrane topology suggestions are purely speculative and should be used with extreme caution since they are based on the assumption that all transmembrane helices have been found. In most cases, the prediction plot (Fig 1) that is created should be used for the topology assignment of unknown proteins.
Inside->outside | outside->inside
20- 40 (21) 2235 ++ | 20- 40 (21) 1876 58- 78 (21) 1855 | 59- 81 (23) 2263 ++
92- 114 (23) 2563 | 92- 112 (21) 2578 222- 245 (24) 2182 + | 222- 245 (24) 2035
The sequence positions in brackets dominate the core region. Only scores above 500 are considered significant. So we can predict that the Transmembrane is significant from the above results.
9. Sequence homology Analysis
The Multiple sequence alignment of Sickle cell anemia sequences revealed significant conserved (leucine) and semi conserved regions (proline, alanine) are represented as Identity (*): Strongly similar (:): Weakly similar (.) as shown in (Fig 2).
10.RNA Structure Prediction
RNA is now appreciated to serve numerous cellular roles, and understanding RNA structure is important for understanding a mechanism of action. This contribution discusses the methods available for predicting RNA structure (Fig 3). Secondary structure is the set of the canonical base pairs, and secondary structure can be accurately determined by comparative sequence analysis. Secondary structure can also be predicted. The most commonly used method is free energy minimization. The free energy of 18 stems is tabulated in (Table 7). The accuracy of structure prediction is improved either by using experimental mapping data or by predicting a structure conserved in a set of homologous sequences. Additionally, tertiary structure, the three-dimensional arrangement of atoms, can be modeled with guidance from comparative analysis and experimental techniques. New approaches are also available for predicting tertiary structure.
11.SWISS Model
The three models are shown in the (Fig 4). Template selection, alignment and model building are done completely automated by the server of the ID number SP68871.2. Predicting the protein 3D structures by this method are used which implements the four steps of the homology modeling approach.
a.
Template searching to identify the structure homology: Template search with Blast and HHBlits has been performed against the SWISS-MODEL template library. The target sequence was searched with BLAST [1] against the primary amino acid sequence contained in the SMTL. A total of 248 templates were found. An initial HHBlits profile has been built using the procedure outlined in [14], followed by 1 iteration of HHBlits against NR20. The obtained profile has then been searched against all profiles of the SMTL. A total of 482 templates were found.e
72
e
72
e72
e
72
e72
e
72
e72
e
72
e72
e
72
e
72
e
72
e
72
e72
e
72
e72
e
72
e72
e
72
e72
e
72
c.
Model Building: Models are built based on the target-template alignment using Promod-II. Coordinates which are conserved between the target and the template are copied from the template to the model. Insertions and deletions are remodeled using a fragment library. Side chains are then rebuilt. Finally, the geometry of the resulting model is regularized by using a force field. In case loop modeling with Promod-II [6] does not give satisfactory results, an alternative model is built with MODELLER [15].d.
Model Quality Estimation: The global and per-residue model quality has been assessed using the QMEAN scoring function [3]. For improved performance, weights of the individual QMEAN terms have been trained specifically for SWISS-MODEL (Fig 5).12.Ligand Modeling
Ligands present in the template structure are transferred by homology to the model when the following criteria are met: (a) The ligands are annotated as biologically relevant in the template library,
(b) The ligand is in contact with the model, (c) The ligand is not clashing with the protein,
(d) The residues in contact with the ligand are conserved between the target and the template (Fig 6).
If any of these four criteria is not satisfied, a certain ligand will not be included in the model. The model summary includes information on why and which ligand has not been included.
13. Acknowledgment
The special thank goes to Dr. M.S.Reddy Co-ordinator Centre for Applied Genetics Bangalore University, for their great appreciation and for their kind support and encouragement during the research work.
14. Conclusion
Sickle cell disease is a group of inherited hemoglobin disorders characterized by chronic hemolytic anemia, a heightened susceptibility to end-organ damage and intermittent infections, episodes of vascular occlusion causing both acute and chronic pain. With the global scope of sickle-cell disease, knowledge of the countless clinical presentations and treatment of this disorder need to be familiar to hematologists, internists, and pediatricians alike. Additionally, an underlying grasp of sickle-cell anemia, which has rapidly accrued new knowledge in areas related to extra-erythrocyte and erythrocyte events, is crucial to an understanding of the complexity of these protean manifestations with molecular disease.
Bio informatics tools were used to unravel the structural and functional aspect of the sickle cell protein. The results annotated are helpful in the management of disease and further studies. The biocomputational analysis of sickle cell protein was carried out using various bio informatics tools, based on such methods indicated that they can prove to be very useful for novel drug targets for the relevant protein structure and also these models built in this work would be applicable for predicting the ongoing pharmacogenetics studies. This study can be used in broad screening on inhibitors of the protein and can be effectively used to raise monoclonal antibodies against its antigenic determinants sites that can be used to support the drug design project and can be further implemented in future studies. The functional analysis in this study may perhaps exhibit a good model for further research activities in genetically inherited disease and drug designing. Understanding of disease as the result of a continuing interaction between basic scientists and clinical researchers is best exemplified by this entity.
15. References
[1]. Altschul S.F, Madden T.L, Schaffer A.A, Zhang J, Zhang Z, Miller W. and Lipman D.J. “Gapped BLAST and PSI-BLAST: a new generation of protein database search programs”. Nucleic Acids Res, 25, 3389-3402, 1997.
[2]. Ashokan K.V, Mundaganur D.S, and Mundaganur, Y.D. “Catalase: Phylogenetic characterization to explore protein cluster”. Journal of research in Bioinformatics. 1:001-008, 2011.
[3]. Benkert P, Biasini M. and Schwede, T. “Toward the estimation of the absolute quality of individual protein structure models”. Bioinformatics, 27, 343-350, 2011.
[4]. Eisenhaber F, Imperiale F, Argos P and Froemmel C. “Prediction of secondary structural content of proteins from their amino acid composition alone. I. New analytic vector decomposition methods”. Proteins: Struct. Funct. Design.25:157-168, 1996.
[5]. Gill S.C. and Von Hippel P.H. “Calculation of protein extinction coefficients from amino acid sequence data”. Anal. Biochem.182: 319-326, 1989.
[6]. Guex N and Peitsch M.C. “SWISS-MODEL and the Swiss-PdbViewer: an environment for comparative protein modeling”. Electrophoresis, 18, 2714-2723, 1997.
e
73
e
73
e73
e
73
e73
e
73
e73
e
73
e73
e
73
e
73
e
73
e
73
e73
e
73
e73
e
73
e73
e
73
e73
e
73
[8]. Kitchen D.B, Decornez H, Furr J.R, and Bajorath J. “Docking and scoring in virtual screening for drug discovery: methods and applications”. Nature reviews Drug discovery. 3(11):935-949, 2007
[9]. Letunic.I, Doerks.T and Bork.P "SMART 6: recent updates and new developments". Nucleic Acids Res. 37: 229/32, 2009.
[10]. Madhu S and Mahesh P. “Sequence analysis of Semaphorin in tumor progression: An Insilico approach”. International Journal of Asian Academic Research of Multidisciplinary .1(29): 407-423, 2015.
[11]. Mahesh P, Divya P, Akshatha M, Prathima R and Lava Kumar C. “Insilico characterization and phylogenetic analysis of novel probiotic bacteria in honey bees”. International Journal of Asian Academic Research of Multidisciplinary .1(32): 337-357, 2015.
[12]. Mugilan A, Ajitha M. C, Devi and Thinagar. “In silico Secondary Structure Prediction Method (Kalasalingam University Structure Prediction Method) using Comparative Analysis”. Trends in Bioinformatics. 3(1):11-19, 2010
[13]. Praveen Kumar K.S and Mahesh Pattabhiramaiah “Sequence analysis of basic phospholipase A2 (neurotoxin) as a potential drug target: an in silico approach”. International Journal of Engineering Research and General Science Volume 3, Issue. 1057-1067, 2015.
[14]. Remmert M, Biegert A, Hauser A. and Soding J. “HHBlits: lightning-fast iterative protein sequence searching by HMM-HMM alignment”. Nat Methods, 9, 173-175, 2012.
[15]. Sali A and Blundell T.L. “Comparative protein modeling by satisfaction of spatial restraints”. J Mol Biol, 234, 779-815, 1993.
[16]. Schultz J, Milpetz F, Bork P and Ponting CP. “SMART, a simple modular architecture research tool: identification of signaling domains”. Proc. Natl. Acad. Sci. U.S.A. 95 (11): 5857/64, 1998.
[17]. Serjeant GR. “Sickle Cell Disease”. 3rd ed. Oxford: Oxford University Press;. The blood; pp. 113–5, 2001
[18]. Tsetlin V.I and Hucho F. Snake and snail toxins acting on nicotinic acetylcholine receptors. Fundamental aspects and sciences, Bioinformatics. 4: 53-62, 2004
[19]. Von Heijne, G. Protein Seq. Data Anal. 1, 41-42, 1987
[20]. Wallin E and Von Heijne “Genome-wide analysis of integral membrane proteins from eubacterial, archaean, and eukaryotic organisms”, Protein Sci 7(4), 1029-1038, 1998.
[21]. Xia and Li “Bioinformatics and the Cell: Modern Computational Approaches in Genomics” J Springer, pp 33 to
40,1998.
[22]. Xia and Kumar “Bioinformatics and the Cell: Modern Computational Approaches in Genomics” J Springer, pp 33 to 40,2006