Medical Journal of the Islamic Republic of Iran (MJIRI)
Med J Islam Repub Iran. 2019(17 Dec);33.139. https://doi.org/10.34171/mjiri.33.139
______________________________
Corresponding author: Dr Zahra Shayan, [email protected]
1.Department of Biostatistics and Epidemiology, Faculty of Medicine, Arak University
of Medical Sciences, Arak, Iran
2.Department of Biostatistics, Student Research Committee, School of Public Health,
Hamadan University of Medical Sciences, Hamadan, Iran
3.Trauma Research Center, Rajaee (Emtiaz) Trauma Hospital, Department of
Biostatistics, School of Medicine, Shiraz University of Medical Sciences, Shiraz, Iran
4.Department of Immunology and Microbiology, Faculty of Medicine, Arak University
of Medical Sciences, Arak, Iran
↑What is “already known” in this topic:
White blood cell (WBC) counts are commonly used for the diagnosis of acute appendicitis in the early stages of pain. However, the effect of certain confounders, particularly age and sex, has been less focused.
→What this article adds:
Based on the ROC regression analysis for the WBC test, age-sex adjusted variables increased the diagnostic accuracy of the WBC test for predicting acute appendicitis.
The accuracy of white blood cell count in the diagnosis of
acute appendicitis using age-sex-adjusted receiver
operating characteristic approach
Mohammad Rafiei1, Naser Mohammad Gholi Mezerji2,Zahra Shayan*3,Ghasem Mosayebi4
Received: 14 Mar 2018 Published: 17 Dec 2019
Abstract
Background: White blood cell (WBC) counts are commonly used for the diagnosis of acute appendicitis in the early stages of pain. However, the effect of certain confounders, particularly age and sex, has been less focused. The purpose of this study was to investigate the diagnostic accuracy of white blood cells in the prediction of acute appendicitis using age-sex-adjusted receiver operating characteristic (ROC) curve.
Methods: In this cross sectional study, 131 patients who had undergone appendectomy were studied during 2010-2011. Patients were placed in the normal appendix and acute appendicitis groups. ROC regression was used to identify the effects of the variables of age and sex on the diagnostic accuracy of WBCs using the area under the ROC curve (AUC). Statistical analysis was conducted in Stata 12 software.
Results: In ROC regression method, the AUC for the variable of WBC was 0.643 (95% CI: 0.555-0.725) without adjustment for age and sex variables, 0.672 (0.584-0.751) with an age-adjusted variable, 0.698 (0.612-0.775) with a sex-adjusted variable, and 0.710 (0.624-0.786) with both age-sex adjusted variables.
Conclusion: Results indicated that age-sex adjusted variables increased the diagnostic accuracy of the WBC test for predicting acute appendicitis using ROC regression method for the WBC test.
Keywords: White blood cell counts, Acute appendicitis, Area under the ROC Curve, ROC regression
Conflicts of Interest: None declared
Funding:Arak University of Medical Sciences, Arak, Iran (grant number: 1210)
*This work has been published underCC BY-NC-SA 1.0 license.
Copyright© Iran University of Medical Sciences
Cite this article as:Rafeie M, Mohammad Gholi Mezerji N, Shayan Z, Mosayebi Gh. The accuracy of white blood cell count in the diagnosis of acute appendicitis using age-sex-adjusted receiver operating characteristic approach. Med J Islam Repub Iran. 2019 (17 Dec);33:139. https://doi.org/10.34171/mjiri.33.139
Introduction
Acute appendicitis is the most common cause of ab-dominal pain leading to surgery. In fact, appendectomy is the most common emergency surgery in the world (1-2). About 7% of people suffer from acute appendicitis during their lifetime (3). The decision for appendectomy is usual-ly made for cases of acute abdominal pain that manage to simultaneously exclude other causes of abdominal pain too. Appendicitis is diagnosed based on the symptoms expressed by the patient, clinical signs, and serum tests
(4). None of these symptoms and tests are specific to acute appendicitis and do not have a high specificity value.
Even in modern medical facilities, these issues have led to the initial diagnosis of appendicitis to be rejected in 16% to 18% of the cases after a postoperative pathology (5). Most predictions of the diagnosis of appendicitis are not acceptable on the sole basis of clinical signs and sim-ple laboratory tests. Various techniques and indicators have been proposed, including white blood cell counts.
Accuracy of white blood cell in the diagnosis of acute appendicitis using adjusted ROC
Recent studies show that many variables can affect the results of diagnostic tests. These variables include the different conditions of the diagnostic test or the individu-als’ demographic variables or the severity of the disease and are called confounding variables in statistics (6-8).
The ROC curve is a very useful diagnostic tool which examines the association between the sensitivity and spec-ificity of a test (9). Estimations with the ROC curve can be used to evaluate the effects of predictive variables on the accuracy of statistical models (10). In quantitative tests, eg, WBC count, analyzing ROC curves can specify an optimal cutoff point and determine the accuracy of the tests both separately and in combination (11). The accura-cy of diagnostic tests is determined based on the area un-der the curve (AUC). AUC values range between zero and 1 and those closer to 1 indicate higher accuracy (12, 13). AUC is often used to represent how likely it is that the test will classify patients into 2 classes: one with an illness and one without in the correct order across various thresholds (6-8). More intuitively, AUC is the chance that a random-ly selected patient with a lesion will be ranked above a randomly selected normal patient (14). A perfect test would have 100% sensitivity with zero false positives (100% specificity), across all thresholds. This point lies at the extreme top left-hand corner of the ROC plot; AUC = 1.0.
Statistical models for assessing the effect of confound-ers on ROC curve were first presented by Tosteson & Begg in 1988. Further studies were conducted on the models in 1995 by Toledano & Gatsonis (14). In 1988, Pepe began working on these methods and expanded them.
In a study conducted in 2009, Janes and Pepe introduced a number of confounding variables that can affect the ac-curacy of diagnostic tests and ROC curve and investigated the effect of the covariate of age on the accuracy of pros-tate cancer diagnostic test (15). In a study conducted in 2010, Zare et al compared 3 diagnostic tests to show fever in children by considering 2 binary variables (left or right ear) as confounding variables in drawings of the ROC curve and concluded that considering the confounders, the area under the ROC curve is not significantly different from any of the 3 methods (16).
In an article published in 2009 by Alvarez et al, the ef-fects of confounding variables on diagnostic tests along with drawings of the ROC curve were studied (17). Fol-lowing Pepe's study, Korner et al presented another study using diagnostic markers for acute appendicitis and meas-ured the values of specificity and sensitivity by drawing the ROC curve and applying these models. In the study just mentioned, the value for the AUC indicator was cal-culated to be between 0.56 and 0.69 (18). In Wang's study conducted in 2006, the ROC curve was estimated with incorporating the confounding variables. In that study, logistic regression models were used to determine the con-founding role of the covariates (19). ROC regression methods have recently been introduced in Stata software, which helps directly examine the effect of covariates on the ROC curve (6). Previous studies have used simple ROC curve to assess the accuracy of white blood cell but
the present study aimed to investigate the diagnostic value of white blood cell counts to predict acute appendicitis with adjustment for age and gender variables.
Methods Population
In this cross sectional study, 131 patients who had un-dergone appendectomy from March 2010 to March 2011 in Valiasr hospital in Arak University of Medical Sciences due to their diagnoses of acute appendicitis were studied. Patients, whose lab test results, particularly their white blood cell count, were incomplete, were excluded from the study. The patients were only included if they had acute abdominal pain (suspected appendicitis) and under-went appendectomy and were finally diagnosed to have acute appendicitis based on the histopathological exami-nation. The gold standard for the diagnosis of the acute appendicitis was considered to be the histopathology re-port by the same pathologist. A surgeon examined the patients and completed a questionnaire accordingly. The criteria used to establish the diagnosis of acute appendici-tis were CT scan and periappendiceal inflammatory changes such as leukocytosis and C-reactive protein. An appendix larger than 6-mm in transverse diameter was considered abnormal. Informed consent for participation in the study was obtained from all participants, or if par-ticipants were children (minors), consent was obtained from a parent or a guardian. Then, 10-cc venous blood samples were drawn from each patient under sterile condi-tions. Appendectomy was performed based on standard protocols and the removed appendixes were sent to the laboratory where lymphocyte culture was conducted and the severity of appendicitis was assessed. The patients were divided into 2 groups: acute appendicitis and normal appendicitis. WBC counts were measured and recorded for all the patients.
This study was approved and conducted by the Ethics Committee of Arak University of Medical Sciences and each patient declared their satisfaction to participate in the study. Authors confirmed that all experiments were per-formed in accordance with relevant guidelines and regu-lations.
Statistical analysis
First, the accuracy of the WBC was measured through calculating the AUC. Then, to examine the role of the confounders of age and gender on the accuracy of WBC in predicting the patients, the ROC regression analysis was used.
One method of parameter estimation in ROC regression analysis is the maximum likelihood method. This method assumes that the test has a normal distribution and that the effect of the confounders and the test variance are differ-ent in the control and the case groups. This model was introduced in 2003 by Pepe (14).
(1)
In this model, Φ is a normal cumulative distribution function, u is a false positive rate (FPR), and . .
The area under the ROC curve is estimated using the
lowing formula (6):
√1
1 2
Using the ROC regression analysis, 4 different models were compared in terms of their area under the ROC curve. In the first model, the accuracy of the WBC test was calculated without adjusting for age and gender vari-ables; in the second model, it was calculated adjusting for age; in the third model, it was calculated adjusting for gender; and in the fourth model, it was calculated adjust-ing for both age and gender. Statistical analysis was con-ducted in Stata 12 software.
Results
Of the 131 cases whose data were used in the present study, 86 (66%) had acute appendicitis and 45 (34%) cas-es had normal appendix. Of the 86 patients, 59 (69%) were male and 27 (31%) were female. Of the total of 45 individuals in the normal groups, 22 (49%) were male and 23 (51%) were female, and the proportion of sex was sta-tistically significant between the 2 groups (p=0.03). Therefore, it can be concluded that sex was a variable that does affect the prognosis of acute appendicitis and its ef-fect on diagnostic accuracy should be examined. Results
indicated that WBC accuracy was higher for males than for females (AUCmale = 0.7346, AUC female = 0.5998).
The overall mean age of participants was 22.2±10.2 (4 to 55) years. The results of the independent t test showed a statistically significant difference (p=0.04) between the mean age in the normal group (19.6±8.8) and in the dis-ease group (23.3±10.8). Thus, it can be concluded that age was also a variable that affected the prognosis of acute appendicitis.
By grouping the age variable, WBC accuracy was in-vestigated in each group. Individuals younger than 15 were placed in group 1, those between 15 to 25 in group 2, and those over 25 in group 3. WBC accuracy was higher in age group 1 than in age groups 2 and 3, and also higher in age group 2 than in age group 3 (AUC age1 = 0.754, AUC age2 = 0.741, AUC age3 = 0.5564).
In addition, the difference between the mean WBC in the normal group (14.4±3.3) and patient group (12.8±4.0) was statistically significant (p=0.03).
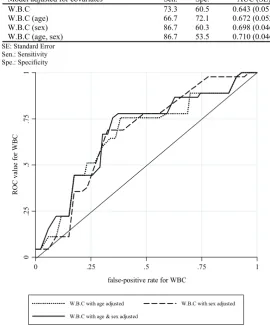
Using ROC regression analysis, the 4 different models were compared in terms of the area under the ROC curve: in the first model, AUC = 0.643 (95% CI: 0.555-0.725) without adjusting for age and sex; in the second model, AUC = 0.672 (0.584-0.751) adjusted for age; in the third model, AUC = 0.698 (0.612-0.775) adjusted for sex; and in the fourth model, AUC = 0.710 (0.624-0.786) adjusted for age and sex (Table 1). ROC AUC related to 3 adjusted
Table 1. The area under the ROC curve and confidence interval based on four models.
p 95% confidence interval
AUC (SE) Spe.
Sen. Model adjusted for covariates
0.005 0.555 to 0.725
0.643 (0.051) 60.5
73.3 W.B.C
0.001 0.584 to 0.751
0.672 (0.052) 72.1
66.7 W.B.C (age)
< 0.001 0.612 to 0.775
0.698 (0.046) 60.3
86.7 W.B.C (sex)
< 0.001 0.624 to 0.786
0.710 (0.046) 53.5
86.7 W.B.C (age, sex)
SE: Standard Error Sen.: Sensitivity Spe.: Specificity
Fig. 1. Adjusted ROC curves for W.B.C by age and sex
0
.2
5
.5
.7
5
1
ROC
v
alu
e
fo
r
WBC
0 .25 .5 .75 1
false-positive rate for WBC
W.B.C with age adjusted W.B.C with sex adjusted
W.B.C with age & sex adjusted
Accuracy of white blood cell in the diagnosis of acute appendicitis using adjusted ROC
models is presented in Figure 1.
Discussion
The present study was performed to investigate the di-agnostic accuracy of white blood cells in the diagnosis of acute appendicitis with incorporating covariates of age and gender into ROC analysis. Using ROC regression, the effect of variables and even their interactions can be ex-amined in the diagnostic test. Similar to other studies, the results of the present study also showed that the WBC variable is one of the strongest variables for identifying patients with acute appendicitis. In most studies on appen-dicitis, to check the accuracy of tests and new variables to identify patients, the tests have been compared with one of the conventional tests, WBC being a persisting example. In this study, WBC count accuracy has been lower com-pared to similar studies (ROC = 0.642), but a major point to take into consideration is the nature of groups studied and the severity of their disease. The reason is that tests used for distinguishing individuals who have the disease from healthy individuals are always more accurate and powerful than tests used for differentiating patients with acute conditions from patients with normal conditions of the disease. Moreover, the present study was conducted to distinguish individuals with acute appendicitis from those with normal appendicitis, but the diagnostic accuracy of variables was evidently slightly low.
Anderson reported that WBC is the strongest discrimi-nant of advanced appendicitis (ROC= 0.890) (20). How-ever, in a study conducted by Huang D., given the area under the ROC curve, the diagnostic accuracy of inflam-matory markers TNFα (tumor necrosis factor alpha) and IL-6 (interleukin 6) had a higher diagnostic value in the diagnosis of acute appendicitis compared to WBC. The reason might have been the target population and the age of the patients. In that study, children were the target pop-ulation, which proves that age is an important factor in the accuracy of diagnostic tests, particularly the diagnostic accuracy of WBC (21). When different age groups are considered, the present study, too, yields different accura-cies. Another variable that has always been focused in studies on appendicitis is gender. In a study conducted by Chung, in the group of patients with perforated appendici-tis 69% were male and 31% female, and in the group with normal appendicitis, 64% were male and 36% female, which is similar to results of the present study (1). This difference is well illustrated in the study conducted by Gurleyik where males comprised a higher percentage than females in all groups, except in the group with normal appendicitis (4). Nevertheless, none of these studies have directly examined the effects of gender on the ROC curve. In a study conducted in 2009, Pepe and Holy Janes con-sidered the direct effect of the variables of age and gender on the ROC curve for diagnosing hearing loss and found the area under the ROC curve to be 0.629 (22). In the pre-sent study, incorporating covariates age and gender into ROC regression analysis increased the diagnostic accura-cy of appendicitis compared to when they were neglected.
Conclusion
Overall, using certain confounding variables is essential, whether they increase or decrease accuracy, and the pre-sent study examined this point with regards to the varia-bles of age and gender. Age and gender highly affect acute appendicitis diagnoses, and studies on appendicitis diag-nosis should consider the direct effects of these variables on diagnostic accuracy, particularly the area under the ROC curve, regardless of which tests or variables they use. Results of the present study showed that considering the confounding variables of age and gender in the ROC curve regression analysis for the WBC test increases the area under the ROC curve. In other words, it increases the diagnostic accuracy of the WBC test in identifying pa-tients with acute appendicitis.
Acknowledgements
This work was supported by Arak University of Medical Sciences, with the grant number 1210. This article is part of a thesis to be submitted by N. Mohammad Gholi Me-zerji for the degree of Master of Science at Arak Universi-ty of Medical Sciences. The authors would like to thank Dr. Shaaban-Ali Alizade and Ali Ghazavi for assisting in data collection and thanks also go to all the colleagues who helped us in this work. The authors would also like to express their appreciation to the Research Consultation Center (RCC) of Shiraz University of Medical Sciences for their valuable assistance in editing this article.
Conflict of Interests
The authors declare that they have no competing interests.
References
1.Sellars H, Boorman P. Acute appendicitis. Surgery. 2017 Aug 1;35(8):432-8.
2.Eng KA, Abadeh A, Ligocki C, Lee YK, Moineddin R, Adams-Webber T, et al. Acute appendicitis: a meta-analysis of the diagnostic accuracy of US, CT, and MRI as second-line imaging tests after an in-itial US. Radiology. 2018 Jun 19;288(3):717-27.
3.Alvarado A. Clinical Approach in the Diagnosis of Acute Appendici-tis. In: Garbuzenko D. Current Issues in the Diagnostics and Treat-ment of Acute Appendicitis. Intech Open. 2018:13-42.
4.Mezerji NMG, Rafeie M, Shayan Z, Mosayebi G. The Diagnostic Value of Surface Markers in Acute Appendicitis; A Diagnostic Accu-racy Study. Bull Emerg Trauma. 2015 Apr;3(2):65-9.
5.Hallan S, Asberg A, Edna TH. Additional value of biochemical tests in suspected acute appendicitis. Acta Chir-Eur J Surg. 1997 Jul;163(7):533-8.
6.Janes H, Longton G, Pepe MS. Accommodating covariates in receiver operating characteristic analysis. Stata J. 2009 Mar;9(1):17-39. 7.Alonzo TA, Pepe MS. Distribution‐free ROC analysis using binary
regression techniques. Biostatistics. 2002 Sep 1;3(3):421-32. 8.Eskandarloo A, Saati S, Ardakani MP, Jamalpour M, Mezerji NMG,
Akheshteh V. Diagnostic accuracy of three cone beam computed to-mography systems and periapical radiography for detection of fenes-tration around dental implants. Contemp Clin Dent. 2018 Jul; 9(3):376.
9.Schisterman EF, Faraggi D, Reiser B. Adjusting the generalized ROC curve for covariates. Stat Med. 2004 Nov 15;23(21):3319-31. 10.Shahsavari S, Baghestani A, Jambarsang S, Lohrabian V.
Compar-ing Marginal and Transition Models in The Analysis of Binary Longi-tudinal Data: a Simulation Study. JIUMS. 2013 Feb 1;20(4):161-7. 11.Fawcett T. An introduction to ROC analysis. Pattern Recogn Lett.
2006 Jun 1;27(8):861-74.
12.Borhani M, Holakouee N, Majdzadeh SR, Kaviani A. Evaluate the accuracy of diagnostic tests in patients with suspected acute appendi-citis ROC curve analysis. Payesh. 2006;5:255-61.
13.Melo F. Area under the ROC Curve. In: Dubitzky W, Wolkenhauer O, Yokota H, Cho KH. Encyclopedia of systems biology. Springer Publishing Company, Incorporated; 2013. pp. 38-9.
14.Pepe MS. The statistical evaluation of medical tests for classification and prediction. New York: Medicine; 2003. pp. 82-3.
15.Janes H, Pepe MS. Adjusting for covariate effects on classification accuracy using the covariate-adjusted receiver operating characteristic curve. Biometrika. 2009 Apr 1;96(2):371-82.
16.Zare N, Namdari M, Jahanpour F. Comparison of axillary, tympanic and rectal body temperatures using a covariate-adjusted receiver oper-ating characteristic approach. Iran Red Crescent Med. J. 2010 May 1;12(3):293.
17.Rodríguez-Álvarez MX, Roca-Pardiñas J, Cadarso-Suárez C. ROC curve and covariates: extending induced methodology to the non-parametric framework. Stat Comput. 2011 Oct 1;21(4):483-99. 18.Körner H, Söreide JA, Söndenaa K. Diagnostic accuracy of
inflam-matory markers in patients operated on for suspected acute appendici-tis: a receiver operating characteristic curve analysis. Eur J Surg. 1999 Jul;165(7):679-85.
19.Wang C, Turnbull BW, Gröhn YT, Nielsen SS. Estimating receiver operating characteristic curves with covariates when there is no per-fect reference test for diagnosis of Johne's disease. Int J Dairy Sci. 2006 Aug 1;89(8):3038-46.
20.Andersson RE. Meta‐analysis of the clinical and laboratory diagno-sis of appendicitis. Br J Surg. 2004 Jan;91(1):28-37.
21.Huang D, Han M, Xie Y. Value of blood inflammatory markers in the diagnosis of acute appendicitis in children. J Southern Med Uni. 2012 Aug;32(8):1154-6.
22.Janes H, Pepe MS. Adjusting for covariates in studies of diagnostic, screening, or prognostic markers: an old concept in a new setting.Am J Epidemiol. 2008 May 13;168(1):89-97.