Open Data Cube for Natural Resources
Mapping in Mexico
Ornelas De Anda José Luis
1, Camacho Pérez Juan Carlos
1, Sánchez
Miranda Hugo Alfredo
11 Instituto Nacional de Estadística y Geografía, Aguascalientes, México.
[email protected] https://www.inegi.org.mx
Abstract.
In recent years, the efforts to enhance the analysis of Earth’s surface with satellite imagery have forced the scientific community to develop different techniques and methodologies. The Open Data Cube aims to provide tools to execute multi-temporal analysis and get accurate products, excluding low-quality pixels in small or large areas of study with an accuracy subject to the resolution of the data used for the analysis. This means that we can make use of the full potential of Earth observation data available from satellite data providers, in this document we take a closer look at Landsat Imagery and its applications. The beginning of the implementation of the Open Data Cube platform began in 2018, positioning itself as a valuable source of spatial data for Natural Resources projects in INEGI and seeks to support the decision-making process based on territorial analyzes with great certainty. The use of this technological solution represents a great leap between the traditional visual interpretation of raster data and the automated processing of data in time series.
1
Theoretical and technical basis
1.1
Background
The Geographic Division in the National Institute of Statistics and Geography (INEGI) is the National Mapping Agency in Mexico. For more than 50 years it has been producing maps in multiples themes; from framework mapping (topographic maps, relief – DEMS, orthoimages, census area mapping, and others, as well as Natural Resources Maps on Geology, Water; ground and surface, Soils, Climate and Vegetation maps for all the country. Being a country that is still going through rapid changes in land use – land cover, there is the challenge of producing Vegetation, Soil and Water maps, among others in a more frequent way. Although all the Natural Resources mapping has always been based on Remote Sensing Imagery (aerial photographs and images from several sensors and satellites: SPOT, LANDSAT, etc), we need now to be able to manage, process and analyze massive amounts of Imagery data in an effective way, and combine the knowledge of experts with state of the art analysis methods for Remote Sensing Data. We expect the Open Geospatial Datacube to give us that capability.
Kalpa Publications in Computing
Volume 13, 2019, Pages 70–78
Proceedings of the 1st International Con-ference on Geospatial Information Sciences
1.2
Geospatial Data Cube
Due to many factors that observations from satellite are subject, for example, clouds, topographic shading, cloud shadows, and instruments failure, it has been necessary to improve the quality of these observations taking into consideration the pixel saturation for each spectral band, band contiguity, slope, cloud or cloud shadow and terrain shadow. Another factor involved is the time extent, most of the satellite products for land-cover mapping are restricted on single dates, even though the accuracy of the observations can be affected by atmospheric phenomena, seasonal changes, anthropogenic interventions, etc.
In order to give a reasonable response to these problems, diverse approaches and methods have been presented, being the multi-temporal classifications and proceedings the ones that show better performances. This is the basis of the Data Cube, in which it is possible to execute different algorithms, perform supervised and unsupervised classifications, extract training samples efficiently, identify and fill contaminated pixels (cloud, cloud shadow) with optimal pixels from the dataset archive, and consequently, provide accurate hypothesis in the following studies [1].
Fig. 1. Open Data Cube concept [1]
3
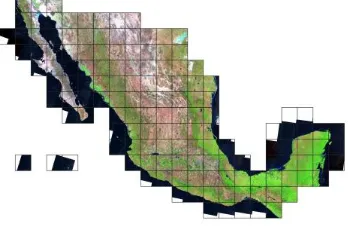
Fig. 2. Landsat scenes and grid for Mexico.
In Mexico, INEGI has the responsibility of generating timely, relevant and truthful information with a high level of quality, for contributing to the national development and growth. To achieve this goal it is essential to make use of the new technologies available, in this sense the Data Cube has shown to be an efficient, effective and powerful tool. The concept has been used and validated in countries such as Australia, Switzerland, Colombia, Vietnam, Kenya, the United States, and China with significant results in fields of study such as agriculture, water bodies, deforestation, soil erosion, snow cover, among others. For its implementation in the country, the Institute has worked in collaboration with Geoscience Australia to develop new algorithms that respond to the variables presented in the mexican territory, as well as with the USGS for the supply of Landsat imagery. The assessment and validation of the results have been carried out jointly with specialists from each thematic area (hydrology, soils, vegetation, geology, climate, island territory) and shared with professionals in different countries via GitHub and Slack Channel, contributing to the global Open Data Cube project.
2
High-Level Architecture
The Open Data Cube [3] is an open source solution for accessing, managing and analyzing large quantities of Geographic Information System (GIS) data. It presents a common analytical framework composed of a series of data structures and tools which facilitate the organization and analysis of large gridded data collections. In this section, we describe and illustrate the architecture of the ODC framework in order to provide a better understanding of ODC.
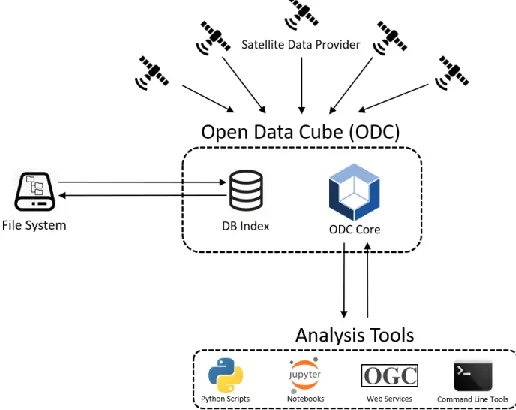
Fig. 3. High-Level Open Data Cube Architecture.
2.1
Open Data Cube Core
The ODC core serves as a layer between satellite data and end-user applications. The entire Open Data Cube is based on the ODC Core.
It provides a common analytical framework to allow multiple data sources to produce information for multiple uses. The ODC can handle data from any satellite data provider.
2.2
File System
Data sources are physically stored in a file system. Currently, the ODC is capable of handling GeoTiff and NetCDF files. Although imagery stored in the file system can be accessed by the ODC Core directly, the properties (metadata) of the images are extracted and stored in a database that serves as a catalog or index for the ODC Core to perform spatial and temporary filters.
2.3
DB Index
To add data to the ODC, it is necessary to carry out an indexing (mandatory) and ingestion (optional) workflow.
2.4
Analysis Tools
As stated earlier, the ODC Core serves as a layer between satellite data providers and applications. A set of open source tools exist to help scientists conduct research using data managed by the ODC. Most popular tools used within the community that utilizes the ODC Core are:
● Command Line Tools: A tool used by programmers/developers to interface with the ODC. ● Python Scripts/Jupyter Notebooks: Both use Python language to interface with ODC. Python
5
● OGC Web Services. These are adapters that can connect non-ODC applications to the ODC.
3
Data
3.1
Landsat archive
Although there are several satellite data providers, currently the ODC implemented in INEGI has focused on Landsat data. It is thought that Sentinel data will begin to be used in the medium term, due to insufficient Landsat resolution for a certain type of analysis.
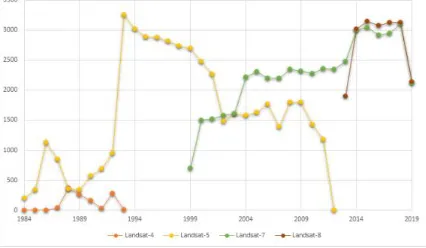
The core dataset is the archive of Landsat-4, Landsat-5, Landsat-7 and Landsat-8 data from 1984 to 2019. In total 113,928 images are available (at September 1, 2019)
Sensor Start Date End Date Count Landsat-4 1984-03-15 1993-07-14 1,156 Landsat-5 1984-03-5 2012-05-5 46,113 Landsat-7 1999-06-30 2019-08-31 47,114 Landsat-8 2013-03-18 2019-08-31 19,545 SUM 113,928
Table 1:Landsat imagery archive for ODC (on September 1, 2019).
Each image has a spatial resolution of 30 m. Actually, we collect Landsat-7 and Landsat-8 images each month corresponding to the previous month.
Fig. 4. Availability of Landsat images per year at the ODC.
3.2
Preprocessing
Landsat images used are obtained from USGS, however, they must go through an additional process called surface reflectance, which allows ARD images. This process is carried out by an order with the list of scenes required for the ESPA service provided by USGS.
In addition to the surface reflectance correction process, there is an essential preprocessing to indicate to ODC the existence of new images available for analysis. We call this process indexing. The indexing and ingestion workflow is necessary to add data to the ODC and provide access to the data
through the ODC Core. Indexing images in the ODC implies recording the metadata of the images in the DB index.
3.3
Optimization
Although analysis can be performed using indexed images, we have verified that the volume of storage consumed by these datasets is very huge. We decided to execute a process called ingestion over indexed datasets, this process is optional since as mentioned, indexed images can be used. The ingestion process consists of a mapping between the original dataset and a resulting dataset with more desirable properties.
Among the main processes of ingestion are:
● Change of GeoTiff format to NetCDF: The NetCDF format considerably reduces the space consumed by a dataset in the file system. We have managed to store the almost 114,000 Landsat scenes available in just ~ 26TB. We are talking about a reduction to almost 25% of the size that the original images in GeoTiff format would consume.
● Tiling: A special grid has been designed to cover the entire Mexican territory. We have chosen the Albers Equal Area projection for the generated grid. Each cell has a dimension of 150,000 meters on each side. These cells are used to "trim" the original scenes in UTM projection into smaller fragments according to the aforementioned attributes, preserving spatial resolution of 30-meter pixel.
4
Why an own implementation?
There are several image databases and processing algorithms in the world with open access. This certainly makes life easier for users. Since they are not complicated in the phases of deployment and implementation of Datacube technology. Nor in the problems of infrastructure and HPC resources to make use of this platform. But what would happen if the third-party platform used by a user ceased to exist for some reason? This is one of the disadvantages of using a third-party implementation.
Another advantage of using your own implementation is that you can fully customize the behavior of the platform, modifying the source code, adding components, configuring the optimal performance of the servers, making complex and highly specialized queries and transactions on the data.
5
Production of information using the Data Cube
5.1
Direct products
7
Fig. 5. Landsat images with clouds from June to August 2015, in the Valle de Santiago municipality, Guanajuato. As a result, a continuous and cloud-free image is obtained using the Geometric Median algorithm.
Water Observations from Space (WOFS). It is an algorithm to detect and monitor the presence of water, by applying a supervised classification ("water" or "no water"). Calculate the percentage of water present in the selected period.
Normalized Difference Vegetation Index (NDVI). The NDVI highlights the vegetation of the rest of the elements present in an image. The algorithm calculates the basic statistics of the NDVI.
Fig. 6. Average NDVI in January-March 2019 period in Reserva de la Biósfera Ría Lagartos, Yucatán.
Normalized Difference Building Index. The NDBI highlights areas with built-up or under construction surfaces compared to the usual naturalized areas with vegetation or bare. It is a frequent way of territorial analysis in urban studies, infrastructure and the comparison of the evolution of urban development over time.
Other products. In addition to the products mentioned above, there are products that are calculated through algorithms included in the ODC. Some of them are Tasselled cap transformation, Modified Normalized Difference Water Index, Urban Index.
6
Analysis based on direct products
6.1
SDG 6.6.1 United Nations
Supported by the products derived from the INEGI Data Cube, Mexico takes the lead in the monitoring of its open water resources, understanding that water-related ecosystems provide important social and
economic benefits to societies. All of this as part of the strategy proposed by the United Nations in the 17 Sustainable Development Goals (SDGs).
Indicator 6.6.1 is the only indicator under Target 6.6 tracks changes over time in the extent of water-related ecosystems. Indicator 6.6.1 enables countries to monitor progress towards achieving Target 6.6, in particular, the protection and restoration of vegetated wetlands. In this case, in particular, the analysis was made with 2 products:
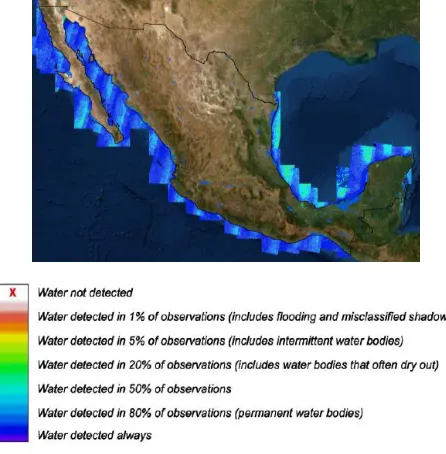
1.- WOfS (Water Observation from Space) with national coverage of 2015, this product displays historical surface water derived from satellite imagery (Landsat-7 and Landsat-8) in a specific time extent with an algorithm executed in the Open Data Cube. WOfS aims to allow a better understanding of where water is usually present; where it is seldom observed; and where inundation of the surface has been occasionally observed by satellite and their temporal dynamics.
For each grid cell within the map, WOfS displays: 1.- The number of clear satellite observations over the period, 2.-The number of occasions water was detected, 3.- The percentage of clear observations on which water was detected, and 4.- The confidence (or probability) that a water observation in this location is correct. This is a percentage, based on a number of factors including the slope of the land and the existence of other corroborative evidence[6].
Fig. 7.Output of the WOfS algorithm in water bodies with the classification.
2.- The National Dataset of water bodies scale 1: 50 000 developed by INEGI Instituto Nacional de Geografía y Estadística of Mexico. This product is derived from the national topographic dataset edited over spot satellite images. The geographical elements that integrate the national coverage are: 1.- Canals or waterways, 2.- Cenotes, 3.- Pond farms, 4.- Dam reservoir, 5.- Ponds, 6.- Estuaries, 7.- Lakes, 8.- Lagoons, 9.- Yacht clubs, 10.- Marshes, 11.- Swamps, 12.- Retteries and 13.- Rivers [7].
To calculate percentage change of national spatial extent of open Waters using a national dataset of water bodies scale 1:5000 baseline 2010 versus WOfS 2015 national coverage using the following formula:
𝑃𝑒𝑟𝑐𝑒𝑛𝑡𝑎𝑔𝑒𝐶ℎ𝑎𝑛𝑔𝑒𝑖𝑛𝑆𝑝𝑎𝑡𝑖𝑎𝑙𝐸𝑥𝑡𝑒𝑛𝑡 =[( 𝛽 − 𝛾)/ 𝛽] * 100
9
An assessment is made in the ranges where WOfS displays high pixel values, this means that in most of the clear observations water is detected and it is easier to eliminate pixels with not
representative values or that do not correspond to the water bodies established in the National dataset of water bodies scale 1:50 000.
Once the formula is applied, the percentage of change in the extent of water-surface in 5 years is 7.38% The nature of this formula yields percentage change values as either positive or negative, which helps to indicate how spatial extent is changing. If the value is negative, it represents a gain in spatial extent while if the value is positive, it represents a loss in spatial extent as shown in this study case.
This is one of the many potential applications that the products of the Data Cube can offer. Furthermore, the analysis of vegetation, soils, lithology, groundwater recharge, urban growth, and
others are subject to the ongoing work of the team, we expect to show the results in future publications.
7
Conclusion
The performance and benefits obtained from the INEGI Data Cube are based on the paradigm of Big Data and allows the optimization of the time required in the data processing. With this solution, we are able to remove the human error both in the process and the results of the analysis. One of the main obstacles in the overall usage of the Data Cube is the high demand for technological resources such as big amount of storage, supercomputer capacity for processing, and finally, the professional profile and background of the Data Cube Team must be multidisciplinary.
In addition to this, the Institute is at the stage of developing new algorithms for supervised classification and data feeding to the cube with sensor images other than Landsat, for example, Sentinel, ASTER, Modis Aqua, and Terra. This will allow obtaining more diversified products and with an optimal resolution for analysis in other projects of the Institute.
At the same time, it is intended that the Data Cube become a data laboratory so that the scientists of the Institute can perform historical regional analyzes that result in new methodologies, high quality, and reliability of the information.
References
1. Lewis, A., Wang, L.-W., Coghlan, R.: AGRI: the Australian Geographic Reference Image: a Technical Report (2011), Geoscience Australia, Canberra.
2. Xiao, Z., Liangyun L., Xidong C., Shuai, X., Yuan, G.: Fine Land-Cover Mapping in China Using Landsat Datacube and an Operational SPECLib-Based Approach (2019), Key Laboratory of Remote Sensing Science, Beijing.
3. Australian Geoscience Data Cube, Open Data Cube, https://www.opendatacube.org, last accessed August 22, 2019.
4. Dale Roberts, Hdmedians,https://github.com/daleroberts/hdmedians#geometric-median, last accessed August 22, 2019.
5. Open Data Cube, Datacube-stats, https://github.com/opendatacube/datacube-stats, last accessed August 22, 2019.
6. Mueller, N., Lewis, A., Roberts, D., Ring, S., Melrose, R., Sixsmith, J., Lymbumer, L., McIntyre, A., Tan, P., Curnow, S., Ip, A.: Water Observations from Space: Mapping surface water from 25 years of Landsat imagery across Australia (2015), Geoscience Australia, Canberra.
7. Instituto Nacional de Geografía y Estadística.: Metodología para la clasificación de cuerpos de agua escala 1: 50 000 (2009), INEGI, Aguascalientes.
![Fig. 1. Open Data Cube concept [1]](https://thumb-us.123doks.com/thumbv2/123dok_us/8874659.1816133/2.612.240.375.294.451/fig-open-data-cube-concept.webp)