ORIGINAL RESEARCH
Introduction
Accurate measurement of arterial PO2 in patients with sepsis1
managed in the critical care unit (CCU), is fundamental in guiding clinical decision-making. The partial pressure of gases and the acid-base balance measured in an arterial blood sample changes over time. The extent of this change depends on the time between taking and analysing the sample.2 These
changes are due to two processes. Firstly, the blood cools. The analyser compensates for loss of heat by warming the sample to 37 ºC.3,4 Secondly, leucocyte metabolism continues, consuming
oxygen and generating CO2, which may result in a change in pH. Reference nomograms designed to compensate for ongoing white cell metabolism are not derived from critically ill patients.5
The early detection of respiratory compromise in patients with sepsis is important. A clear distinction between low PO2 values
due to a delay in processing sampled blood, versus low values due to early onset of respiratory compromise prior to the appearance of clinical signs, is of great clinical relevance.
This study examined the extent of error, at increasing delay times from collection to processing, when measuring PO2 (the primary
outcome), PCO2, and pH (secondary outcomes), in arterial
blood samples drawn from critically ill patients with sepsis and leucocytosis > 12 000/mm³, compared with the changes in
samples from the same patients which were cooled to reduce metabolism.
Methods
This was an observational laboratory study performed at Groote Schuur Hospital, Cape Town, South Africa, from September 2015 to March 2016. A total of 30 patients were included, from both the medical and surgical critical care units. The protocol was approved by the Human Research Ethics Committee of the University of Cape Town (HREC ref 534/2015). Deferred consent was sought from participants.
On study days, all CCU patients with sepsis,as defined by the International Sepsis Definition Conference,1 with a leucocyte
count (WCC) of > 12 000/mm³ as measured on routine early morning blood sampling, and who also had arterial blood analysed for acid base status, were included. Blood from the standard 2 ml arterial blood sampling syringe (PICO50 radiometer®, Radiometer Medical ApS, Denmark) was decanted into two 1 ml glass syringes, after pre-heparinisation with 1 ml heparin 1 000 U and removal of all excess heparin. All air was also removed, and the syringes capped with plasticine. One syringe was cooled on ice and tested at 60 minutes. The second syringe was used to analyse the sample at 0, 10, 30 and 60 minutes. All samples were processed using an ABL800 Flex blood gas
Background: The extent of error, from collection to processing, when measuring PO2, PCO2 and pH in arterial blood samples drawn from critically ill patients with sepsis and leucocytosis, is unknown.
Methods: Twenty-nine patients with sepsis and a leucocyte count > 12 000/mm3, who had routine arterial blood analysis were included in the study. Blood was drawn into two 1 ml heparinised glass syringes. One syringe was cooled on ice and tested at 60 minutes. The other syringe was used for analysis at 0, 10, 30 and 60 minutes. Differences in measurements, from the Time-0 results, were described. For PO2, linear mixed models estimated the impact of time to processing, controlling for the potentially confounding and moderating effects of Time-0 leucocyte count and fractional inspired oxygen concentration respectively.
Results: PO2 exhibited the most pronounced changes over time at ambient temperature: The mean (SD) relative differences at 10, 30 and 60 minutes were -4.72 (8.82), -13.66 (10.25), and -25.12 (15.55)% respectively; and mean (SD) absolute differences -0.88 (1.49), -2.37 (1.89) and -4.32 (3.06) kPa. For pH, at 60 minutes, the mean (SD) relative and absolute differences were -0.27 (0.45)% and -0.02 (0.03) respectively; for PCO2, 6.16 (7.80)% and 0.25 (0.35) kPa. The median differences for the on-ice 60-minute sample for pH and PCO2 were 0.019 and -0.12 (both P < 0.001), and for PO2 0.100 (P: 0.216). The model estimated that average PO2 decreased by 5% per 10 minute delay in processing (95% CI for effect: 0.94 to 0.96; P < 0.001) at the average leucocyte count, with more rapid declines at higher counts, though with substantial inter-patient variation.
Conclusion: Delayed blood gas analysis in samples stored at ambient temperature results in a statistically and clinically significant progressive decrease in arterial PO2, which may alter clinical decision-making in septic patients.
Keywords: sepsis, hypoxaemia, delayed blood gas analysis, PO2, leucocytosis
The influence of delayed sample processing time on PO
2
values in critically ill
patients with sepsis-induced leucocytosis
A Myburgh,1 R Kassanjee,2,3 PR Pretorius4
1 Department of Anaesthesia and Perioperative Medicine, University of Cape Town, Cape Town, South Africa 2 Department of Statistical Sciences, University of Cape Town, Cape Town, South Africa
3 Centre for Infectious Disease Epidemiology and Research (CIDER), University of Cape Town, Cape Town, South Africa ⁴ Private Practice, Cape Town, South Africa
analyser® (Radiometer Medical ApS, Denmark). Glass syringes are incompatible with this machine; therefore, to enable analysis, the sample was decanted into glass capillaries at Time 0.
Statistical analysis
Data was captured in Microsoft Excel. Analysis was performed in R (version 3.4.3).
Descriptive statistics. The trajectories of PO2, pH and PCO2
measurements processed at different times after collection are presented graphically. For each time point and the on-ice samples, as well as for the within-patient absolute and relative differences (compared with Time 0), summary statistics (means and standard deviations) are also tabulated.
Comparison of on-ice 60-minute measurement to 0-minute
measurement. A Wilcoxon signed-rank test was used to
test for zero median values for the (absolute) differences, to accommodate the skew distributions observed.
Modelling of PO2 changes over time.For the primary outcome,
PO2, linearmixed models were fitted to the data: ‘random effects’
allowed patients to vary both in their 0-minute measurements (random intercepts) and their rates of change over time (random slopes); ‘fixed effects’ allowed for average PO2 to vary with time from collection to processing, controlling for differences due to Time-0 WCC values and fractional inspired oxygen concentration (FiO2). It was hypothesised that WCC moderates the effect of time, and therefore an interaction term (for time and WCC) was included. The PO2 measurements were first log transformed, to accommodate larger variability at higher levels and to better suit normality assumptions. Multiplicative/ratio changes in the mean
5
10
15
20
25
Time (minutes) p02
(k
P
a)
0 10 30 60 *ICE
A
3.
0
4.
0
5.
0
6.
0
Time (minutes)
pC0
2
(k
P
a)
0 10 30 60 *ICE
B
7.
3
7.
4
7.
5
7.
6
Time (minutes)
pH
0 10 30 60 *ICE
C
Time (minutes)
Figure 1. Trajectories of blood gases for 29 critically ill patients with sepsis and raised white cell counts (> 12 000/mm³), as measured at 0, 10, 30 and 60 minutes after sample collection, for (A) p02 (kPa), (B) pC02 (kPa), and (C) pH. *ICE represents the measure on a sample cooled from collection to processing at 60 minutes. Grey lines: Individual patient trajectories; black lines and diamonds: Average measurements.
Table I. Summary (means and standard deviations) of blood gas measurements at each time of processing after collection, as well as within-patient
differences in measurements when compared to the measurements on samples processed immediately upon collection.
Blood gas Ice Time Measurements1: Absolute difference, compared to
Time 01,2:
Relative difference, compared to Time 0 (%)3:
Mean (SD) Mean (SD) Mean (SD)
PO2
No
0 15.91 (4.00)
10 15.04 (3.71) -0.88 (1.49) -4.72 (8.82)
30 13.54 (3.16) -2.37 (1.89) -13.66 (10.25)
60 11.59 (2.98) -4.32 (3.06) -25.12 (15.55)
Yes 60 16.33 (4.27) 0.42 (1.64) 2.81 (10.25)
pH No
0 7.43 (0.07)
10 7.45 (0.07) 0.02 (0.02) 0.26 (0.29)
30 7.44 (0.07) 0.01 (0.03) 0.11 (0.43)
60 7.41 (0.07) -0.02 (0.03) -0.27 (0.45)
Yes 60 7.45 (0.07) 0.02 (0.03) 0.31 (0.42)
PCO2
No
0 4.32 (0.61)
10 4.22 (0.58) -0.10 (0.22) -2.20 (4.63)
30 4.41 (0.60) 0.09 (0.26) 2.25 (5.61)
60 4.58 (0.64) 0.25 (0.35) 6.16 (7.80)
Yes 60 4.13 (0.63) -0.19 (0.24) -4.50 (5.46)
1 in kPa for PO
2 and PCO2, unitless for pH 2 Current measurement – 0-minute-measurement
PO2, on its original scale, are reported; 95% confidence intervals and P-values are based on Wald-type approximations. Model fitting was performed using the function ‘lme’ in R, in package ‘nlme’. Model fit was assessed by visual inspection of residual plots.
A priori sample size calculation:Assuming a clinically significant
average decrease in PO2 of 2 kPa over 60 minutes, with a standard deviation of 2 kPa, 11 patients would be required to detect this difference with 90% power and α error 0.05, based on a paired t-test. In view of the unknown variability in the decrease in PO2 on the basis of differing metabolic rate, 30 patients were studied.
Results
Blood samples were collected from 30 adult patients admitted to the intensive care unit with a diagnosis of sepsis. One patient was excluded from the analysis, since processing of the sample suggested that the patient was in extremis (pH of 6.8) and therefore not representative of the group studied. Data was therefore analysed from 29 patients.
Figure 1 displays the individual patient, and average trajectories of measured PO2, PCO2 and pH over time from collection to processing, as well as the 60-minute results for the samples stored on ice. Particularly for pH and PCO2, patient trajectories
appear to be fairly flat, though there is substantial variability in the absolute levels. At 60 minutes, differences in measurements resulting from storing samples on ice are also evident.
Table I summarises time-specific measurements, and differences in measurements when compared to those obtained from
samples processed immediately. For PO2, there is a more
pronounced decrease in measurements over time, although the 60-minute on-ice measurements are similar to the 0-minute measurements. For PCO2 and pH, average differences are small,
considering the magnitude of variability.
When statistically considering the median absolute difference of the 60-minute on-ice blood gas measurements from the 0-minute values, within patients, there is a suggestion of more subjects having a higher pH (median: 0.019; 95% CI: 0.004 to 0.032; P < 0.001), and lower PCO2 (median: -0.12; 95% CI: -0.280
to -0.060; P < 0.001), while there is lack of such evidence for PO2
(median: 0.100; 95% CI: -0.200 to 1.300; P: 0.216).
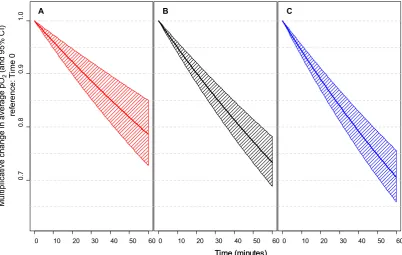
The results of modelling the PO2 trajectories are summarised in Table II and Figure 2.
FiO2 and WCC were included as model covariates: the FiO2 measurements were concentrated at 0.4 (19/29 values), with the remaining values ranging from 0.2 to 0.8. For WCC, there was one high value of 52 600/mm3, and the remaining values had a mean
(SD) of 22 488 (5 654) /mm3, ranging from 14 500 to 34 440 /mm3.
A decline in PO2 measurements over time was estimated: At the average WCC (23 530/mm3), there was a 5% reduction in average
in PO2 for every 10 minutes (effect: 0.95; 95% CI: 0.94 to 0.96; P < 0.001), with a more rapid reduction at higher WCC values (refer to Figure 2). Despite the low variability in FiO2 measurements,
higher FiO2was associated with lower average PO2, from Time 0.
The model-estimated random effects (not shown) suggest that there is substantial inter-patient variability in terms of starting values and rate of change over time, not accounted for by differing FiO2 and WCC, and therefore the tabulated and plotted model should not be used for patient-level prediction. Overall findings remained similar when excluding the patient with a large WCC value.
Discussion
This study examined the effect of metabolically active leucocytes in critically ill patients with sepsis and leucocytosis, on the rate of decline of PO2, should there be a delay between sampling and blood gas analysis. It was shown that such delays may have both statistical and clinical significance. The main findings indicate a decline in average PO2 over time. The fitted exponential rate of
decline varies substantially amongst patients, and also depends on the patient’s WCC: For a patient with ‘average’ decline, who also has the sample average WCC, the reduction in average PO2 is
approximately 5% for each additional 10 minutes from collection to processing. For example, beginning at 16 kPa, this equates to absolute errors of -0.8, -2.3 and -4.3 kPa at 10, 30 and 60 minutes respectively. This decline is more rapid for higher WCCs, with an additional decline per 10 minutes of approximately 2% for every additional 10 000 WCC/mm3.
This result is primarily due to the effect of the ongoing metabolic activity in leucocytes present in patients with sepsis, after blood sampling and storage at room temperature. Work done in leukaemic patients with excessively raised white cell counts, shows “pseudohypoxaemia”.6-13 This is due to continued
Table II. Linear mixed model estimation of impact of time after collection, white cell count (WCC) and fractional inspired oxygen concentration (FiO2) on average measured partial pressure of oxygen (PO2), within patients. Model outputs for random effects (not shown) indicate substantial remaining inter-patient variability in starting values and rates of change over time.
Multiplicative effect
P-value
Estimate 95% Confidence interval
Time after collection (units: 10 minutes), when WCC = 23 530/mm3 0.950 0.940;0.960 <0.0001
WCC (units: 10 000/mm3) 1.073 0.933;1.235 0.3117
FiO2 (units: 10%) 0.914 0.838;0.997 0.0437
metabolism in large numbers of sampled leucocytes. In sepsis, although the leucocytosis is more modest, the cells are possibly more metabolically active due to immune activation.
To accurately assess this effect, the samples were kept in glass syringes, since plastic syringes are permeable to gases.14,15
Previous work showed reductions in PO2 at 30 minutes ranging
from -0.8 kPa to + 1.07 kPa when the sampled blood was stored in plastic syringes at ambient temperature, and an exaggerated response when stored on ice, with deviations between +0.8 kPa and + 1.8 kPa.2 This response can be explained as follows: With
a reduction in temperature from 37 °C to 4 °C, the solubility coefficient for PO2 rises from 0.0214 to 0.0395.2 The affinity of
haemoglobin for oxygen also increases with a reduction in P50, the oxygen tension at which haemoglobin is 50% saturated. When whole blood is cooled in this way, the P50 is reduced from 3.5 kPa to 0.61 kPa, at a normal pH. This causes a reduction in the PO2 and, as a consequence, a larger gradient between the environment and the sample. This leads to an influx of oxygen, if the PO2 in the sample is lower than the ambient PO2 of
approximately 20 kPa. The reverse of this process ensues when the sample is re-heated to 37 °C. The P50and solubility will return to their original values at 37 °C. This releases the exogenous oxygen, which leads to a falsely increased PO2.2 Plastic is 4–150
times more permeable than glass to oxygen, under standard temperature and controlled environmental factors, mainly due to the difference in pore density of the two substances, and the size of the oxygen molecule.15 When blood is stored in glass
syringes, as in our study, the PO2 remains stable.16
When storing blood samples at ambient temperature, the changes in temperature as equilibration progresses, affect both the solubility of oxygen and the affinity of haemoglobin for oxygen. Temperature correction of the measured oxygen tension in blood is thus a complex matter. Errors originate as a result of any discrepancy between the temperature of the sample and that of the patient at time of analysis. Mathematical equations have been derived to use a correction factor to compensate for these changes.4 The absolute decrease in oxygen content in
a stored sample is linear with time. Kelman’s nomograms were constructed with a mean value of 9.0 × 10⁻⁵ ml O
2/ml per min
at 37 °C. These were based on a haemoglobin concentration of
14.8 g/100 ml and a standard oxyhaemoglobin dissociation curve, from Severinghaus’ work.5 The nomograms are also based
on the assumption that the leucocyte and reticulocyte counts (in the case of PO2) and the haemoglobin concentration, are within
the normal range. However, these nomograms were not derived for patients with sepsis, and our study contributes clinically useful additional information in this setting.
In conclusion, delayed blood gas analysis in critically ill patients with sepsis and a leucocyte count > 12 000/mm³, results in a statistically and clinically significant progressive decrease in the PO2, if the sampled blood is stored at ambient temperature. This phenomenon, unless addressed either by rapid processing or storage of the sample on ice, could unduly influence clinical decision-making, particularly in patients receiving ventilatory support.
0 10 20 30 40 50 60
0.
7
0.
8
0.
9
1.
0
0:60
em
A
0 10 20 30 40 50 60
0:60
em
B
0 10 20 30 40 50 60
0:60
em
C
Time (minutes) Time (minutes)
M
ul
tipl
ic
at
iv
e c
ha
nge i
n av
er
age pO
2
(and 95%
C
I)
ref
er
enc
e:
T
im
e 0
Figure 2. Visual representation of model-estimated impact of time from collection to processing, on average measured partial pressure of oxygen (PO2): the within-patient multiplicative change in average PO2 over time, with 95% confidence intervals, is shown for a patient with an average rate of change in PO2 (note there is substantial variability amongst patients). Model-estimated rates of decline are shown for patients with a white cell count
equal to the sample (A) first quartile of 18 000/mm3
Acknowledgements
The authors declare that they have no financial or personal relationships which may have inappropriately influenced them in writing this paper. They would like to thank Prof RA Dyer for the preparation of the manuscript.
References
1. Levy MM, Fink MP, Marshall JC, et al. 2001 sccm/esicm/accp/ats/sis international sepsis definitions conference. Intensive Care Medicine 2003;29:530-8. 2. Schmidt C, Muller-Plathe O. Stability of PO2, PCO2 and pH in heparinized whole
blood samples: influence of storage temperature with regard to leukocyte count and syringe material. European journal of clinical chemistry and clinical biochemistry : Journal of the Forum of European Clinical Chemistry Societies 1992;30:767-73.
3. Gabel RA. Algorithms for calculating and correcting blood-gas and acid-base variables. Respiration Physiology 1980;42:211-32.
4. Andritsch RF, Muravchick S, Gold MI. Temperature correction of arterial blood-gas parameters: A comparative review of methodology. Anesthesiology 1981;55:311-6
5. Kelman G, Nunn J. Nomograms for correction of blood PO2, PCO2, pH, and base excess for time and temperature. Journal of Applied Physiology 1966;21:1484-90. 6. Ben-Meir M, Tibballs J. Leukocytotic pseudohypoxaemia. Anaesthesia and
Intensive Care 2010;38:566-8.
7. Charoenratanakul S, Loasuthi K. Pseudohypoxaemia in a patient with acute leukaemia. Thorax 1997;52:394-5.
8. Di Boscio V, Prakash UB. Pseudohypoxemia caused by hyperleukocytosis. Journal of Bronchology & and Interventional Pulmonology 1998;5:43-6.
9. Hess CE, Nichols AB, Hunt WB, Suratt PM. Pseudohypoxemia secondary to leukemia and thrombocytosis. New England Journal of Medicine 1979;301:361-3. 10. Horr S, Roberson R, Hollingsworth JW. Pseudohypoxemia in a patient with
chronic lymphocytic leukemia. Respiratory care 2013;58:e31-e3.
11. Prasad K, Manjunath P, Priya L, Sasikumar S. Overcoming the problem of pseudohypoxemia in myeloproliferative disorders: Another trick in the bag. Indian Journal Of Critical Care Medicine: peer-reviewed, official publication of Indian Society of Critical Care Medicine 2012;16:210.
12. Van de Louw A, Desai RJ, Schneider LW, Claxton DF. Hypoxemia during extreme hyperleukocytosis: How spurious? Rest Care. 2016;61(1):8-14.
13. Ruppel GL. Of time and temperature, plastic and glass: specimen handling in the blood-gas laboratory. Respiratory Care, 2006.
14. Pretto JJ, Rochford PD. Effects of sample storage time, temperature and syringe type on blood gas tensions in samples with high oxygen partial pressures. Thorax 1994;49:610-2.
15. Wiwanitkit V. Glass syringes are better than plastic for preserving arterial blood gas for oxygen partial pressure determination: an explanation based on nanomaterial composition. International Journal of Nanomedicine 2006;1:223. 16. Beaulieu M, Lapointe Y, Vinet B. Stability of PO2, PCO2, and pH in fresh blood