IJPAR |Vol.5 | Issue 4 | Oct - Dec -2016
Journal Home page: www.ijpar.com
Research article Open Access
Stability Indicating Analytical method development & Validation of 2,
4-dihydroxy-5- Fluoro Pyrimidine in bulk drugs & its Injection formulation
S.Imampasha
1, Dr. Mohd. Ibrahim
2, Dr. V.Murali Balaram
1 *1Department of Pharmaceutical Analysis & Quality Assurance
,
Sultan-Ul-Uloom College of Pharmacy,
Banjara Hills, Hyderabad-500034, TS, India
2
Department of Analytical Chemistry, Nizam Institute of Pharmacy Research Centre, Nalgonda T.S India
*Corresponding Author: S. ImampashaEmail: [email protected]
ABSTRACT
Stability indicating HPLC method is developed for 2,4-dihydroxy-5-fluoropyrimidine bulk drug and its formulation, all validation parameters including specificity (interference, forced degradation), Precision (system, method, intermediate), Linearity, accuracy, range ,robustness studied, forced degradation (acid, base, peroxide, water, thermal ,humidity, photo stability effect studied for 2,4-dihydroxy-5-fluoropyrimidine,Retention time was found to be 3.4minutes at the wave length of 254nm.
INTRODUCTION
2,4-dihydroxy-5-fluoropyrimidine is an anti-metabolite used in the cancer chemotherapy, Estimation of the drug in bulk drug industry and formulation sites by liquid chromatography is essential to maintain quality maintenance &for regulatory affairs to detect the quantity of the drug at bulk level &pharmaceutical formulation [1].
Chromatographic parameters
Column : 250 x 4.6mm, 5 µm
(YMC Pack ODS or equivalent to L1)
Flow rate : 1.0 mL/min
Wavelength : 254 nm
Injection Volume : 20 μL
Column Temperature : Ambient
Run time : 20 minutes
MATERIALS &METHODS
Details of Chemicals
Fluorouracil Standard (Batch IOG371.USP Grade), Fluorouracil 50mg/ml (Batch IFU-319, Ingénues, ACN (Merck)
Instruments (Columns, serial no.) :
HPLC
VLS-DR/HPLC/05 VLS-DR/HPLC/12 VLS-DR/HPLC/16
VLS-DR/HPLC/17
Analytical Balance
VLS-DR/BAL/01
pH Meter
VLS-DR/PHM/01
Preparation of Buffer
Accurately weigh about 6.8 gm of monobasic potassium phosphate and dissolve in 1 liter water. Adjust the pH of this solution to 5.7 with 5(M) Potassium hydroxide solution.
Preparation of Mobile Phase
Mix buffer and acetonitrile in the ratio of 95:5 %v/v.
Preparation of Standard solution
Accurately weigh and transfer about 10 mg of Fluorouracil standard into 100 mL volumetric flask, dissolve and dilute to the volume with diluent. Transfer 1 mL of this solution into a 10 mL volumetric flask, dissolve and dilute to volume with diluents.
Preparation of Sample
Take 1 mL of 50 mg /mL sample solution and transfer into a 50 mL volumetric flask, dissolve and dilute to volume with diluents. Transfer 1 mL of this solution into 100 mL volumetric flask, dissolve and dilute to volume with diluents [6].
Procedure:
Separately inject 20 μL of blank (diluents), standard solution in five replicates, check standard once and sample solution (each preparation). Record the chromatograms and measure the area response for fluorouracil peak [7].
System suitability
RSD for Fluorouracil peak area from five replicate injections of standard solution should be not more than 0.73, Tailing factor for Fluorouracil peak area from standard solution should be not more than 1.5, Ratio between Standard and Check standard solutions should be between 0.98 to 1.02.
Validation Results[2.3.4]
System Suitability
As per methodology, injected blank, standard solution for five times and checks standard solution into HPLC system [8].
Specifity
Interference Study
As per methodology, injected blank, placebo solution once each and standard solution, sample solution and spiked sample solution and checked the peak interference of blank, placebo and impurities at the retention time of Fluorouracil and its Impurities. Prepared and injected each impurity at 1% level individually and checked the interference at each impurity retention time. If the degradation is not achieved at any of the condition, report the minimal values.
Precision
System Precision
As per methodology, injected blank and standard solution five times and check standard once into HPLC system.
Method Precision
Analyzed six test preparations of Fluorouracil injection 50 mg/mL as per the methodology and determined the % RSD of six sample preparations for Assay of Fluorouracil.
Linearity
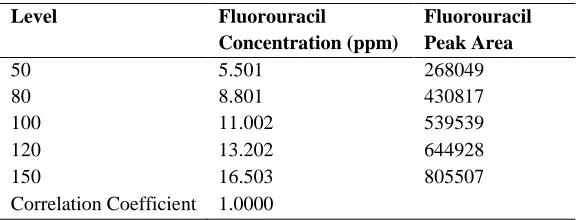
Linearity for Fluorouracil was determined in the concentration range from 50 to 150 % levels of test concentration levels.
Accuracy
As per methodology, prepared and injected 50%, 100% and 150% level of target concentrations sample solutions of Fluorouracil and demonstrated the accuracy of the method. Calculated the system suitability parameters and % individual and % mean recovery at each level.
Robustness (Effect of variation in PH)
System suitability preparation were analyzed as per the methodology at low PH (5.6) and high PH (5.8) variation in buffer.
Effect of Variation in Flow rate
System suitability preparations were analyzed as per the methodology at low column flow (0.9 mL/min) and high column flow (1.1 mL/min) variation in flow rate.
Effect
of
Variation
in
mobile
phase
composition:
System suitability preparations were analyzed as per the methodology at low mobile phase
composition (93:7) and high mobile phase composition (97:3) variation in mobile phase composition.
Effect
of
Variation in Column Oven
Temperature
System suitability preparations were analyzed as per the methodology at high column oven temperature (30°C) variation in column oven temperature.
Stability of analytical solution
Stability study of standard solution and sample preparation were performed at room temperature and 2-8 °C conditions.
Table 1: Complete Degradation Data [5]
S.No Type of Stress Assay (%w/w)
Degradation (%w/w)
Purity 1Angle Purity 1 Threshold Peak Purity (Pass/Fail)
1 Acid 99.7 - 0.663 1.089 Pass
2 Base 96.6 - 0.635 1.079 Pass
3 Peroxide 80.4 - 0.653 1.117 Pass
4 Water 96.8 - 0.446 1.106 Pass
5 Thermal 98.8 - 0.454 1.089 Pass
6 Humidity 100.9 - 0.462 1.083 Pass
7 Photo stability 95.9 - 0.452 1.087 Pass
Table 2: Method precision Results
Sample Assay(%w/w)
01 101
02 101
03 101
04 101
05 101
06 102
Table 3: Intermediate Precision
Parameter Analyst-1 Analyst-2
Column ID Number USNH040034 H-15-07
HPLC ID Number VLS-DR/HPLC/14 HP2 (Agilent 1100)
Date of Analysis 2015.03.16 2015.04.09
Table 4: Intermediate precision Results
Sample Assay(%w/w)
01 102
02 102
03 102
04 101
05 102
06 101
Average 102
S.D 0.516
%RSD 0.5
Table 5: Precision and Intermediate Precision Method
Preparation Analyst –I/Column-I/System-I Sites (Transferring site)
1 101
2 101
3 101
4 101
5 101
6 102
Avg 101
SD 0.4082
%RSD 0.4
%RSD(12 Prep) 0.5
Table 6: Linearity Results of Fluorouracil
Level Fluorouracil
Concentration (ppm)
Fluorouracil Peak Area
50 5.501 268049
Table7: Accuracy of Fluorouracil (Assay)
Sample No Spike level Added (ppm) Found (ppm) ‘%’ Recovery ‘%’ Mean recovery %RSD
1 50% 5.005 5.071 101 101 0.0
2 50% 5.005 5.048 101
3 50% 5.005 5.051 101
4 50% 5.005 5.060 101
5 50% 5.005 5.070 101
6 50% 5.005 5.048 101
1 100% 10.010 9.893 99 99 0.0
2 100% 10.010 9.891 99
3 100% 10.010 9.887 99
1 150% 15.015 14.280 99 99 0.0
2 150% 15.015 14.890 99
3 150% 15.015 14.883 99
4 150% 15.015 14.897 99
5 150% 15.015 14.903 99
6 150% 15.015 14.839 99
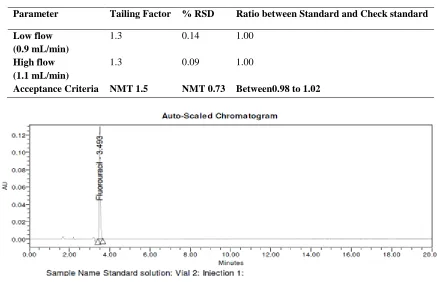
Table 8: Effect of Variation in Flow rate
Parameter Tailing Factor % RSD Ratio between Standard and Check standard
Low flow (0.9 mL/min)
1.3 0.14 1.00
High flow (1.1 mL/min)
1.3 0.09 1.00
Acceptance Criteria NMT 1.5 NMT 0.73 Between0.98 to 1.02
Spectra.2: Typical chromatogram of Sample
Spectra.5: Typical chromatogram of Humidity stress Sample
GRAPH 1: Fluorouracil Linearity graph
CONCLUSION
Analytical method was developed for estimation of 2,4-dihydroxy-5-fluoropyrimidine in bulk drug &its formulation ,validated for all the parameters . Hence, it was concluded that the analytical method is specific, precise, linear, accurate, rugged and robust. Hence, the present analytical method proved as stability indicating the results were within the acceptance criteria therefore can be used for regular analysis in Pharmaceutical bulk drug industry and at the formulation manufacturing
industry for drug estimation ,There is no interference of excepients in the injection formulation such as diluents , solubulizers etc
Acknowledgement
I convey my sincere thanks to Dr.B .Bhanu Teja, Dr.Srikanth U Allamraju, TherDose Pharma Pvt .Ltd, Hyderabad, Telangana, India, for the support and guidance for providing all the facilities by enabling me to complete this work at such a caliber.
REFERENCES
[1]. Bakshi M, Singh S., Development of validated stability-indicating assay methods-critical review. J Pharma Biomed Anal. 28, 2002, 1011–40.
Fluorouracil Linearity y = 48823.29064x + 623.92099R2 = 0.99997
10000 210000 410000 610000 810000
4.5 6.5 8.5 10.5 12.5 14.5 16.5
Conce ntration (ppm)
A
re
a Series 1
[2]. ICH, Stability testing of new drug substances and products. Geneva: International Conference on Harmonization, IFPMA; 2003.
[3]. ICH, Stability testing: Photo stability testing of new drug substances and products .Geneva: International Conference on Harmonization, IFPMA; 1996.
[4]. Gerber, F.; Krummen, M.; Potgeter, H.; Roth, A.; Siffrin, C.; Spoendlin, C. "Practical aspects of fast reversed-phase high-performance liquid chromatography using 3μm particle packed columns and monolithic columns" 2004.
[5]. Ettre, C.Milestones in Chromatography: The Birth of Partition, Chromatography”. LCGC. 19(5), 2001, 506–512. Retrieved 2016-02-2
[6]. Henry, Richard A. "The Early Days of HPLC at DuPont". Chromatography Online. Avanstar Communications Inc, 2009.
[7]. Giddings, J. Calvin Dynamics of Chromatography, Part I. Principles and Theory. Marcel, Dekker, Inc., New York. 1965, 281
![Table 1: Complete Degradation Data [5]](https://thumb-us.123doks.com/thumbv2/123dok_us/8870476.1813600/3.612.246.362.523.667/table-complete-degradation-data.webp)
![Crystal structure and Hirshfeld surface analysis of (μ 2 {4 [(carboxylatomethyl)carbamoyl]benzamido}acetato κ2O:O′)bis[bis(1,10 phenanthroline κ2N,N′)copper(II)] dinitrate N,N′ (1,4 phenylenedicarbonyl)diglycine monosolvate octahydrate](data:image/gif;base64,R0lGODlhAQABAIAAAP///wAAACH5BAEAAAAALAAAAAABAAEAAAICRAEAOw==)