Original Article
Journal of Applied Biotechnology Reports, Volume 3, Issue 2, Spring 2016; 425-431 All rights reserved for official publication of Baqiyatallah university of medical sciences©
Stem Cells Culture Bioreactor Fluid Flow, Shear Stress and Microcarriers Dispersion
Analysis Using Computational Fluid Dynamics
Mohamad Julaey1*, Morteza Hosseini1, Hossein Amani1
Abstract
Introduction
Human mesenchymal stem cells (HMSCs) have shown great ability for a wide range of clinical applications. In these applications, the cells usually need to be cultivated and proliferated to large number of cells before being injected to the human body in which the stem cells grow under special and susceptible circumstances [1-3]. The main parameters which should be controlled in a stem cell growth bioreactor include pH, culture temperature, oxygen demand of the cells, and solubility in the culture, nutrients concentration and their availability. In recent years, in order to create real conditions and stimulate the growth parameters many biomaterials have been studied and cell micro-carriers have been proposed [2-4].
In suspended cell bioreactors, after the division of cells and their accumulation, the diffusion will reduce drastical-ly and as a result, the transportation of oxygen and other nutrients to the cells will be difficult which ultimately dis-turbs cell growth [5, 6]. However, when micro-carriers are being used and cells are adsorbed on their surfaces, due to the movement of cells throughout the culture, the problem of oxygen and nutrient shortage resulting from lack of diffusivity will be simply solved [7].
In order to reduce the proliferation of stem cells, laminar flow of culture is passed through the 2D monolayer of cells [8]; while, for higher scale cell cultivation, stirred tank bioreactors should be used. Due to turbulences, the effects of hemodynamic forces are very important and vital in these bioreactors compared to fixed bed or laminar flow bioreactors. For example, a study showed that in a stirred bioreactor turbulent culture, the division ability of
embry-onic stem cell is increased [9]. Meanwhile, results from another research indicated that in a 2D culture with a lami-nar flow, the ability of a monolayer embryonic stem cell was increased [10].
There are two possible explanations for this difference: the 3D fluid flow of the culture in stirred bioreactor was not homogenous and therefore nutrients and oxygen could not pass through all of the cells and the different levels of shear stresses which affect cells performance in a culture [5]. Studies showed that mid-level of shear stresses is essential for cell growth. This will help extracellular protein secretions and also increase the cell diffusivity in the culture. In addition, the higher rate of shear stresses and hemodynamic forces cause serious damages to the cells [11].
Studies demonstrated that if the eddy sizes are equal or even smaller than the particles, a considerable shear stress would be inserted on the particles. On the other hand, when an eddy is not covering the whole particle, it would exert a partial influence on the cell and make them rotate; therefore, the shear will be transferred. Unlike the suspended cells, the attached cells to the micro carriers with high micron sizes are sensitive to the collisions and vulnerable to the damages [12, 13].
Because of the turbulence made by the impellers in this kind of bioreactor, there is an ability to suspend large particles in the fluid flow. Consequently, these systems are very suitable for cells’ growth on micro carriers. Despite the ability of these bioreactors in producing large amount of stem cells, receptors and the ligand bonds would be changed due to shear stresses and severe turbulence in The growth rate of stem cells in Mobius CellReady 3L bioreactor has been studied
using COMSOL Multi-physics simulation software in order to find out the best operational parameters for secure cell growth. The bioreactor geometry was defined according to the EMD Millipore issued informationwhile turbulent and unsteady state solid-liquid 2-phase fluid flow equations were used for modeling the bioreactor. For mathematical solution, zero velocity for the primary and wall boundary conditions and maximum volume fraction of 0.63 for 0.0155 litters (about 10 g) of micro carriers was selected. Results from solving the fluid flow equations with mesh sized geometry of the bioreactors indicated that when the speed of the impeller is raised from 30 to 150, the eddies will encounter an increase from 0 to 74.5 in volume fraction base which can be harmful to the micro carriers.30 rpm velocity of the impeller was observed to be the minimum velocity required for the micro carriers to move through the fluid while 60 rpm was chosen as the optimum impeller speed due to well dispersion of the solid phase and minimum volume fraction of the harmful eddies.
Keywords: Stem Cell, Bioreactor, Two-Phase Flow, Shear Stress, Microcarrier
1. Faculty Of Chemical Engineering, Babol Noshirvani University Of Technology, Babol, Iran
*Corresponding Author Mohamad Julaey
Faculty Of Chemical Engineering, Babol Noshirvani University Of Technology, Babol, Iran E-mail: [email protected]
178 Journal of Applied Biotechnology Reports, Volume 3, Issue 2, spring 2016 these systems, thus the metabolism and the cells
pheno-types would be affected.
Since the maximum amount of shear stresses, which are directly proportional to the fluid velocity, are generated at the endpoints of the blades and fluid velocity in these points are calculated by multiplying the tank diameter with angular velocity, these two parameters can be the main identifiers of an optimized condition in bioreactor design and operation. Diameter and the speed in round per minute of the impeller should be defined so that the micro carriers could suspend suitably and produce homogenous mixtures without any shear stresses damaging the cells and micro carriers [6, 14-16].
This studyaimsto optimize the fluid flow parameters in a commercial model of bioreactor, Mobius CellReady 3L from the EMD Millipore Company during the growth of stem cells on the micro carriers [17-19], using COMSOL Multiphysics software. This software is a multi-phenomenon simulating platform which employs numeri-cal method of finite element to the transport phenomena equations. Using different simulations, operation condi-tions would be chosen in a way that homogenous culture with low gradients of oxygen and nutrients could be achieved, meanwhile no harm is excreted on the cells loaded on the micro-carriers from the turbulent flow parameters.
In real conditions, stem cells culture on the micro carriers and in Mobius CellReady 3L, is a 3 phase (Solid-Gas-Liquid) mixture. These bioreactors are equipped with air sparger which introduces the air bubbles as dispersed phase into the liquid culture and provides the demanded oxygen from the cells to grow. Solid micro carriers of the stem cells are other dispersed phase of the culture, which are needed to be dispersed well and optimized in the whole culture by means of the impeller rotation. Three-phase simulation in these kinds of mixtures and bio cultures are
too difficult; Therefore, Kaiser et al., only investigated the
two-phase liquid-gas flow in the culture and evaluated the vital parameters of this flow including oxygen mass trans-fer coefficient [17]. In a complementary way, the present study evaluates solid-liquid two-phase flow in the bioreac-tor. In their study, homogenous flow of liquid and oxygen bubbles was achieved; hence this study looks for homogenous flow of micro-carrier particles in the culture
mixture for optimal nutrition of the cells. Kaiser et al., [17]
studied the effect of impeller speed on the air volume fraction and oxygen mass transfer coefficient; but in this study the effect of impeller speed on volume fraction of micro carrier particles and shear stresses on the attached cells have been evaluated.
Materials and Methods
Geometry
Mobius CellReady 3L bioreactor [20], has the operational capacity of 1.0L to 2.4L and the total capacity of 3.0 L. The total height and diameter of the bioreactor tank were 249mm and 137 mm, respectively with the diameter/height ratio of 0.55. The mixing operation will be assisted by an agitator consists of three marine type impellers with total diameter of 76.2 mm and approximate pitch angle of 25 degree and total distance of 28 mm from the tank bottom.
Two cylindrical sensors with height of 235 mm and diame-ter of 12 mm were used to control and measure the pH and DO (dissolved oxygen) of the culture. A temperature sensor with geometry of an incomplete cone shape with two diameters of 7.6 mm and 12 mm and the total height of 200 mm was also placed in bioreactor tank. These sensors can indeed be used as baffles for more agitation of the culture mixture [20].
Governing equations
Generally, fluid flow simulation is governed by using mass, energy and momentum conservation rules. The continuity equation of these rules is a balance between accumulation, inlet and outlet by diffusion and convection of the conserved quantity. The conservation rules would be expressed by equation (1):
uΦ ∙ J S eq. (1)
In this equation Φ expresses the amount of the conserved quantity. In many biological processes with constant tem-peratures, energy conservation equations would be omitted from the math solutions. The conservation equation of mass and momentum balance is called Navier-Stokes and would be expressed as below in Cartesian coordinates:
uΦ ∙ J S (2)
ρ ρ u ∙ u ∙ pI τ ρg Feq. (3)
In these equations, ρ is fluid density, u is the fluid velocity,
p is the pressure, τ is the shear stress tensor and g is
gravitational constant. In turbulent flow, the fluid flow is relative to eddy transportation as well as boundary conditions and main geometry of the system. In turbulent flow, the fluid properties would change accidentally. In this study it is essential to consider turbulent flow and its relative equations for the mentioned bioreactor, because there is an agitator continually working and maintaining the culture flow in a turbulent condition.
The averaged Reynolds method is used in this study to analyze turbulent flow. In this method the Navier-Stokes equations would be averaged based on the time factor and then will be solved in the software. In averaged Reynolds method, parameters would be divided into two swinging and averaged forms [21]. The Navier-Stokes equations for incompressible Newtonian fluids are expressed as below:
ρ ∙ u 0 (4)
ρ ρ u ∙ u ∙ pI μ u u ρg F (5)
As mentioned above, the averaged Reynolds method would divide the turbulent flow parameters into swinging and averaged parts:
ϕ ϕ ϕ (6)
The averaged parameters still are dependent on time because the averaging method uses short time frames to
Journal of Applied Biotechnology Reports, Volume 3, Issue 2, Spring 2016 177 make average results. Navier-Stokesequations with
insert-ed averaginsert-ed Reynolds method would be:
ρ ρ U ∙ U ∙ ρu u ∙ pI μ U
U ρg F (7)
The only difference between eq. (7) and main
Navier-Stokes equation is Reynolds Shear tensor term" ∙
ρu u " . This term explains the interactions between
swinging parts of the velocity vector. If turbulence is considered as a natural phenomenon with diffusion ability, Reynolds Shear Tensor can be defined as below:
ρ u u ρk μ U U (8)
In this equation "k" is kinetic energy and µT is the eddy viscosity. This viscosity, besides, is highly related to turbulent flow parameters like the velocity field.
In this study, the two-equation k-ε linear model provided by Launder and Spalding [22] was used to explain the relativity between eddy viscosity and other measurable quantities of the fluid flow. Based on this model, there will be two other transport equations added to the fluid flow model including turbulent flow kinematic energy "k" and turbulent loss rate "ε":
ρ ρU ∙ k ∙ μ μσ k P ρε (9)
ρ ρ U ∙ ε ∙ μ ε C P C ρ (10)
Constants in k-ε model are presented in Table 1 [23].
Table 1. Constants in k-ε model. Constant
⋅ 1 ⋅ 0 1 ⋅ 92 1 ⋅ 44
0 ⋅ 09
Value
When there are solid particles suspended in turbulent flow, drag and buoyancy forces would be added to the fluid transfer equations because of the interaction between the particles and the continuous phase of the culture. Then the turbulent flow momentum transport equation for the whole culture would be expressed as [24-25]:
ρ ρ U ∙ U ∙ pI μ μ U U ∙
ρc 1 c U U ρg
Feq. (11)
C (dispersed phase mass fraction), ϕ (dispersed phase
volume fraction), and U are calculated by the main
definition of their own, which have been explained in Table 2. The 2-phase flow viscosity is defined by this equation [23]:
μ μ 1 ∙ (12)
In this study,ϕ is considered 0.63 [29]. This term
ex-plains the solids volume fraction named as packed ratio.
D (turbulent flow coefficient of dispersion) would be
defined as:
D (13)
Also, Schmidt Number -σ - is assumed to be 0.35 [23].
In case of simulating a moving coordinate system, the impeller rotation, fictitious Coriolis, and centrifugal forces would impact two-phase flow. These forces have to be added to the momentum conservation equations as a new term F in the following form:
F 2ρΩ U ρΩ Ω r (14)
In this relation, Ω is angular velocity and r is locus vector.
This relation indicates Coriolis and eccentricity forces. With this addition, the momentum conservation equation in the mixture would be:
ρ ρ U ∙ U ∙ pI μ μ U U ∙
ρc 1 c U U ρg
2ρΩ U ρΩ Ω r (15)
With the same method, the momentum conservation equation for the solid phase would be defined as:
ρ ρ U U ρ ρ ρ U ∙ U ρg
2ρ ϕ Ω U ρ ϕ Ω Ω r(16)
Flow properties, initial, and boundary conditions
In this study, simulation will be based on two-phase fluid flow for water as continues phase and Pro-Nectin-F (SoloHill) as the micro carrier and dispersed phase. Densi-ty and viscosiDensi-ty for continues phase would be 993.3 (kg/m3) and 0.00697 (pa.s), Micro carriers' particles prop-erties would be set as spherical balls with 169 µm diameter
and density of 1026 (kg/m3) [29].
Required initial condition of this study are based on
exper-imental method provided by Schirmaier et al., [29], in
culture of stem cells on the surface of ProNectin-F (Solo-Hill) micro carriers for 2 liter operational volumes at temperature of 37 degrees centigrade. Based on the reports provided by these researchers [29], initially the stem cells and 10 g of micro carriers with the provided surface of 3600 to 7200 cm2 are added to 0.7 liter of culture mixture. After 4 hours for cells attachment to the micro carriers and their sedimentation, the culture was increased to 2 liters by adding continues phase. Then the agitation process was started under four speeds of the impeller, 60-100-125 and 140 rounds per minute (rpm).
Journal of Applied Biotechnology Reports, Volume 3, Issue 2, Spring 2016 177 Table 2. Corrections that are used for calculation of Cd,ϕ and U .
Topic Correlations
Mixture mass cons. Eq
ρ ρ ∙ ϕ 1 c U D ϕ ρ ∙ U 0
Mixture momentum cons. Eq
ρ∂U
∂t ρ U ∙ U ∙ pI μ μ U U ∙ ρc 1 c U
D
1 c
ϕ
ϕ U
D
1 c
ϕ
ϕ ρg 2ρΩ U ρΩ Ω
r
Dispersed phase mass cons. Eq.
∂ ϕ
∂t ∙ ϕ U 0
Dispersed phase momentum Cons. Eq.
3
4ρ
C
d ρ U U ρ ρ ρ U ∙ U ρg 2ρ ϕ Ω U ρ ϕ Ω Ω r
Drag coefficient on solid particles
C
24
Re 1 0 ∙ 15Re ∙ Re 1000
0 ∙ 44 Re 1000
Suspended solid particles reynolds nu.
Re d ρ U
μ
Velocity relation between 2 phase
U U U D
1 c ϕ ϕ
Solid particles mass fraction
c ϕ ρ
ρ
In the primary condition all of the mixture is at static mode, therefore the initial condition for continuous and dispersed phase velocity has been chosen as zero. The initial condition of solid particles volume fractions, as mentioned before, would be the packed volume fraction and is chosen 0.63, which is correct because the particles at the primary time of the process are sediments and packed. 10 g of micro carriers and their volume fraction would give us the total volume occupied in the bioreactor, which is equal to 0.0155 liters. The primary process pres-sure for simulation was assumed to be 1 atm.On the all wall surfaces of the bioreactor the relative velocity is considered to be zero. On the upper surface of the bioreac-tor symmetry conditions have been established, which indicates the zero velocity in vertical position of this surface [4, 26, 28].
Results and Discussion
Fluid flow pattern
Figure 1 shows the two-phase fluid flow pattern generated by simulation of the 2 liter bioreactor with 150 rpm agitator in clockwise and counter-clockwise mode. Unexpectedly, clockwise circulation of the agitator makes no remarkable axial flow, but as shown in the figure, the radial flow is large. Clockwise circulation of the agitator according to the blades steps makes an upward flow with the approximate angle of 26 degrees with respect to the horizontal axis. This flow would hit the walls in z/h of 0.4 and produces two vortices with opposite direction of rota-tion, one in the upper section and the other in the bottom of the impellers on both side of the bioreactor. Impeller velocity (rpm) Max Shear stress value (Pa) Mean Value of sh. stress (Pa)
30 0.03 0.0009
60 0.08 0.0021
90 0.18 0.0037
120 0.21 0.0043
150 0.24 0.0050
Table 3. Shear stress values vs impeller velocity.
178 Journal of Applied Biotechnology Reports, Volume 3, Issue 2, spring 2016 The maximum velocity of the 2 phase flow takes place
near the impeller tips at around 0.597 m/s which is very close to the theoretical value (Umax = πNRdR) for the mentioned agitator with 150 rpm, reported as 0.6 m/s. The velocity of the bottom section of the bioreactor is between 0.1 and 0.38 m/s and is very close to the calculated values
by Kaiser et al., [17] (0.1 and 0.4) and the ones reported by
Gabriele et al., [27] and Plein et al., (0.25 and 0.55,
respectively) [28].
In the upper part of the bioreactor the velocity is much lower than the bottom part, considered as a poor condition which continues to reduce by enlarging the bioreactor. Better axial flow was obtained by counter-clockwise rota-tion of the agitator. This also led to higher velocity in the upper part of the reactor about 0.1 to 0.3 m/s. Flow is directed to the bottom of the reactor by the impeller and hits the bottom in the radial distance r/R of 0.65, then it goes upward in the reactornear the walls. The maximum velocity in this pattern is 0.595 m/s and is very close to clockwise rotation and theoretical value. Therefore, the fluid flow pattern in counter-clock wise rotation is much homogenous compared to clockwise rotation of the impel-ler. This homogenous condition helps better distribution of nutrients and better mass transfer in the fluid which ultimately improves cultures conditions. Furthermore, in case of aeration from the bottom of the vessel, downward fluid movement helps the oxygen retention time [17].
Shear Stress
Different cells react with shear stress according to their physical status. In this research, investigation of shear stress impact on stem cells was evaluated based on the
results reported by Kaiser et al., [26]. They reported that
these stem cells can tolerate maximum shear stresses of 0.2 Pa and mean volumetric value of 0.004 Pa. Figure 2 illus-trates the shear stress profile in the bioreactor with 150 rpm counter-clockwise rotation. Based on this figure the higher shear stresses take place near the impeller in which the fluid has the higher speed value, the impact point of the fluid flow and the bioreactor walls and near the baffles. In the upper part of the reactor the lower shear stress can be observed as a result of lower impact of the impeller on the velocity value. With the mentioned impeller velocity, the maximum value of shear stress reaches 0.24 Pa which is
higher than the reported value by the Kaiser et al., [26].
However, the high shear stress takes place in a few points of the bioreactor (lower than 0.1 volume percent). The mean volumetric value of this parameter is 0.005 Pa which is also higher than the reported value by Kaiser et al [26]. Therefore; stem cells culture under this circumstance would harm their physical shape and is not possible. Table 3 illustrates the maximum and mean value of shear stress and impeller velocity. Based on the data represented in this table, for impeller velocities fewer than 90 rpm, the shear
stress values are lower than the ones reported by Kaiser et
al., [26] and stem cells will not be damaged by the velocity
of the impeller.
Micro carrier particles distribution
In this case two parameters should be defined: Ns90, which describes a velocity of the impeller causing the first particles to climb 90 percent of the fluid, and Ns1, which is the needed impeller velocity to suspend all of the particles in the bioreactor [26]. In Ns1 velocity, none of the particles has zero velocity and solid-liquid forces are greater than the particle weight. Nevertheless, this parame-ter does not describe the perfect distribution of the particles but shows a good condition of suspending particles, low gradient of nutrients and better mass trans-fer. With trial and error method and many simulations of 2-phase fluid flow of the bioreactor, it has been found out
Figure 2. The shear stress profile for impeller 150 rmp velocity.
Figure 1. The two-phase fluid flow pattern generated by simulation of the 2 liter bioreactor with 150 rpm agitator in clockwise and counter-clockwise mode.
Shear Stress (Pa)
Clockwise
Counter Clockwise
Journal of Applied Biotechnology Reports, Volume 3, Issue 2, Spring 2016 177 that the needed impeller velocity for the first particle to
climb 90 percent of the bioreactor height is 7 rpm. In this condition after 140 second and 14 rounds of the impeller, the distribution would reach a steady-like state. Although, this speed moved some of the particles to the top of the reactor, still lots of particles remained at the bottom of the bioreactor and did not move. The volumetric percent of the particles in the bioreactor varies in this case; therefore, the fluid would not be homogenous. Although, this rate of the impeller produces low shear rate, however, it cannot dis-tribute the solid particles in thefluid. The Ns1 is calculated 30 rpm; the particle distribution with this velocity is shown in figure 3. It is obvious that all of the particles are moving in this velocity but still do not reach an apparent distribu-tion and at the bottom of the bioreactor, the particles are moving as slowly as possible.
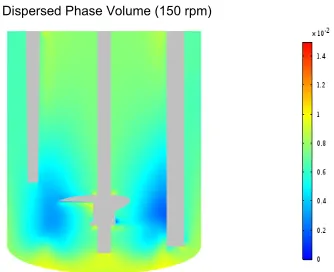
Based on the results, 30 rpm would be the minimum velocity in which the particles move with minimum shear stress, and a good mass transfer is predicted. Increasing the speed of the impeller helps particle distribution in the fluid. However, after passing a specific speed, the distribu-tion remains unchanged. In trial and error method by using simulations of different impeller speeds, 60 rpm is selected as a speed after which the distribution remains untouched. Figures 4 and 5 show the particles distribution of 60 and 150 rpm, in 60 rpm the distribution became steady after 60 seconds and 60 rounds of impeller while for 150 rpm the steady distribution was achieved after 20 seconds and 50
rounds of impeller the distribution became steady. As il-lustrated in the figures, the distribution is uniform although the shape is different near the impeller tips due to the effect of the impeller on solid particles. Small difference between 60 and 150 rpm speed solid distribution profiles shows that 60 rpm is enough for good dispersion, high mass transfer and low shear stress.Therefore, the solid dis-persion survey reports that 30 rpm is the least speed which can suspend the solids and 60 rpm would be the enough for good dispersion.
This study focused on the investigation of the best operational conditions of steady state stem cells culture bioreactor by simulating the equipment. Results from computational simulation compared with the experimental
work which has been done by Kaiser et al., [26] and the
consistency of both works was obvious. Therefore the simulation can cheaply present different solutions for different parameters of an experiment instead of further experiments.The 60 rpm impeller speed can produce best solid particle distribution and low shear stress to the solid particles, the mass transfer is predicted to be good in this condition.
Conclusion
This study has been performed in order to find the best operation condition of Mobius CellReady 3L bioreactor using micro carriers for stem cells growth. The simulation results were used to investigate the shear stress on the cell structures. This indicated that the maximum velocity which has no destruction impact on stem cells body is 90 rpm counter-clockwise.
Furthermore, the results from analyzing the micro-carriers’ dispersion through the culture mixture used for optimized mass transfer rate identification. Given from the results, the minimum velocity for the particles to flow through the mixture was 30 rpm and the optimized speed indicated to be 60 rpm. The mathematical modeling helped the simula-tion to be approximately near actual experimental data and then to produce valuable results for other operation condi-tions as well.
Acknowledgments
We are hereby thankful for great contributes of Chemical Engineering Faculty of Nooshirvani University of Technology.
Figure 3. 30 rpm impeller speed, particles distribution.
Figure 4. The solid dispersion in 60 rpm.
Figure 5. Solid dispersion in 150 rmp.
Dispersed Phase Volume (30 rpm)
Dispersed Phase Volume (60 rpm)
Dispersed Phase Volume (150 rpm)
178 Journal of Applied Biotechnology Reports, Volume 3, Issue 2, spring 2016 References
1. Chase, L.G., Vemuri, M.C., Mesenchymal Stem Cell Therapy. Springer Science & Business Media, 2012.
2. Nienowa, A.W., Rafiqa, Q.A.K., Hewitta, C.J., A potentially scalable method for the harvesting of hMSCs from. Biochem Eng J, 2014, Vol. 85, pp. 79-88.
3. Chen, A.K.L., Reuveny, S., Oh, S.K.W., Application of human mesenchymal and pluripotent stem cell microcarrier cultures in cellular therapy: Achievements and future direction. Biotechnol Adv, 2013, Vol. 31, pp. 1032-1046.
4. Elseberg,C. L., Leber, J., Salzig, D.,Wallrapp, C., Kassem, M., Kraume, M., Czermak, P., Microcarrier-based expansion process for hMSCs with high vitality and undifferentiated characteristics. Int J Artif Organs, 2012, Vol. 35, pp. 93-107.
5. Ferrari, C., Balandras, F., Guedon, E., Olmos, E., Chevalot, I., Marc, A., Limiting cell aggregation during mesenchymal stem cell expansion on microcarriers. Biotechnol Prog, 2012, Vol. 28, pp. 780-787.
6. Wu, J., Rostami, M.R., Olaya, D.P.C., Tzanakakis, E.S., Oxygen transport and stem cell aggregation in stirred-suspension bioreactor cultures. PLoS One, 2014, Vol. 9, pp. e102486. 7. Jossen, V., Pörtner, R., Kaiser, S.C., Kraume, M., Eibl, D., Eibl, R., Mass production of mesenchymal stem cells impact of bioreactor design and flow conditions on proliferation and differentiation. Cells and Biomaterials in Regenerative Medicine, InTech, 2014, pp. 119-174.
8. Elaine, E.Y., Zandstra, P., Shear-controlled single-step mouse embryonic stem cell expansion and embryoid body-based differentiation. Stem Cells, 2005, Vol. 23, pp. 1333-1342. 9. Tia, G., Lara, G.G., Shepherd, R.D., Krawetz, R., Rancourt, D.E., Rinker, K.D., Kallos, M.S., Shear stress influences the pluripotency of murine embryonic stem cells in stirred suspension bioreactors. J Tissue Engi Regen Med, 2012, Vol. 8, pp. 268-278.
10. Nsiah, B.A., Ahsan,T., Sarah Griffiths, M.C., Nerem, R. M., McDevitt, T. C., Fluid shear stress pre-conditioning promotes endothelial morphogenesis of embryonic stem cells within embryoid bodies. Tissue Eng PartA 20, 2014, Vol. 20, pp. 954-965.
11. Croughan, M.S., Hamel, J.F., Wang, D.I., Hydrodynamic effects on animal cells grown in microcarrier cultures. Biotechnol Bioeng, 2006, Vol. 95, pp. 295-305.
12. Ponnuru, K., Wu, J., Ashok, P., Tzanakakis, E.S., Furlani, E. P., Analysis of stem cell culture performance in a microcarrier bioreactor system. In proceeding of International NSTI Nanotech Conference, 2014.
13. Kaiser, S.C., Löffelholz, C., Eibl, D., Werner,S., CFD for characterizing standard and single-use stirred cell culture bioreactors. Intech Open Access Publisher, 2011.
14. Eibl, R., Kaiser, S., Lombriser, R., Eibl, D., Disposable bioreactors: the current state of the art and recommended applications in biotechnology. Appl Microbiol Biotechnol, 2010, Vol. 86, pp. 41-49.
15. Liu, N., Zang, R., Yang, S., Li, Y., Stem cell engineering in bioreactors for large‐scale bioprocessing. Eng Life Sci, 2014. Vol. 14, pp. 4-15.
16. Löffelholz, C., Husemann, U., Greller, G., Meusel, W., Kauling, J., Ay, P., Kraume, M., Eibl, R., Eibl, D., Bioengineering parameters for single‐use bioreactors: overview and evaluation of suitable methods. Chem Ing Tech, 2013, Vol. 85, pp. 40-56.
17. Kaiser, S.C., Eibl, R., Eibl, D., Engineering characteristics of a single‐use stirred bioreactor at bench‐scale: The Mobius CellReady 3L bioreactor as a case study. Eng Life Sci, 2011, Vol. 11, pp. 359-368.
18. Jing, D., Sunil, N., Punreddy, S., Aysola, M., Kehoe, D., Murrel, J., Rook, M., Niss, K., Growth kinetics of human mesenchymal stem cells in a 3-L single use, stirred-tank bioreactor. Bio Pharm Int, 2013, Vol. 26, pp. 28-38.
19. Kehoe, D., Schnitzler, A., Simler, J., DiLeo, A., Ball, A., Scale-up of human mesenchymal stem cells on microcarriers in suspension in a single use bioreactor. Bio Pharm Int, 2012, Vol. 25, pp. 28-38.
20. Mobius3L Bioreactor Specifications," Millipore, EMD, 2010. [Online]. Available:
https://www.emdmillipore.com/CA/en/product/Mobius-3L-Single-use-Bioreactor,MM_NFC84539?bd=1#documentation. [Accessed 4 12 2015].
21. "CFD Online," [Online]. Available: http://www.cfd-online.com/Wiki/Turbulence_modeling. [Accessed 5 12 2015]. 22. Launder, B.E., Spalding, D.B., The numerical computation of turbulent flows. Comput Methods Appl Mech Eng, 1974, Vol. 3, pp. 269-289.
23. CFD Module User’s Guide, Comsol Multiphysics v5.1, 2015. 24. Crowe, C.T., Schwarzkop, f.J.D., Sommerfeld, M., Tsuji,Y., Multiphase flows with droplets and particles, CRC Press, 2011. 25. Manninen,M., Taivassalo, Kallio,V. S., On the mixture model for multiphase flow, VTT Publications, 1996.
26. Kaiser, S., Jossen,V., Schirmaier,C., Eibl, D., Brill, S., Bos, C.V.D., Eibl, R., Fluid flow and cell proliferation of mesenchymal adiposederived stem cells in small‐scale, stirred, singleuse bioreactors. Chem Ing Tech, 2013, Vol. 85, pp. 95-102. 27. Gabriele, A., Nienow, A.W., Simmons, M.J.H., Use of angle resolved PIV to estimate local specific energy dissipation rates for up-and down-pumping pitched blade agitators in a stirred tank. Chem Eng Sci, 2009, Vol. 64, pp. 126-143.
28. Costes, P.P.J., Couderc, J.P., Study by laser Doppler anemometry of the flow induced by a propeller in a stirred tank - Influence of baffles. in 5th European Conference on Mixing, Wurzburg, 1985.
29. Schirmaier, C., Jossen, V., Kaiser, S.C., Jüngerkes, F., Brill, S., Safavi‐Nab, A., Siehoff, A., Bos, C., Eibl, D., Eibl, R., Scale‐up of adipose tissue derived mesenchymal stem cell production in stirred single‐use bioreactors under low serum conditions. Eng Life Sci, 2014, Vol. 14, pp. 292-303.
hhhhhhhhhhhhhhhhhhhhhhhhhhhhhhhhhhhhhhhhhhhhhhh hhhhhhhhhhhhhhhhhhhhhhhhhhhhhhhhhhhhhhhhhhhhhhh hhhhhhhhhhhhhhhhhhhhhhhhhhhhhhhhhhhhhhhhhhhhhhh hhhhhhhhhhhhhhhhhhhhhhhhhhhhhhhhhhhhhhhhhhhhhhh hhhhhhhhhhhhhhhhhhhhhhhhhhhhhhhhhhhhhhhhhhhhhhh hhhhhhhhhhhhhhhhhhhhhhhhhhhhhhhhhhhhhhhhhhhhhhh hhhhhhhhhhhhhhhhhhhhhhhhhhhhhhhhhhhhhhhhhhhhhhh hhhhhhhhhhhhhhhhhhhhhhhhhhhhhhhhhhhhhhhhhhhhhhh hhhhhhhhhhhhhhhhhhhhhhhhhhhhhhhhhhhhhhhhhhhhhhh hhhhhhhhhhhhhhhhhhhhhhhhhhhhhhhhhhhhhhhhhhhhhhh hhhhhhhhhhhhhhhhhhhhhhhhhhhhhhhhhhhhhhhhhhhhhhh hhhhhhhhhhhhhhhhhhhhhhhhhhhhhhhhhhhhhhhhhhhhhhh hhhhhhhhhhhhhhhhhhhhhhhhhhhhhhhhhhhhhhhhhhhhhhh hhhhhhhhhhhhhhhhhhhhhhhhhhhhhhhhhhhhhhhhhhhhhhh hhhhhhhhhhhhhhhhhhhhhhhhhhhhhhhhhhhhhhhhhhhhhhh hhhhhhhhhhhhhhhhhhhhhhhhhhhhhhhhhhhhhhhhhhhhhhh hhhhhhhhhhhhhhhhhhhhhhhhhhhhhhhhhhhhhhhhhhhhhhh hhhhhhhhhhhhhhhhhhhhhhhhhhhhhhhhhhhhhhhhhhhhhhh hhhhhhhhhhhhhhhhhhhhhhhhhhhhhhhhhhhhhhhhhhhhhhh hhhhhhhhhhhhhhhhhhhhhhhhhhhhhhhhhhhhhhhhhhhhhhh