Advanced Database Concepts
Using Microsoft Access
l a b
10
199
Objectives:
Upon successful completion of Lab 10, you will be able to
● Understand database terminology, including database, table, record, field, and field name
● Understand data integrity issues and the importance of storing only one copy of data items
● Create a query using the Design view and multiple tables ● Create a query using multiple criteria
● Add tables to a query
● Create a relationship between tables in a query ● Generate a report from a query
Resources required:
● A computer running Access 2007
Starter file:
● academic_records.accdb
Prerequisite skills:
● General keyboarding skills
● Ability to find files using Windows Explorer or Windows search feature ● Ability to open and save a file in a Windows application
● Basic Access editing skills, including adding, deleting, and editing records and creating a table in design view
NRC’s Top Ten Skills, Concepts, and Capabilities:
● Skills
Use a database to access information
• Use Access to find information stored in tables • Create relationships, queries, and reports ● Concepts
● Capabilities
Manage complexity
Think abstractly about Information Technology Navigate a collection
Lab Lesson
Each day we find ourselves using lists of information. Sometimes the lists are small, such as a list of things to do today, a grocery list, or a list of songs on a CD. Sometimes the lists are larger, such as a list of friends or business associates, products in a catalog, or a telephone directory.
As we work with lists we find that we need to find information, create smaller lists from the larger lists based on some criteria, and update information.
Database Terminology
Database software, such as Access, is designed to be able to manage large lists with millions of entries. Lists are organized as tables of information. A database can consist of a single table, or many tables of information. A sample of a table of information is shown in Figure 10.1.
Figure 10.1 Access table showing student data.
As shown in Figure 10.1, a row of data is called a Record. Data items in a row all refer to the same entity. In Figure 10.1, a record contains data pertaining to a student. A column of data is called a Fieldand is identified by the Field Name heading. A field contains the same type of data. For instance, in Figure 10.1 the Last Name is a field containing text data, the Birthdate field contains date/time data, and the Math field contains numeric data.
A database can contain many tables. The table in Figure 10.1 contains student grade records for three courses: CS1, Math, and Psychology. The database can also contain another table of student contact information, another table with faculty information, another table with course
information, and so forth.
using a query. A query can establish relationships between tables and can result in lists of data that combine fields from many tables.
This lab will focus on creating queries, relationships, and reports for a database containing some simple tables. It is assumed that the student completing this lab is comfortable with Access tables and has an understanding of table structure, editing records data, and data types.
Data Integrity
One of the things we have to be wary of is duplicating data in many tables. For instance, there may be separate tables for the students’ personal information and for grades. If there are multiple copies of data the danger is that when there is a change, one or more of the copies might be missed and thus some data will be inaccurate. Let’s look at how this situation might be avoided with a unique identifier for each record.
Open Access 2007.
Open the academic_records.accdb database file.
There are three tables in this database: Faculty, Grades, and Student Personal. Let’s look at the tables and see how they fit together.
Double-click the Faculty table name to open it, as shown in Figure 10.2.
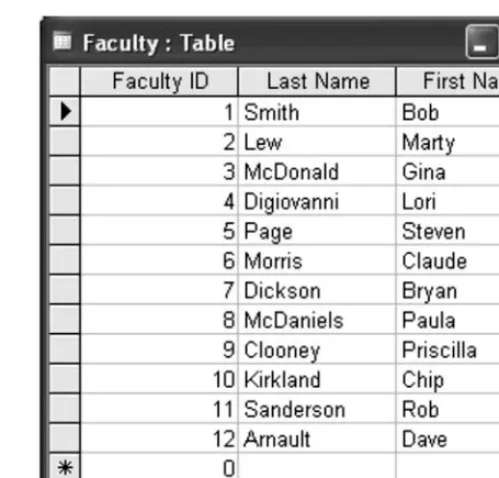
The Faculty table will appear, as shown in Figure 10.3.
Figure 10.2 Access 2003 Tables window.
The Faculty table contains a Faculty ID, Last Name, and First Name, as shown in Figure 10.3.
Figure 10.3 Faculty table in the academic_records.accdb database.
The Faculty ID is a unique identifier. Let’s look at the structure of the table.
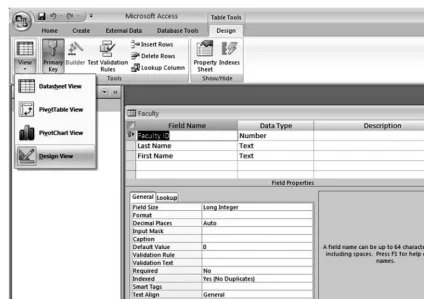
Click the drop-down arrow for the Viewbutton, as shown in Figure 10.4. Click the Design Viewoption as shown in Figure 10.4.
Figure 10.4 Access Faculty table with Design View.
Primary Key
Notice the key symbol to the left of the Faculty ID field name. This indicates that the Faculty ID is a Primary Key field. A Primary Key field contains unique identifiers for each record and Access will not allow duplicate primary keys. If the user tries to enter a Primary Key value that is already being used, Access will display an error message and require the user to enter another value.
Close the Faculty table.
Let’s open the other two tables and look at the structure of the data in them.
Double-click the Student Personal table name in the academic_records tables window, as shown in Figure 10.2.
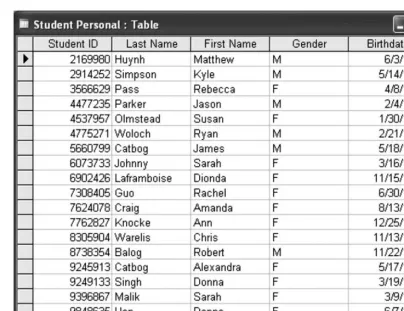
The Student Personal table will open in Datasheet View, as shown in Figure 10.5.
Figure 10.5 Access Student Personal table with Datasheet View.
The Student ID field in the Student Personal table is a Primary Key field. You can confirm this by looking at the structure in Design Viewif you wish.
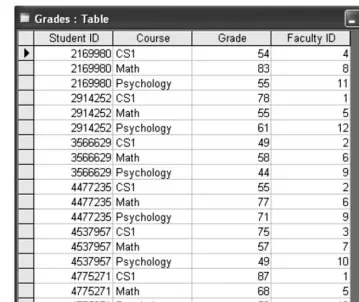
Double-click the Grades table name in the academic_records tables window, as shown in Figure 10.2.
Figure 10.6 Access Grades table with Design view.
Notice that the Grades table does not contain student names or faculty names. Instead, it contains Student ID and Faculty ID fields. Also, there is one record for each course grade. If we were to create a table that contained a separate field for each grade, how many fields would we need? For this table, there are three course grades (CS1, Math, and Psychology), but what if another course was added? We would need to add a field for each new course, and this quickly becomes a bad idea. Although there will be many records, if each record contains only one course grade, it’s manageable, and expandable. We can add more courses by adding more records, which is easy. Although fields can be added easily, you can imagine a scenario where there could be hundreds of courses, and yet a student would have grades for only a few of them.
Placing the Faculty and Student data in separate tables allows us to change information about the individual faculty or student without having to change that information again in the Grades table. Imagine that the Grades table also included the first and last names of the students and faculty. Scrolling through the table you can see that there are many instances of the same Student ID and Faculty ID. If a faculty member changed his or her last name, you would have to make that change in the Faculty table and in the Grades table for every instance of the Faculty ID. By placing the personal data in a separate table and assigning a unique key, we can “look up” the personal information and join it to the Grades table.
Creating a Query
Let’s create a list that contains the Student IDs, students’ first and last names, courses, and grades. We will expand on this to add faculty names later. We will use a query to create these tables.
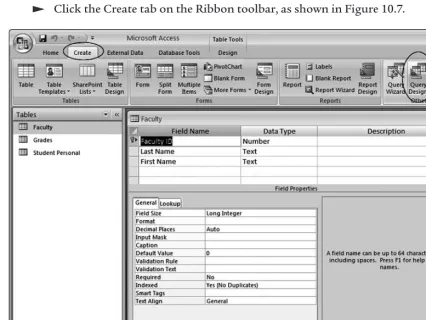
Close the Faculty table, the Grades table, and the Student Personal table. Click the Create tab on the Ribbon toolbar, as shown in Figure 10.7.
Figure 10.7 Access Queries object in academic_records.accdb.
We are going to create a query using Design view so that we can see the relationships between tables.
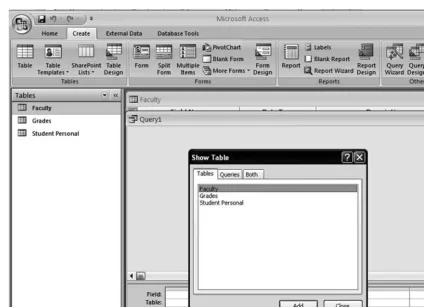
Click the Query Designbutton as shown in Figure 10.7.
Figure 10.8 Access Query window and Show Tables dialog box.
For the query we are creating, we will need to use only the Grades and Student Personal tables.
Click the Grades table name to select it.
Click the Addbutton to add the Grades table to the Querywindow. Click the Student Personal table name to select it.
Click the Addbutton to add the Student Personal table to the Query
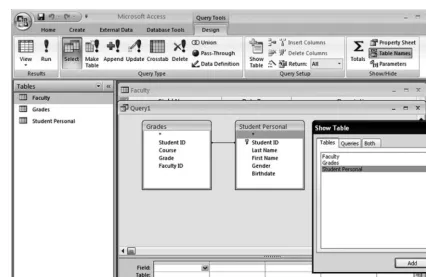
window, as shown in Figure 10.9.
Figure 10.9 Access Query window with all tables added.
Notice the line that has been drawn between the Grades and Student Personal tables. This line indicates that there is a relationship between these tables. A relationship joins two tables on a common field. In this case, the tables are joined on the Student ID field. The Student ID field is a Primary Key in the Student Personal table but is not a Primary Key in the Grades table. The Grades table will contain multiple records with the same Student ID because a student will complete more than one course.
Let’s create a query that will generate records containing Student ID, Last Name, First Name, Course, and Grade fields. These fields are found in the two tables. We will need to select each of these fields required for the query.
Click the Closebutton on the Show Tabledialog box to close it.
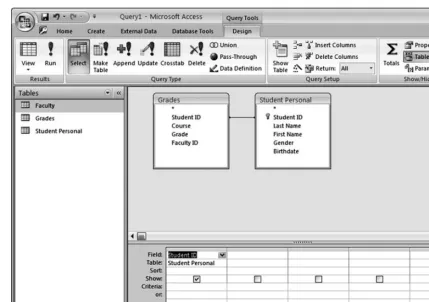
In the Student Personalwindow, double click the Student ID field name.
Figure 10.10 Access Query window with Student ID included.
If we were to run this simple Query now, it would result in a list of the entire Student IDs that are common in the two tables. Since the Grades table contains multiple instances of the Student IDs, the resulting table will also have multiple instances of the Student IDs.
Let’s add more fields to the query.
In the Student Personal window, double-click the Last Name field name to add it to the query. The additional fields are shown in Figure 10.11.
In the Student Personal window, double-click the First Name field name to add it to the query.
In the Grades window, double-click the Course field name to add it to the query.
In the Grades window, double-click the Grade field name to add it to the query.
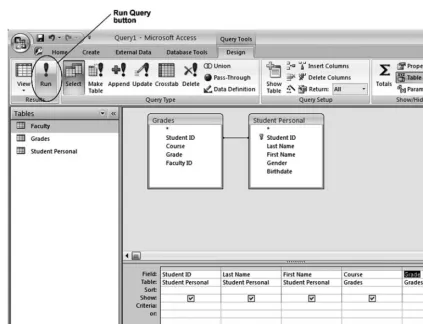
Figure 10.11 Access Query window showing Student ID, Last Name, First Name, Course, and Grade fields.
Now that we’ve added the fields to the query, we can run the query to display the results in a table. The records that satisfy the query are all records that have the Student ID common in both tables.
Click the Run Querybutton, as shown in Figure 10.11.
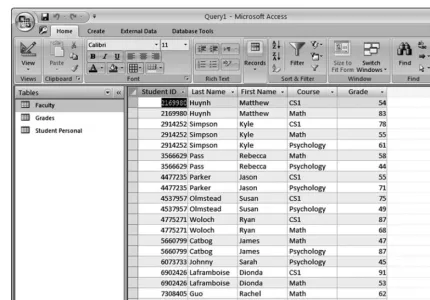
Figure 10.12 Access grades query results.
Criteria in a Query
Let’s add some criteria to this query. Let’s find all records for which the Grade is greater or equal to 90.
Click the Viewdrop-down button and select the Design View, as shown in Figure 10.13.
Figure 10.13 Access view button indicating Design view.
Figure 10.14 Access query on the Grades field for >=90.
Click the Run Querybutton to display the results of the query, as shown in Figure 10.15.
Figure 10.15 Access query results for Grade >= 90.
Notice that each number in the Grade field is greater than or equal to 90. Feel free to scroll through the list to verify this. In the previous query there were 488 records in the results, and in this query there are only 55 records in the results.
Let’s add some criteria from another field. Let’s find only the records for which the Grade is greater than or equal to 90 and the Course is Math.
Click the Viewdrop-down button and select the Design Viewas previously shown in Figure 10.13.
Click in the Criteriainput box for the Course field and type: Math, as shown in Figure 10.16.
Access will automatically put double-quotes around “Math” and you may notice this when you are looking at the criteria grid later.
Figure 10.16 Access query for Grade >=90 and Course = Math.
Click the Run Querybutton to display the results of the query, as shown in Figure 10.17.
Now there are only 13 records that satisfy the criteria where the Course is Math and the Grade is greater than or equal to 90.
We can also add more criteria to a single field. Let’s find the records for which the Math Grade is greater than or equal to 80 but less than 90. In this case we will need to use AND criteria where the Math Grade is greater than or equal to 80 AND less than 90.
Click the Viewdrop-down button and select the Design View.
Click in the criteria cell for the Grade field and edit the cell as: >=80 And <90, as shown in Figure 10.18.
Figure 10.18 Access query for Course = Math and Grades >=80 And <90.
Click the Run Querybutton to display the results of the query, as shown in Figure 10.19.
Figure 10.19 Access query results for for Course = Math and Grades >=80 And <90.
As we have seen, records must satisfy all criteria along a row in the criteria grid in order to be included in the results. If there is criteria on separate rows in the criteria grid, this becomes an OR search. In this case, records must satisfy either the criteria on one row or the criteria on the next row. Let’s change our criteria to find all records for which the Course is either Math or CS1.
Click the Viewdrop-down button and select the Design View.
Click the criteria cell for the Grade and delete the grade criteria, as shown in Figure 10.20.
Click the criteria cell below the Course criteria cell containing “Math” and type: CS1, as shown in Figure 10.20.
Click the Run Querybutton to display the results of the query, as shown in Figure 10.21.
Figure 10.21 Access query results for Course = Math or Course = CS1.
Scroll through the query results to verify that the records contain only “CS1” or “Math” in the Course field.
Database Relationships
Now, let’s add the Faculty name to the table. In order to do this we will have to add the Faculty table to the query.
Click the Viewdrop-down button and select the Design View.
Click the Show Tablebutton. The Show Table window will appear, as shown in Figure 10.22.
Click the Faculty table in the Show Tabledialog box to select it.
Click the Addbutton in the Show Tabledialog box to add this table to the Query, as shown in Figure 10.22.
Figure 10.22 Access query adding Faculty table.
Click the Closebutton on the Show Table window to close the Show Table window.
We will need to define a relationship, joining the Faculty ID fields from the Grades table and the Faculty table. It’s a bit easier to see when the tables are aligned a bit differently.
Drag the Grades and Student Personal tables to the right to make some room for the Faculty table on the left, as shown in Figure 10.23.
As you drag the tables, the line between the Grades and Student Personal table will “stick” to the tables, preserving the relationship between the Student ID fields.
Figure 10.23 Access query with Faculty table.
The Faculty ID field in the Faculty table is a Primary Key. There is only one instance of each Faculty ID in the Faculty table. The Faculty ID field in the Grades table is not a Primary Key. There are multiple instances of Faculty IDs in the Grades table because a faculty member has many students and issues many grades. We have the same situation with the Student ID fields in the Student Personal and Grades tables. In the Student Personal and Grades tables, the
relationship between the Student ID fields was automatically detected. The relationship of the Faculty ID fields has not been detected and we must establish it manually.
Drag the Faculty ID field name from the Faculty table and drop it onto the Faculty ID field name in the Grades table, as shown in Figure 10.24.
Figure 10.24 Access query with Faculty table, dragging the Faculty ID field.
After you’ve completed dragging the Faculty ID field name, you should notice the relationship line between the Faculty ID fields as shown in Figure 10.25. Figure 10.25 also shows the additional fields from the Faculty table that we will be including in the next query.
Double-click the Last Name field in the Faculty table to add this field to the criteria grid, as shown in Figure 10.25.
Double-click the First Name field in the Faculty table to add this field to the criteria, as shown in Figure 10.25.
Click the Run Querybutton to display the results of the query, as shown in Figure 10.26.
Figure 10.26 Access query results for Math and CS1 courses with Faculty fields.
You may have to increase the widths of the columns to see the field names. Since there are two Last Name fields and two First Name fields, the field names are further identified by the name of the table. For instance, Faculty:Last Name and Faculty:First Name indicate that these fields are from the Faculty table.
Let’s save this query and generate a report based on it.
Click the Savebutton to save the query. The Save Asbox will appear, as shown in Figure 10.27.
In the Save Asbox, type: Math and CS1, as shown in Figure 10.27.
Figure 10.27 Access query Save As box.
Click the OKbutton to save the query. Close the Querywindow.
Creating a Report
We can generate simple reports using fields in tables, or we can use a query as a basis of a report. Let’s generate a report based on the Math and CS1 query.
Click the Create tab and then click on the Report Wizardbutton, as shown in Figure 10.28.
Figure 10.28 Access create report.
In the Report Wizard window, click the drop-down menu for the
Tables/Queries and select the Math and CS1 query, as shown in Figure 10.29.
The field names used in the Math and CS1 query will be included in the Available Fieldsbox, as shown in Figure 10.30.
Click on the Select All Fieldsbutton, as shown in Figure 10.30.
Figure 10.30 Access Report Wizard with Available Fields from Math and CS1 query.
All of the field names will be placed in the Selected Fieldsbox.
Click the Next >button to advance to the next step.
We can group the results on any of the fields. Let’s group the results on the Faculty Last Name field to see the grades for each Faculty member.
Click on the Course name to select it, as shown in Figure 10.31.
Click on the Add Grouping Levelbutton to add the Faculty.Last Name field as a grouping level, as shown in Figure 10.31.
Figure 10.31 Access Report Wizard grouping dialog box.
The field name Course will be placed at the top of the grouping pane.
Click the Faculty.Last Name field name to select it.
Click on the Add Grouping Levelbutton to add the Faculty.Last Name field as a grouping level, as shown in Figure 10.31.
Click the Next >button to advance to the next step.
The next step will allow us to specify the fields to sort.
Click the drop-down arrows and specify the Student.Last name and Student.First name fields for sorting, as shown in Figure 10.32.
Figure 10.32 Access Report Wizard sorting dialog box.
Click the Next >button to advance to the next step.
We can choose the format for grouping and page setup.
If the Stepped Layoutradio button is not already selected, click the Stepped Layoutradio button, as shown in Figure 10.33.
Figure 10.33 Access Report layout dialog box.
Click the Next >button to advance to the next step.
We can choose a formatting style for the report.
Feel free to click on format style to view the possible styles, as shown in Figure 10.34.
Click on the Concoursestyle to select it, as shown in Figure 10.34.
Figure 10.34 Access report styles dialog box.
Click the Next >button to advance to the next step.
Click the Report Titlebox and edit the name as: Math and CS1, as shown in Figure 10.35.
Figure 10.35 Access report finish dialog box.
Click the Finishbutton to complete the report and preview it.
The Report Previewwindow will open, as shown in Figure 10.36. The report is multiple pages.
Click the Next Pagebutton to view the subsequent pages of the report, as shown in Figure 10.36.
Figure 10.36 Access Report Preview window.
Review
This has been a busy lab! We have covered the following topics:
● A review of database terminology including database, table, record, field, and field name
● Data integrity issues and the importance of storing only one copy of data items
● Creating a query using the Design view and multiple tables
● Using multiple criteria in a query
● Adding tables to a query
● Creating a relationship between tables
● Generating a report from a query
Exercises
Use the academic_records.accdb database and perform the following tasks.
1. Create a query using the Faculty and Grades tables only with the following results. Be sure to create the relationship between the Faculty ID fields.
a. Faculty Last Name, Faculty First Name, Student ID, Course, and Grade showing all grades less than 60. Save this query as Grades Less Than 60.
b. Course, Student ID, Faculty Last Name, and Faculty First Name showing Psychology and Math courses. Save this query as Faculty Psychology Math.
2. Create a query using the Grades and Student Personal tables with the following results. a. Student ID, Student Last Name, Student First Name, Course, and Grade showing all
grades greater than or equal to 60. Save this query as All Greater Than 60.
b. Student ID, Student Last Name, Student First Name, Course, and Grade showing all grades greater than or equal to 60 in Math only. Save this query as Greater Than 60 Math.
3. Create reports for each of the queries. Do not use grouping for the reports.