R E S E A R C H A R T I C L E
Open Access
Effect of altering breathing frequency on
maximum voluntary ventilation in healthy
adults
Eric V. Neufeld
1, Brett A. Dolezal
1*, William Speier
2and Christopher B. Cooper
1Abstract
Background:Compared to other pulmonary function tests, there is a lack of standardization regarding how a
maximum voluntary ventilation (MVV) maneuver is performed. Specifically, little is known about the variation in breathing frequency (fR) and its potential impact on the accuracy of test results. This study examines the effect of several preselected values forfRand one self-selectedfR(fRself) on MVV.
Methods:Ten participants performed MVV maneuvers at variousfRvalues, ranging from 50 to 130 breaths·min−1 in 10 breaths·min−1intervals and at onefRself. Three identical trials with 2-min rest periods were conducted at each fR, and the sequence in whichfRwas tested was randomized. Ventilation and related parameters were measured directly by gas exchange analysis via a metabolic measurement system.
Results:A third-order polynomial regression analysis showed that MVV =−0.0001(fR)3+ 0.0258(fR)2–1.38(fR) + 96.9 at preselectedfRand increased up to approximately 100 breaths·min−1(r2= 0.982,P< 0.001). Pairedt-tests indicated that average MVV values obtained at all preselectedfRvalues, but notfRself, were significantly lower than the average maximum value across all participants. A linear regression analysis revealed that tidal volume (VT) =−2.63(MVV) + 300.4 at preselectedfR(r2= 0.846,P< 0.001); however, this inverse relationship between VTand MVV did not remain true for the self-selectedfR. The VTobtained at thisfR(90.9 ± 19.1% of maximum) was significantly greater than the VT associated with the most similar MVV value (at a preselectedfRof 100 breaths·min−1, 62.0 ± 10.4% of maximum; 95% confidence interval of difference: (17.5, 40.4%),P< 0.001).
Conclusions:This study demonstrates the shortcomings of the current lack of standardization in MVV testing
and establishes data-driven recommendations for optimal fR. The true MVV was obtained with a self-selected fR(mean ± SD: 69.9 ± 22.3 breaths·min−1) or within a preselected fRrange of 110–120 breaths·min−1. Until a comprehensive reference equation is established, it is advised that MVV be measured directly using these guidelines. If an individual is unable to perform or performs the maneuver poorly at a self-selectedfR, ventilating within a mandatedfRrange of 110–120 breaths·min−1may also be acceptable.
Keywords:Pulmonary function test, Standardization, Breathing frequency, Exercise testing, Ventilatory reserve, Maximal exercise ventilation, Forced expiratory volume in 1 s
* Correspondence:[email protected]
1Exercise Physiology Research Laboratory, Departments of Medicine and
Physiology, David Geffen School of Medicine at UCLA, 10833 Le Conte Avenue, 37-131 CHS Building, Los Angeles, CA 90095, USA
Full list of author information is available at the end of the article
Background
Formerly referred to as maximum breathing capacity, maximum voluntary ventilation (MVV) is a pulmonary function test (PFT) that measures the maximum amount of air a person can inhale and then exhale with voluntary effort. The test is measured in liters per minute (L·min−1), but data is only collected for 12–15 s and then extrapo-lated to 1 m in order avoid prolonged hyperventilation by the participant. While the test has been used less over the recent decades due to its fewer applications than the forced expiratory volume in 1 s (FEV1), MVV still pos-sesses clinical utility. Performing the maneuver is contin-gent on several factors, including respiratory system mechanics (obstructive or restrictive) and ventilatory muscle endurance. Therefore, the test provides a broad as-sessment of respiratory system function [1]. Abnormal MVV results are valuable in evaluating various neuromus-cular disorders [2–4] and predicting the risk for postoper-ative complications [1, 5]. MVV also remains useful in cardiopulmonary exercise testing as a measure of ventila-tory capacity, especially in determining an individual’s ventilatory reserve—the difference between MVV and maximal exercise ventilation (V_Emax)—which aids in the diagnosis and differentiation of pulmonary and cardiovas-cular diseases [6–10].
What primarily distinguishes MVV from other PFTs, however, is the lack of standardization regarding how the maneuver is performed. A major component of the test is breathing frequency (fR), but little consensus ex-ists on precisely whatfRor range offRvalues yield opti-mal results. The majority of both past and current research that employed MVV does not provide the fre-quency at which participants ventilated as part of the methodology [11–13]. Moreover, the few studies that do provide this information offer diverging suggestions. One of the earliest investigations on this matter con-cluded that ventilating at 70 breaths·min−1 maximized MVV [14]. A later study utilized an fR range of 60–120 breaths·min−1[15] while another argued against accept-ing results obtained with a frequency of less than 65 breaths·min−1 [16]. A third investigation suggested a narrower window of 70–110 breaths·min−1 [17]. The American Thoracic Society/European Respiratory Society (ATS/ERS) Task Force offered perhaps the most widely accepted range of 90–110 breaths·min−1with an ideal rate of approximately 90 breaths·min−1, but also declared that no specific fR can be mandated due to a lack of research on the topic [18].
The limited evidence supporting an ideal fR range is problematic. Considering both the diagnostic and prog-nostic value of MVV, as well as its ability to assess par-ticipant compliance during pulmonary function testing [19], inaccurate results due to poor standardization may have substantial clinical implications. Consequently, it is
imperative that the variety of current guidelines be evaluated. The aim of this investigation, therefore, was to determine whether there is an optimal fR at which the MVV maneuver ought to be performed, i.e., to con-sistently provide the highest outcome value. This was accomplished by conducting MVV tests at a wide range of fR utilizing a repeated-measures design. In addition to examining preselected fR, this study also explored the effect of a self-selected fR (fRself). Given that syn-chronizing breathing frequency to a rhythm-keeping device at a preset rate may feel unnatural or interfere with performance, we hypothesized that participants would maximize MVV by ventilating at a fR uniquely self-selected by each individual rather than breathing within a predetermined range.
Methods Study design
Ten healthy, non-smoking adults (six men) were re-cruited from the University of California, Los Angeles (UCLA) community to participate in this study. Nine were undergraduate students aged 18–22 years old and one was a 46 year-old university employee (height 1.72 ± 0.13 m; mass 67.1 ± 16.3 kg). The UCLA Institu-tional Review Board approved this study, and all partici-pants provided informed consent prior to enrollment.
Each participant performed MVV maneuvers using nine different preselected fRs ranging from 50 to 130 breaths·min−1 in increments of 10 breaths·min−1 as measured by a metronome. Additionally, all participants performed a maneuver using fRself. In this condition, subjects performed the test without the aid of a metro-nome, and were instead instructed to breathe as rapidly and deeply as possible without inducing significant dis-comfort. The resulting frequency was then recorded. For each frequency, including fRself, participants per-formed three trials for a total of 30 tests (10 per day with 2-min rest between each) over three consecutive days to allow for adequate recovery. To limit order and practice effects, a random number generator deter-mined the sequence in which fR was tested for each participant.
Data acquisition
range found in normal exhaled air. Participants were seated upright in a stationary chair, wore a nose clip, and breathed through a mouthpiece that connected to the metabolic cart. Participants were also instructed to refrain from eating or engaging in vigorous exercise at least before testing.
Prior to performing the first MVV maneuver, slow vital capacity (SVC) was measured using the same sys-tem. Participants were instructed to inhale as much air as possible in a single breath and then exhale, com-pletely emptying the lungs. This value was obtained to compare the ratio of the tidal volume (VT) during MVV to SVC. In addition, participants took normal breaths to establish a baseline respiratory exchange ratio, which was used as a metabolic indicator to determine when a participant had achieved sufficient rest between trials. Once this value had been established, MVV testing began. For each trial, participants were instructed to maximize ventilation by inhaling and exhaling as deeply as possible for 12 s. As frequent vigorous respiration can cause dry mouth, water was provided if requested be-tween tests. During trials defined by a preselected fR, participants listened to a corresponding preset tempo from a metronome and timed their breaths accordingly. In between each beat, both an inhalation and an exhal-ation were performed. During the trials associated with
fRself, no metronome was used—participants freely max-imized breathing while the metabolic cart recorded fR, the value of which was blinded until after a maneuver was completed. In addition to fRand MVV, which were recorded and analyzed for all trials, breath-by-breath measurements of VT and partial pressure of end-tidal
CO2(PETCO2) were also obtained for all maneuvers ex-cept those at the preselected fR of 130 breaths·min−1 (fR130) (Table1).
Statistical analysis
Data for each subject were scaled relative to the max-imum value recorded during preselectedfRand reported as the mean ± standard deviation (SD) for all variables. Sample size was estimated from a combination of pilot testing and preliminary power calculations based on an alpha level of 0.05 and a beta level of 0.20 [20]. As sug-gested by the ATS/ERS Task Force [18], only the test that resulted in the highest MVV out of the three trials perfRwas used for data analysis. The overall effect offR was tested using repeated-measures analysis of variance (ANOVA); comparisons were made between the out-come value at every fR and the maximum value using paired t-tests. The average MVV values were found across subjects for eachfR, and the relationship between these values and the correspondingfRand VTwere ana-lyzed using polynomial regression. The statistics were calculated in MATLAB (version 8.6.0; MathWorks, Inc., Natick, MA) and significance was determined using an alpha level of 0.05.
Results
All ten participants successfully performed three trials at all ten fR values. As demonstrated in Fig. 1, a third-order polynomial regression analysis showed that MVV =−0.0001(fR)3+ 0.0258(fR)2–1.38(fR) + 96.9 at preselected fR and increased up to approximately 100 breaths·min−1 (r2= 0.982, P< 0.001). A paired t-test
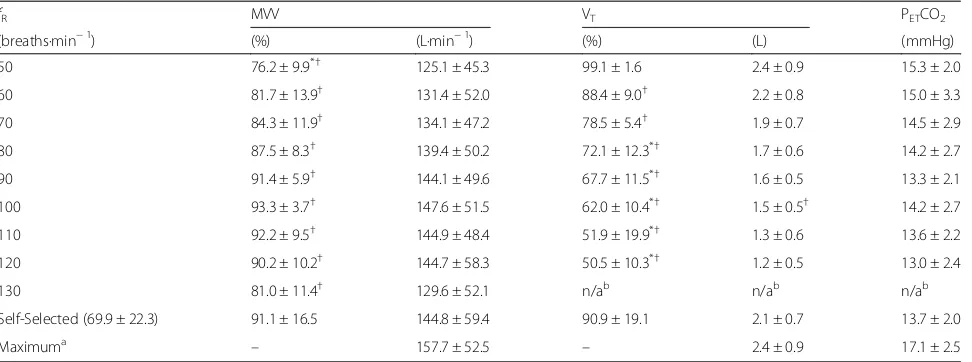
Table 1Outcome variables (scaled and absolute values)
fR MVV VT PETCO2
(breaths·min−1) (%) (L·min−1) (%) (L) (mmHg)
50 76.2 ± 9.9*† 125.1 ± 45.3 99.1 ± 1.6 2.4 ± 0.9 15.3 ± 2.0
60 81.7 ± 13.9† 131.4 ± 52.0 88.4 ± 9.0† 2.2 ± 0.8 15.0 ± 3.3
70 84.3 ± 11.9† 134.1 ± 47.2 78.5 ± 5.4† 1.9 ± 0.7 14.5 ± 2.9
80 87.5 ± 8.3† 139.4 ± 50.2 72.1 ± 12.3*† 1.7 ± 0.6 14.2 ± 2.7
90 91.4 ± 5.9† 144.1 ± 49.6 67.7 ± 11.5*† 1.6 ± 0.5 13.3 ± 2.1
100 93.3 ± 3.7† 147.6 ± 51.5 62.0 ± 10.4*† 1.5 ± 0.5† 14.2 ± 2.7
110 92.2 ± 9.5† 144.9 ± 48.4 51.9 ± 19.9*† 1.3 ± 0.6 13.6 ± 2.2
120 90.2 ± 10.2† 144.7 ± 58.3 50.5 ± 10.3*† 1.2 ± 0.5 13.0 ± 2.4
130 81.0 ± 11.4† 129.6 ± 52.1 n/ab n/ab n/ab
Self-Selected (69.9 ± 22.3) 91.1 ± 16.5 144.8 ± 59.4 90.9 ± 19.1 2.1 ± 0.7 13.7 ± 2.0
Maximuma – 157.7 ± 52.5 – 2.4 ± 0.9 17.1 ± 2.5
Values are presented as mean ± SD both 1) scaled as a percentage of the maximum and 2) absolute. Statistical analysis was performed only on scaled values All values are reported as the percent of the maximum value obtained using preselectedfRvalues
Abbreviations: fRbreathing frequency, MVVmaximum voluntary ventilation, VTtidal volume, PETCO2partial pressure of end-tidal CO2 *P< 0.05 when compared to self-selectedfR
†P< 0.05 when compared to maximum a
Highest value obtained across allfRvalues for every participant b
revealed that the MVV value obtained at an averagefRself of 69.9 ± 22.3 breaths·min−1 (91.1 ± 16.5% of maximum) was not significantly different from the value measured at the roughly equivalent preselected fR70 (84.3 ± 11.9% of maximum; 95% confidence interval of difference: (−2.7, 16.3%),P= 0.190). When the MVV values at allfRvalues were compared to the average maximum value for all subjects, a repeated-measures ANOVA showed a sig-nificant effect offR on MVV (P< 0.001). Further statis-tical analysis showed that results obtained at every
preselected fR were significantly lower than this maximum value, but those measured at fRselfwere not (Table 1). If multiple comparisons are controlled for using a Bonferroni correction, all preselected fR values other thanfR110 and fR120remain significantly different from the maximum.
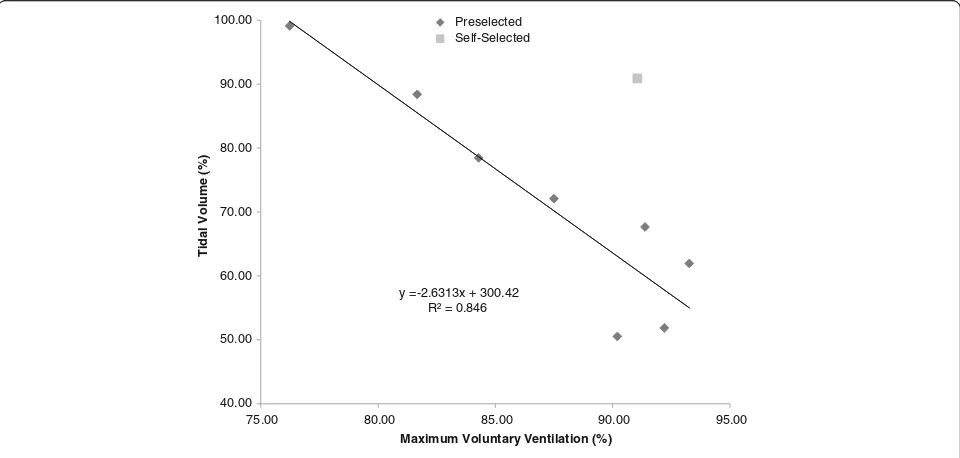
As demonstrated in Fig.2, a linear regression analysis revealed that VT=−2.63(MVV) + 300.4 at preselectedfR (r2= 0.846, P< 0.001). This steadily decreasing trend in VT was observed as the preselected fR and MVV y =-0.0001x3+ 0.0258x2-1.3817x + 96.91
R² = 0.982
70.00 75.00 80.00 85.00 90.00 95.00 100.00
40 60 80 100 120 140
)
%(
n
oi
t
ali
t
n
e
V
yr
at
n
ul
o
V
m
u
mi
x
a
M
Breathing Frequency (breaths·min-1)
Preselected Self-Selected
Fig. 1Relationship between the average maximum voluntary ventilation (MVV) across subjects and average breathing frequency (fR). MVV values are presented as a percentage (%) of the maximum. A polynomial regression analysis of the preselectedfRs yielded a third-order relationship (R2= 0.982,P< 0.001)
y = -2.6313x + 300.42 R² = 0.846
40.00 50.00 60.00 70.00 80.00 90.00 100.00
75.00 80.00 85.00 90.00 95.00
Ti
dal
Vol
ume
(%)
Maximum Voluntary Ventilation (%)
Preselected Self-Selected
Fig. 2Relationship between the average tidal volume (VT) across subjects and the average maximum voluntary ventilation (MVV). VTand MVV
increased, but pairedt-tests showed that this inverse rela-tionship did not remain true forfRself. The VTobtained at thisfR(90.9 ± 19.1% of maximum) was significantly greater than the VTassociated with the most similar MVV value (atfR100, 62.0 ± 10.4% of maximum; 95% confidence inter-val of difference: (17.5, 40.4%), P< 0.001). By contrast, none of the PETCO2data measured at the preselectedfR differed significantly from that offRself, and all were signifi-cantly less than the average PETCO2maximum.
Discussion
Our study, to the best of our knowledge, is the first that examines the effect of altering fR on MVV. After testing preselected fR values ranging from 50 to 130 breaths·min−1 as dictated by a metronome and one self-selected fR by each participant, we found that trials conducted at 90–120 breaths·min−1, and the self-selected rate were equally successful at maximizing MVV. This re-sult differed from our hypothesis where we predicted that onlyfRselfwould yield the highest MVV. When compared to the aforementioned guidelines for optimizing MVV of 60–120, 70–110, and 90–110 breaths·min−1suggested by Dillard et al. (1993) [15], Morris (1976) [17], and the ATS/ ERS Task Force [18] respectively, our findings disagreed with the first and second recommendations but closely resembled the third. However, our data do not support the ATS/ERS Task Force’s recommended goal of 90 breaths·min−1. Considering that participants maximized MVV by breathing atfR90–120andfRself, we recommend choosing either of these approaches rather than aiming for a single value of fR. Furthermore, because maximal values were obtained at fRself, our data suggest that no rhythm-keeping instrument or preselectedfRrange may be necessary at all.
Interestingly, while the trials defined by afR70yielded a significantly lower MVV than the mean maximum for all subjects, they were not statistically different than the MVV value obtained at fRself (69.9 ± 22.3 breaths·min−1, nearly equivalent to 70 breaths·min−1). This is likely ex-plained by the variance, which suggests that while breathing at a self-selected rate may increase the likeli-hood of achieving one’s true MVV, this chosen rate may not be equal among all individuals. Another noteworthy observation stemmed from the differences in VT measured at the preselected and self-selected fR. When plotted against MVV, VTsteadily decreased at the prese-lected fR values. This was unsurprising considering that MVV values were greater at higher fR and as fR in-creases, the tidal volume may decrease in order to sus-tain the faster rate. However, it is also possible that during exercise, increased intra-thoracic pressure and work of breathing can permit concomitant increases in
fRand VT. Interestingly, the data showed that the VT as-sociated with the MVV value obtained at fRself deviated
from the trend observed at the preselected fRvalues—it was significantly greater than its most similar prese-lected counterpart (obtained atfR100). This suggests that when breathing at a self-selected rate, individuals are more likely to utilize an optimal combination of slower deep breaths and faster shallower breaths to maximize MVV. Additionally, matching the rate of one’s breathing to a metronome or other rhythm-keeping instrument can feel distracting and unnatural to the participant, es-pecially compared to ventilating at a natural rate during an assessment of V_Emax, which may decrease the likeli-hood of an accurate measurement [1,21].
Unlike MVV and VT, there were no significant rela-tionships observed between fR and PETCO2. This is somewhat unexpected as PETCO2is known to decrease as the ventilation increases. The lack of this trend in the data may be partially explained by the missing values as-sociated withfR130. It also is plausible that the inverse re-lationship between fR and PETCO2 is not evident until the rate of ventilation is much greater than what was tested in this study. Moreover, it is important to note that the missing values for VTat fR130 may not have fit the strong, negative linear correlation demonstrated in Fig.2. Due to the sharp decrease in MVV from fR120to
fR130, it is unlikely that the corresponding reduction in VTwould have been of the same magnitude; however, it is also improbable that this single data pair would have rendered the aforementioned relationship between VT and MVV non-significant.
differences from one another. The recurring shortcom-ing of these equations is their lack of cohesion—no comprehensive equation exists that successfully incor-porates all of the aforementioned variables. As a result, a number of studies have argued that MVV is best measured directly [19,28,33].
It is important to note that the results from this inves-tigation possess similar limitations to those outlined above, including a homogenous participant cohort and the inability to account for differences in physical char-acteristics due to a small sample size. Further research ought to examine whether a self-selectedfRis as accur-ate and more efficient than a preselected range offRin a larger, more heterogeneous population. Future investiga-tions should also explore other methods to standardize the assessment of MVV, for instance, an optimal test duration and the feasibility of a definitive reference equation. Until then, we advise that participants perform the maneuver preferably at a self-selected fR or within a preselected range of 90–120 breaths·min−1.
Conclusion
Although not as prominent as in decades past, MVV re-mains a clinically relevant PFT whose outcomes are valuable in cardiopulmonary exercise testing and aid in the diagnosis of various neuromuscular, cardiovascular, and pulmonary diseases. This study demonstrates the shortcomings of the current lack of standardization in MVV testing and establishes data-driven recommenda-tions for optimal fR. While classic literature has previ-ously investigated this topic, the antiquity of these works warrants modern research. Furthermore, what these studies suggest as an optimal measurement technique has been overlooked or forgotten in the current guide-lines. Our paper therefore contributes a new and much-needed focus on an evidence-based approach to selecting the optimalfRfor MVV measurement. We rec-ommend that participants perform an MVV maneuver at a self-selected fRas it maximizes the likelihood of an accurate measurement by optimizing a combination of slower deep breaths and faster shallower breaths, elimi-nates the necessity to synchronize breaths to a rhythm-keeping device, and more closely resembles the procedure to obtain V_Emax. If an individual is unable to
perform or performs the maneuver poorly at a self-selectedfR, ventilating within a mandatedfRrange of 110–120 breaths·min−1may also be acceptable.
Abbreviations
ATS/ERS:American Thoracic Society/European Respiratory Society; FEV1: Forced expiratory volume in 1 s;FR: Breathing frequency;fRself:
Self-selected breathing frequency;fRX: Preselected breathing frequency of X
breaths·min−1; MVV: Maximum voluntary ventilation; PETCO2: Partial pressure
of end-tidal CO2; PFT: Pulmonary function test; SD: Standard deviation;
SVC: Slow vital capacity; UCLA: University of California, Los Angeles;
_
VEmax: Maximal exercise ventilation; VT: Tidal volume
Acknowledgements
We would like to express our gratitude to Andrew Chang and Jonathan Lee for their assistance with data collection.
Availability of data and materials
The data that support the findings of this study are available from the corresponding author upon reasonable request.
Authors’contributions
All authors made substantial contributions to this study and manuscript. The study was conceived and designed by BAD and CBC. EVN and WS collected and analyzed the data. EVN, BAD, WS, and CBC composed significant portions of the manuscript and made crucial edits. All authors also read and approved the final version of the manuscript.
Ethics approval and consent to participate
This study was approved by the UCLA Institutional Review Board. All participants provided informed consent prior to enrollment.
Competing interests
The authors declare that they have no competing interests.
Publisher’s Note
Springer Nature remains neutral with regard to jurisdictional claims in published maps and institutional affiliations.
Author details
1
Exercise Physiology Research Laboratory, Departments of Medicine and Physiology, David Geffen School of Medicine at UCLA, 10833 Le Conte Avenue, 37-131 CHS Building, Los Angeles, CA 90095, USA.2Medical Imaging Informatics, Department of Radiology, David Geffen School of Medicine at UCLA, Los Angeles, CA, USA.
Received: 27 March 2017 Accepted: 14 May 2018
References
1. Mottram C. Ruppel’s manual of pulmonary function testing. 11th ed. St. Louis: Elsevier Health Sciences; 2017. p. 66-67.
2. Braun NM, Arora NS, Rochester DF. Respiratory muscle and pulmonary function in polymyositis and other proximal myopathies. Thorax. 1983;38: 616–23.
3. Serisier DE, Mastaglia FL, Gibson GJ. Respiratory muscle function and ventilatory control. I in patients with motor neurone disease. II in patients with myotonic dystrophy. Q J Med. 1982;51:205–26.
4. Rochester DF, Esau SA. Assessment of ventilatory function in patients with neuromuscular disease. Clin Chest Med. 1994;15:751–63.
5. Bevacqua BK. Pre-operative pulmonary evaluation in the patient with suspected respiratory disease. Indian J Anaesth. 2015;59:542–9.
6. Singh VN. The role of gas analysis with exercise testing. Prim Care. 2001;28: 159–79. vii-viii
7. Ferrazza AM, Martolini D, Valli G, Palange P. Cardiopulmonary exercise testing in the functional and prognostic evaluation of patients with pulmonary diseases. Respiration. 2009;77:3–17.
8. Toma N, Bicescu G, Enache R, Dragoi R, Cinteza M. Cardiopulmonary exercise testing in differential diagnosis of dyspnea. Maedica (Buchar). 2010; 5:214–8.
9. Arena R, Sietsema KE. Cardiopulmonary exercise testing in the clinical evaluation of patients with heart and lung disease. Circulation. 2011;123: 668–80.
10. Myers J. Applications of cardiopulmonary exercise testing in the management of cardiovascular and pulmonary disease. Int J Sports Med. 2005;26(Suppl 1):S49–55.
11. Neder JA, Andreoni S, Lerario MC, Nery LE. Reference values for lung function tests. II. Maximal respiratory pressures and voluntary ventilation. Braz J Med Biol Res. 1999;32:719–27.
12. Fulton JE, Pivarnik JM, Taylor WC, Snider SA, Tate AL, Frankowski RF. Prediction of maximum voluntary ventilation (MVV) in African-American adolescent girls. Pediatr Pulmonol. 1995;20:225–33.
14. Bernstein L, D'Silva JL, Mendel D. The effect of the rate of breathing on the maximum breathing capacity determined with a new spirometer. Thorax. 1952;7:255–62.
15. Dillard TA, Hnatiuk OW, McCumber TR. Maximum voluntary ventilation. Spirometric determinants in chronic obstructive pulmonary disease patients and normal subjects. Am Rev Respir Dis. 1993;147:870–5.
16. Miller WF, Johnson RL Jr, Wu N. Relationships between maximal breathing capacity and timed expiratory capacities. J Appl Physiol. 1959;14:510–6. 17. Morris JF. Spirometry in the evaluation of pulmonary function. West J Med.
1976;125:110–8.
18. Miller MR, Hankinson J, Brusasco V, Burgos F, Casaburi R, Coates A, Crapo R, Enright P, van der Grinten CP, Gustafsson P, et al. Standardisation of spirometry. Eur Respir J. 2005;26:319–38.
19. Campbell SCA. Comparison of the maximum voluntary ventilation with the forced expiratory volume in one second: an assessment of subject cooperation. J Occup Med. 1982;24:531–3.
20. Dupont WD, Plummer WD Jr. Power and sample size calculations. A review and computer program. Control Clin Trials. 1990;11:116–28.
21. Johnson BD, Weisman IM, Zeballos RJ, Beck KC. Emerging concepts in the evaluation of ventilatory limitation during exercise: the exercise tidal flow-volume loop. Chest. 1999;116:488–503.
22. Clark TJ, Freedman S, Campbell EJ, Winn RR. The ventilatory capacity of patients with chronic airways obstruction. Clin Sci. 1969;36:307–16. 23. Burrows B, Strauss RH, Niden AH. Chronic obstructive lung disease 1, 2: III.
Interrelationships of pulmonary function data. Am Rev Respir Dis. 1965;91: 861–8.
24. Jones NL, Jones G, Edwards RH. Exercise tolerance in chronic airway obstruction. Am Rev Respir Dis. 1971;103:477–91.
25. Cherniack RM, Raber MB. Normal standards for ventilatory function using an automated wedge spirometer. Am Rev Respir Dis. 1972;106:38–46. 26. Bass H. The flow volume loop: normal standards and abnormalities in
chronic obstructive pulmonary disease. Chest. 1973;63:171–6. 27. Hasan S, Rakkah NIAV, Attaur-Rasool S. Effect of smoking on respiratory
pressures and lung volumes in young adults. Biomedica. 2013;29:96–100. 28. Stein R, Selvadurai H, Coates A, Wilkes DL, Schneiderman-Walker J, Corey M.
Determination of maximal voluntary ventilation in children with cystic fibrosis. Pediatr Pulmonol. 2003;35:467–71.
29. Tell A, Bagali S, Aithala M, Khodnapur J, Dhanakshirur GB. Alterations in minute ventilation, maximum voluntary ventilation and dyspneic index in different trimesters of pregnancy. Indian J Physiol Pharmacol. 2014;58:96–9. 30. Ortega VE, Kumar R. The effect of ancestry and genetic variation on lung
function predictions: What is“normal”lung function in diverse human populations? Curr Allergy Asthma Rep. 2015;15:16.
31. Duong M, Islam S, Rangarajan S, Teo K, O’Byrne PM, Schunemann HJ, Igumbor E, Chifamba J, Liu L, Li W, et al. Global differences in lung function by region (PURE): an international, community-based prospective study. Lancet Respir Med. 2013;1:599–609.
32. Roa Jr CC, Zaldivar CA, Salonga R, Bobadilla J, Lansang MA, Reodica R, Balgos A, Blanco J, TJ Q. Normal standards for ventilatory function test in adult Filipinos. Philipp J Intern Med. 2013;51:1–6.