M E T H O D O L O G Y
Open Access
Development of a method for the measurement
of primary cilia length in 3D
Taryn Saggese
1, Alistair A Young
1, Chaobo Huang
2, Kevin Braeckmans
2and Susan R McGlashan
1*Abstract
Background:Primary cilia length is an important measure of cell and tissue function. While accurate length measurements can be calculated from cells in 2D culture, measurements in tissue or 3D culture are inherently difficult due to optical distortions. This study uses a novel combination of image processing techniques to rectify optical distortions and accurately measure cilia length from 3D images.
Methods:Point spread functions and experimental resolutions were calculated from subresolution microspheres embedded in 3D agarose gels for both wide-field fluorescence and confocal laser scanning microscopes. The degree of axial smearing and spherical aberration was calculated fromxy:xzdiameter ratios of 3D image data sets of 4μm microspheres that had undergone deconvolution and/or Gaussian blurring. Custom-made 18 and 50μm fluorescent microfibers were also used as calibration objects to test the suitability of processed image sets for 3D skeletonization. Microfiber length in 2D was first measured to establish an original population mean. Fibers were then embedded in 3D agarose gels to act as ciliary models. 3D image sets of microfibers underwent
deconvolution and Gaussian blurring. Length measurements within 1 standard deviation of the original 2D population mean were deemed accurate. Finally, the combined method of deconvolution, Gaussian blurring and skeletonization was compared to previously published methods using images of immunofluorescently labeled renal and chondrocyte primary cilia.
Results:Deconvolution significantly improved contrast and resolution but did not restore thexy:xzdiameter ratio (0.80). Only the additional step of Gaussian blurring equalizedxyandxzresolutions and yielded a diameter ratio of 1.02. Following image processing, skeletonization successfully estimated microfiber boundaries and allowed reliable and repeatable measurement of fiber lengths in 3D. We also found that the previously published method of calculating length from 2D maximum projection images significantly underestimated ciliary length.
Conclusions:This study used commercial and public domain image processing software to rectify a long-standing problem of 3D microscopy. We have shown that a combination of deconvolution and Gaussian blurring rectifies optical distortions inherent in 3D images and allows accurate skeletonization and length measurement of microfibers and primary cilia that are bent or curved in 3D space.
Keywords:3D microscopy, deconvolution, fluorescent microfibers, Gaussian blurring, kidney cilia, skeletonization
Background
Primary cilia are small rod-like sensory organelles that protrude from the surface of most mammalian cell types [1]. They range in length from 1μm in chondrocytes and up to 30μm in kidney epithelial cells [2-4]. Primary cilia play a role in a vast number of cellular processes including
cell cycle control, hedgehog signaling and mechanosensa-tion [1,3,5-8]. Many recent studies have investigated the role of primary cilia length as a means by which the cell can control its sensitivity and fine-tune downstream sig-naling events [9,10]. Specifically, studies examining pri-mary cilia mechanotransduction in kidney epithelial cells have shown that deflection of the primary cilium results in a Ca2+signaling event, and that cilia length is proportional to the magnitude of the signaling response [11]. Several previous studies, including our own, have shown that cilia
* Correspondence: [email protected] 1
Department of Anatomy with Radiology, Private Bag 92019, University of Auckland, Auckland 1023, New Zealand
Full list of author information is available at the end of the article
length is sensitive to prolonged periods of mechanical stimulation or insult, for example shortening of either chondrocyte cilia in response to compressive strain [3], endothelial cell cilia in response to flow [12] or kidney cell cilia in response to tubular necrosis [6].
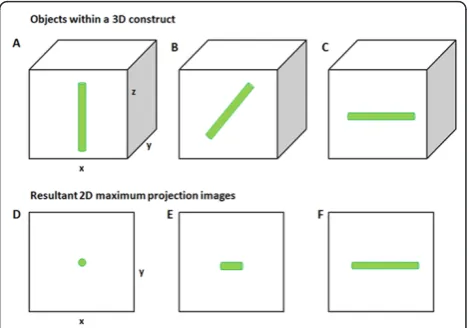
Accurate measurement of ciliary length in 3D can be achieved using transmission electron microscopy using either serial sectioning or electron tomography. How-ever, obtaining an entire axonemal profile within a 70 nm section has a probability of 0.5% (1 in 200 cells) [13]. This poses a significant technical challenge and limits the number of cells that can be examined. There-fore, currently, the main method of quantifying primary ciliary length in greater numbers in fixed 2D and 3D cell cultures and tissue sections is by immunofluores-cence using antibodies such as acetylateda-tubulin or Arl13b [3,10,14-18]. Forin vitrocell culture studies, spe-cimens are prepared so that primary cilia are lying flat along the coverslip. Cilia length can then be measured directly from a 2D image using simple line measurement tools associated with the microscope software or a gen-eric image analysis program such as ImageJ http:// rsbweb.nih.gov/ij/. However, many studies measure cilia in tissue sections such as kidney [6], in whole mount preparations of zebrafish embryos [7,9] or, as in our stu-dies, chondrocytes cultured in 3D agarose gels [3]. In such 3D preparations, cilia are oriented through several imaging planes within a 3D volume and are bent at ran-dom orientations. Due to the 3D nature of these pre-parations, studies tend to use techniques such as confocal laser scanning or multiphoton microscopy to collect 3D image stacks of primary cilia [3,14,18]. These stacks can be converted to 2D maximum intensity pro-jection images in order to view the entire cilium and make direct length measurements [3]. However, as illu-strated in Figure 1, this can lead to inaccurate measure-ments, since any cilium that does not lie completely parallel to the plane of focus will not appear at full length in the 2D projection image. For a randomly oriented population of cilia, this method would lead to an underestimation of the average cilia length. We and others have previously overcome this problem by only imaging cilia that were approximately 90° to the incident light and ensuring that the maximumz depth was≤1.5
μm [3,6,19]. This method results in a biased sample, since only a small subset of cilia are measured. We believe that accurate length measurements can only be obtained from an unbiased population by analyzing the entire 3D volume. However, 3D microscope images con-tain many optical distortions, such as axial smearing and spherical aberrations, which prevent accurate measure-ments from being made directly. Several studies have used deconvolution and mathematical modeling of cilia images to accommodate for these optical distortions
[18,20]. However, we believe that this approach is suita-ble for straight cilia and would lead to inaccurate mea-surement if cilia were twisted or curved within 3D space. Consequently, this study uses a novel combina-tion of established image processing techniques to rec-tify these optical distortions and accurately measure length from 3D images.
We used custom-made fluorescent microfibers that were embedded in 3D agarose gels representing‘mock’ cilia of known lengths to calibrate optical distortions associated with 3D optical microscopy and to test sev-eral combinations of established digital imaging proces-sing techniques to measure fiber length within 3D volumes. Finally, we compared our previously published methods with the newly developed method to measure primary cilia of chondrocytesin vitroand kidney epithe-lial cellsin situ.
Methods
Microfibers and microspheres
Model objects of known dimensions were used to vali-date the ability of digital image-processing techniques to rectify optical distortions and restore object morphology. Two kinds of model objects were used; commercially available fluorescent microspheres were used to opti-mize and validate deconvolution and Gaussian blurring procedures, while custom made fluorescent microfibers were used to test the accuracy of length measurements.
Microfibers were produced by electrospinning poly-styrene solutions containing a fluorophore (coumarin-6). First, a droplet of fluorescent polymer solution was formed at the tip of a needle by surface tension while charge was induced on the droplet surface by an electric field. When the electric field reached a critical value at
which the electric force was greater than the surface tension of the droplet, a charged jet was ejected from the tip. While the jet traveled in air, the solvent evapo-rated, resulting in the deposition of fibers. A rotating collector fitted with a microscope glass slide was used to collect aligned fibers. The fibers were then cut into either 18 or 50 μm lengths by cold ablation using a PALM MicroBeam System which was equipped with a 355 nm pulsed UV-Laser (Version 4.0 AxioVert laser; PALM MicroBeam, Carl Zeiss, Munich, Germany). The fibers were then dry sealed under a coverslip for storage. 2D images of the microfibers were collected to calculate the true length of the fibers prior to further processing. These measurements are herein termed the original fiber population.
The microfibers were resuspended in distilled water and embedded in 3D agarose gel constructs. Agarose constructs were prepared by melting 8% w/v agarose (Sigma-Aldrich, Auckland, New Zealand) in distilled water. Equal volumes of agarose gel and microfibers were combined to yield a final agarose concentration of 4%. The solution was spread out in a thin layer on a micro-scope slide and set at 4°C for 20 minutes. 3D image stacks of microfibers were acquired from constructs using either wide-field fluorescence (WF) microscopy or confocal laser scanning microscopy (CLSM).
Microspheres with diameters 0.17μm, 0.2μm or 4μm (Invitrogen, Auckland, New Zealand) were diluted 1:1,000 in distilled water and embedded in 3D agarose gels in an identical manner as described for the microfi-bers. 3D image stacks of the microspheres were acquired under WF or CLSM conditions imaging conditions as appropriate. The differences between experimental WF and CLSM point spread functions (PSFs) are presented in Additional file 1. The effect of imaging depth for agarose specimens is detailed in Additional file 2.
Immunofluorescent labeling of primary cilia
Wild-type murine chondrocytes embedded in 3D agarose constructs were fixed in 4% paraformaldehyde (PFA) for 30 minutes. Mice were maintained according to approved protocols at the Medical University of South Carolina (AR2646). Heterozygous mice were bred with homozy-gous Immortomouse mice (H-2Kb-tsA58), which harbor a temperature sensitive SV40 large T antigen transgene under the control of an interferon-g-inducible H-2Kb promoter (H-2Kb-tsA58) to produce wild-type/Immorto-mouse compound heterozygous mice. Chondrocytes were isolated from the distal metaphyses of the femurs and proximal metaphyses of the tibiae of 4-day-old mice by digestion with collagenase type II (2 mg/ml) dispersed in Dulbecco’s Modified Eagles medium (DMEM; Invitrogen, Auckland, New Zealand) at 37°C for 4 h. Chondrocytes were then cultured in DMEM plus 10% fetal calf serum
(FCS; Sigma-Aldrich, Auckland, New Zealand) in the presence of interferon-g (10 ng/ml; Sigma) at 33°C. To switch off the SV40 gene, cells were cultured in DMEM and 10% FCS at 37°C for 3 days prior to seeding in agarose gels.
Following fixation, chondrocyte agarose constructs were then dehydrated and embedded in paraffin wax using standard histological procedures. Sections 12 μm thick were dewaxed and underwent microwave antigen retrieval by rapid boiling in 0.1 M citrate buffer (pH 6) for 2 × 3 minutes. Paraffin embedded ovine kidney sec-tions (5μm) were dewaxed and underwent citrate buffer antigen retrieval as above. Ovine kidneys were obtained according to approved protocols at the University of Otago Animal Ethics Committee (AEC88/07). All sec-tions were permeabilized for 5 minutes in 0.5% (v/v) Triton X100 (Global Science & Technology, Auckland, New Zealand), and washed 3 × 5 minutes in phosphate-buffered saline (PBS) + 0.1% (w/v) bovine serum albu-min (BSA; Global Science & Technology Ltd, Auckland, New Zealand). Sections were blocked with 5% goat serum (Sigma-Aldrich, Auckland, New Zealand) for 30 minutes, and then incubated with a primary antibody against acetylateda-tubulin, (C3B9; T Sherwin, Univer-sity of Auckland, Auckland, New Zealand) at 4°C over-night. The sections were washed three times then incubated with goat anti-mouse antibody (Dylight488, 1:500; Jackson ImmunoResearch, West Grove, Pennsyl-vania, USA) for 2 h at room temperature. Sections were washed and then incubated with Hoechst 33258 (1:500; Sigma-Aldrich, Auckland, New Zealand) for 15 minutes at room temperature. Sections were washed, mounted in Prolong Gold (Invitrogen, Auckland, New Zealand) and sealed with a #1.5 coverslip. Primary cilia were imaged under both WF and CLSM conditions.
Wide-field fluorescence and confocal laser scanning microscopy
All wide-field fluorescence images were acquired on a Zeiss Axioplan2 upright microscope with motorized z stage using a Princeton MicroMax cooled charge-coupled device (CCD) camera controlled with Meta-Morph software (Molecular Devices, Sunnyvale, CA, USA). Images were acquired using a 63 × 0.95 numeri-cal aperture (NA) water immersion lens and xy pixel and z step size were 108 nm and 500 nm for water immersion and 68 nm and 250 nm for oil immersion, respectively. Images were acquired using a filter with 450 to 490 nm excitation and a 520 nm long pass emis-sion. The exposure time for a given specimen was adjusted so that no more than 1 pixel in a 3D image stacks had an intensity of 255.
Software version 2.61. Images were acquired with either a 63 × 0.9 NA water immersion lens or a 100 × 1.3 NA oil immersion objective. The xy pixel and z step size were 66.4 nm and 400 nm for water immersion and 58.1 nm and 250 nm for oil immersion, respectively. Images were acquired using an argon laser with 488 nm excitation and 500 to 560 nm emission. Gain and offset levels were adjusted to ensure that no more than 1 pixel had an intensity of 0 and no more than 1 pixel had an intensity of 255.
Digital image processing
PSF measurements and the calculation of experimental resolutions
Image stacks 8-μm thick of the 0.17 μm and 0.2 μm microspheres embedded in agarose gels were acquired using CLSM and WF microscopy respectively. The image stacks were then analyzed using ImageJ (National Institutes of Health, Bethesda, Maryland, USA); image stacks were converted to an 8-bit format and the maxi-mum pixel intensity in each individual 2D image was measured. The maximum intensity was then plotted against the correspondingzposition to yield an intensity vs distance plot. The full-width half maximum (FWHM) was then calculated using Sigma plot http://www.sigma-plot.com to yield thezresolution. The image stack was then‘resliced’along theyaxis so that the process could be repeated for intensity vs distance along they axis, subsequently yielding thexy resolution.
Deconvolution
Blind and non-blind (also termed measured) deconvolution was performed using Huygens Essential deconvolution software (Scientific Volume Imaging, Hilversum, The Netherlands). See Additional file 3 for parameters. The sig-nal to noise ratio (SNR) was estimated by comparing the image quality of a 4μm microsphere which had undergone blind deconvolution at different SNRs. Once the SNR for each microscope had been determined (SNR = 90 for WF images and SNR = 10 for CLSM), it was used for the deconvolution of all subsequent image stacks. All addi-tional parameters were calculated from the imaging condi-tions according to the software manual. A table of these parameters is summarized in Additional file 3.
Gaussian blurring
Following deconvolution, each 2D image of a subresolu-tion (200 nm) microsphere 3D stack was blurred in the
xyplane (via a convolution operation) with a Gaussian kernel using ImageJ. This was done to make the resolu-tion isotropic (that is, the same in thexyplane as in the
zdirection) in order to enable unbiased length measure-ment in 3D Kernels of various radii were trialed until the resultant xy and z experimental resolutions were approximately equalized. The optimized kernel (radius = 3) was then used to blur all other 3D image stacks.
Skeletonization
Skeletonization of 3D image stacks was performed using Amira Visualization software (Visage Imaging, Rich-mond, Victoria, Australia). A binary 3D representation of the object of interest was created within the software. The binary threshold was adjusted manually until the 3D representation visually matched the protection images. The resulting binary object was then eroded, based on Euclidean distance map values until the cen-terline, that is, the‘skeleton’of the object was produced. The spatial graph function within the Amira software was then used to calculate the length of the skeleton based on the voxel dimensions.
2D maximum projection images
2D maximum intensity projection images were created in ImageJ from 3D WF or CLSM image stacks using the
‘zprojection’function.
Measurement of object dimensions in 2D
Control microfiber lengths were measured directly from 2D images of the original microfiber population using WF images. The xy and xz diameter of 4μm micro-spheres before and after image processing was measured from binary images of 2D maximum projection images created from the 3D image stacks. Microsphere diameter and microfiber length in 2D was measured using the line measurement tool in ImageJ.
Statistical analysis
This study used a calibration approach to assess the accuracy of the new 3D measurement method. The ori-ginal microsphere diameters were provided from the manufacturer and the original fiber population data was collected from the fibers placed on a microscope slide. Measurements from microspheres and original fibers were expressed as a mean and standard deviation. We considered the measurements obtained from fibers in 3D to be accurate if they fell within 1 standard deviation of the original population mean. To assess the difference between microsphere or microfiber image data following the different types of image processing, a Z test was selected to allow comparisons with the mean and stan-dard deviation of the original populations.
As data from primary cilia length measurements were not normally distributed, groups were compared using a Kruskal-Wallis test or Wilcoxon matched pairs t test as appropriate for paired and unpaired data.
For the measurement of primary ciliain vitroandin
situ, the number of cilia that were rejected from image analysis (cilia rejection rate) was calculated as a percen-tage of resolvable cilia over the total number of cilia that were imaged.
All length and diameter measurements are expressed as a mean ± standard deviation. Statistical tests were performed in GraphPad Prism 5.0 software http://www. graphpad.com. P values less than 0.05 were considered statistically significant.
Results and Discussion
Microfibers as ciliary models: 2D maximum projection images underestimate microfiber length
For calibration purposes, we first measured microfiber lengths directly from the two sets of 2D microfiber pre-parations (50 μm and 18 μm long) using WF micro-scopy. The measurements obtained are herein termed the original fiber population (Figure 2A). Microfiber length for the longer fibers ranged from 44 to 55 μm, with a mean length of 49.3 ± 2.3 μm (n = 119). The shorter 18 μm fiber set had a range of 11 to 23 μm, with a mean length of 17.9 ± 2.3 μm (n = 318). We
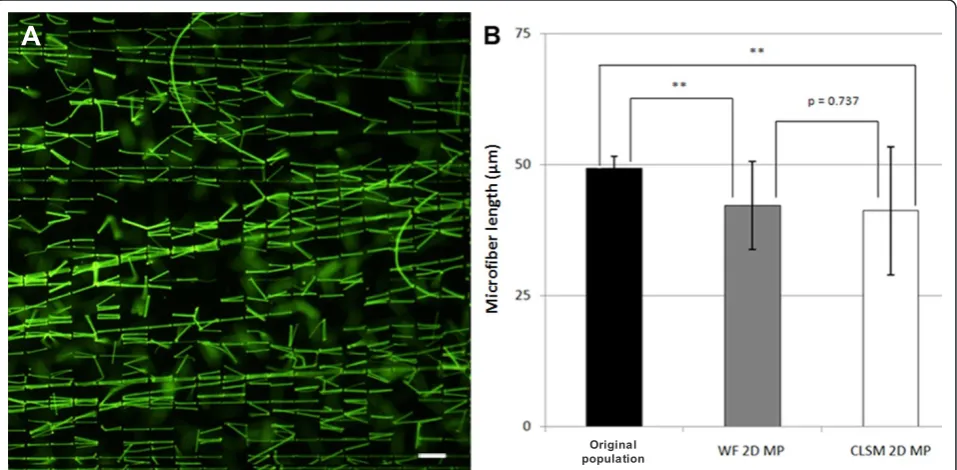
then collected 3D image stacks of a sample of the same fibers embedded in 3D agarose constructs using both WF and CLSM to investigate the accuracy of using 2D maximum projection (MP) images for length measure-ment. Depending on the orientation of the microfibers within 3D, the length in the final 2D MP images of the 50 μm fiber set was significantly reduced, with fiber lengths ranging between 20μm and 50 μm with a mean length of 41.8 ± 8.9 μm (n = 30). Maximum projection measurements from both WF and CLSM data were sig-nificantly different from the original fiber population (P= < 0.001 for both WF and CLSM). There was no dif-ference between WF and CLSM data, P= 0.737 (Figure 2B). The final length calculation was markedly decreased if any bend or twist was present in a fiber, as is often observed in ciliain situ. These results show that 2D max-imum projection images do not provide accurate length measurements of objects in 3D preparations.
Overcoming the optical distortions associated with 3D microscopy: deconvolution combined with Gaussian blurring equalizes lateral and axial resolutions and restores object morphology
Deconvolution, the first image processing technique evaluated, is a digital filtering technique that is specifi-cally designed to rectify the distortions imposed on an image by the optical system arising from the PSF of the
Figure 22D maximum projections (2D MP) significantly underestimate microfiber length in 3D.(A)2D image of the 50μm microfibers set in their original preparation.(B)Mean microfiber (± SD) lengths measured from wide-field fluorescence (WF) or confocal laser scanning microscopy (CLSM) 2D maximum projection images of fibers in 3D constructs. MP measurements from both WF and CLSM data were
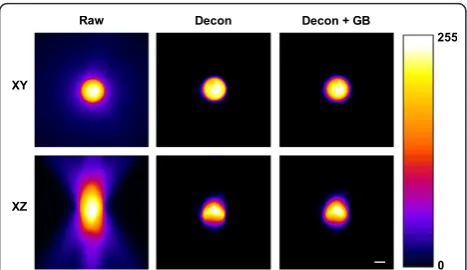
system [21-24]. To assess the validity of deconvolution to remove optical distortions, we first collected images from subresolution microspheres in 3D agarose prepara-tions using WF microscopy and a water immersion objective lens. We found that raw (unprocessed) WF 3D images contained large amounts of out-of-focus light in both thexyand xzplanes with significant axial smearing in thexz plane (Figure 3). The experimental resolution, as measured from the full-width-half-maximum (FWHM) of an intensity vs distance plot, was 540 nm in the xyplane compared with 2,000 nm in the xz plane (Table 1). To demonstrate the difference between xy and xz resolutions, we calculated the xy:xz FWHM aspect ratio and found that raw 3D images yielded an
xy:xzresolution ratio of 0.27 (Table 1). Blind deconvolu-tion produced a significant improvement in contrast and absolute resolution compared to raw images as illu-strated in Figure 3 and Table 1. However, the resultant image was still asymmetrical with significant axial smear, yielding an xy:xz FWHM aspect ratio of 0.32 (Table 1).
Several methods to overcome axial distortion have been previously reported. Weaveret al.used voxel aver-aging, while Lindig et al.decreased the voxel depth by a factor of three to compensate for the effect of axial smearing [25,26]. Soeller and Cannell proposed an alter-native solution to overcome the asymmetry of the 3D PSF, by showing that the directional distortions imposed on the 3D image could be removed if the PSF was made effectively spherical. The shape of the optical PSF along thezaxis can be approximated by a Gaussian distribu-tion; therefore by convolving each individual 2D image in thexyplane with a Gaussian kernel, the xyresolution would decrease until it approximated the z resolution
and the resultant PSF would be spherical [27]. The radius of the Gaussian kernel necessary to achieve this correction is proportional to the raw xy:xz resolution ratio.
We found when examining 3D images of subresolu-tion microspheres that deconvolusubresolu-tion followed by Gaus-sian blurring created a spherical image with a xy:xz resolution (FWHM) aspect ratio of 1.08 (Table 1). Gaus-sian blurring alone (that is, without prior deconvolution) could not be used to create a spherical image, as blur-ring raw images substantially decreased the contrast, which then prevented binarization. Therefore, the opera-tion could only be carried out on previously decon-volved data sets.
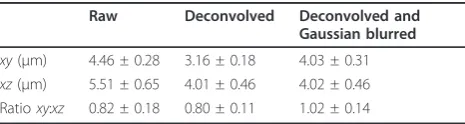
The combined process of deconvolving and Gaussian blurring was further validated by examining the 3D morphology and diameters of 4 μm microspheres. Deconvolution alone produced a dramatic improvement in the 3D appearance of the microspheres, but overly decreased the diameter of the microspheres in the xy plane as measured from binary images (Table 2 and Fig-ure 4). Following Gaussian blurring, there was little change to the appearance of the microsphere in 3D but the xydiameter was restored to an accurate value. Con-sequently, the microsphere diameters were very similar in both planes, giving an xy:xzdiameter ratio of 1.02 (Table 2 and Figure 4). These data show that even though thexyresolution was reduced by approximately three times following Gaussian blurring, the processing still achieved accurate diameter measurements in both image planes. The use of these supraresolution (4μm) microspheres illustrated how the optical pathway dis-torts the dimensions of objects on a scale with those commonly viewed in life science research such as cells and cellular organelles. Together with data presented in
Figure 3Creating a spherical point spread function (PSF). The discrepancy between axial and lateral resolution is illustrated by the shape of the PSF in thexyandxzoptical planes. The combination of deconvolution (Decon) and Gaussian blurring (GB) equalizes the axial and lateral resolutions. This results in a PSF that is
approximately spherical and therefore has the same size and shape in bothxyandxzplanes. Scale bar = 1μm.
Table 1 Making the point spread function (PSF) spherical
Raw Deconvolved Deconvolved and Gaussian blurred
xy(nm) 540 ± 76.4 324 ± 76.4 1,080 ± 76.4
xz(nm) 2,000 ± 176.8 1,000 ± 176.8 1,000 ± 176.8 Ratioxy:xz 0.27 ± 0.01 0.32 ± 0.02 1.08 ± 0.02
Full-width-half-maximum (FWHM) measurements of experimental PSFs for raw, deconvolved and deconvolved and Gaussian blurred 3D images (n = 5).
Table 2 Restoration of microsphere morphology
Raw Deconvolved Deconvolved and Gaussian blurred
xy(μm) 4.46 ± 0.28 3.16 ± 0.18 4.03 ± 0.31
xz(μm) 5.51 ± 0.65 4.01 ± 0.46 4.02 ± 0.46 Ratioxy:xz 0.82 ± 0.18 0.80 ± 0.11 1.02 ± 0.14
Figure 3 and Table 1, we show that deconvolution com-bined with Gaussian blurring removes asymmetric dis-tortions within a 3D image.
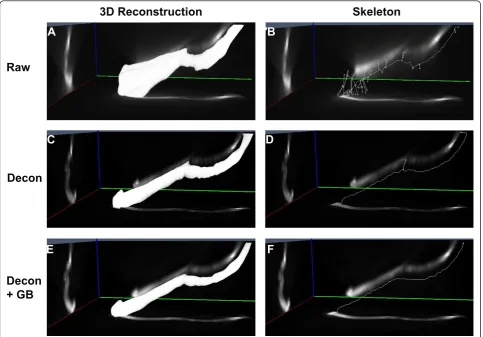
Skeletonization allows measurement of microfiber length in 3D
We then went on to validate the accuracy of skeletoni-zation as a tool to measure length in 3D using the cus-tom-made fluorescent microfibers as models of cilia. Skeletonization is a digital image processing technique that is commonly used to find the medial axis of objects and simplify images of branched structures [28,29]. The skeletonization process begins by creating a 3D recon-struction of the object using a binary mask. The voxels at the edge of the binary object are then successively eroded (based on a Euclidean distance map) until a sin-gle row of connected voxels down the center of the object remains, thereby creating a skeleton of the object. Since the dimensions of the voxels are known from the imaging parameters, the length of the object can be directly calculated from this skeleton and the length of curved objects can be measured. Due to the erosion process, skeletonization can decrease the length of any object but only in proportion to the diameter of the object. We believe this was negligible due to the high aspect ratio of the fibers and it did not affect the final length measurements.
We found that the fibers embedded in agarose gel were randomly oriented in 3D and were curved or bent in several different directions. Raw 3D images of micro-fibers contained prominent optical distortions, visible as blur or flare (Figure 5A, B). The flare around the fiber resulted in secondary structures in the binary 3D recon-struction and consequently appeared as branches in the skeletal representation (Figure 5B). As a result,
skeletonization of raw 3D images produced a mean microfiber length of 56.74 ± 25.2μm and 25.1 ± 6.6μm for the longer and shorter sets of microfibers, respec-tively. Deconvolution removed the out-of-focus light and increased contrast in the 3D image, which produced a skeletal representation with fewer branches and a mean microfiber length of 51.9 ± 8.0μm and 21.1 ± 5.0
μm, respectively. However, only deconvolution com-bined with Gaussian blurring completely rectified all optical distortions by attenuating the fluorescent inten-sity along the z axis. This yielded an accurate, unbranched, 3D skeletal representation with mean microfiber lengths of 49.1 ± 5.9 μm and 18.6 ± 3.9μm, respectively (Figure 5F). The 3D images of the microfi-bers showed that, as with 4μm microspheres, deconvo-lution had a dramatic effect on image quality and the additional process of Gaussian blurring did not visually alter the quality of the image (Figure 5). However the subtle adjustment of grayscale values caused by Gaus-sian blurring over the entire 3D image had a significant effect on the binary image, which in turn, affected the final length calculation. Statistical analysis revealed that only the combination of deconvolution and Gaussian blurring produced a mean fiber length that was not sta-tistically significant different from the fiber length mea-sured from the original fiber population (P= 0.6312 and 0.1443 respectively for 50μm and 18μm fiber sets; Fig-ure 6A, B). All other methods of measFig-urement produced significantly different lengths from the original popula-tion mean length (P< 0.001 for all data sets), as shown in Figure 6 and summarized in Additional file 4.
Repeatability and reproducibility of the 3D measurement method
In order to assess the repeatability and reproducibility of the new 3D method, blind deconvolved and Gaussian blurred 50μm and 18μm image sets were measured by three independent observers on two separate occasions. For all observers, the average intraobserver bias was 128 nm and 105 nm for the 50μm and 18 μm fibers, respectively. Repeatability was assessed using paired t tests to verify if each observer’s repeated measurement was significantly different from the first measurement. We found that there was no statistically significant dif-ference between the first and second measurement from each observer suggesting that the method is highly repeatable. The levels of significance for each observer are presented in Table 3.
Interobserver biases were compared using repeated-measures ANOVA and we found that there was no sta-tistical significant difference between measurements from the three observers (P = 0.178 and P = 0.131 for the 50μm and 18μm data sets, respectively). The aver-age biases between observers were 147 nm and 308 nm
Figure 4 The combination of deconvolution and Gaussian blurring restores object morphology. Pseudocolored 2D maximum projection images of a 4μm microsphere in thexyandxz
and are presented in Figure 7. Given the lack of any sta-tistical difference between groups and that the absolute discrepancies fall within the measurement resolution (that is, with the voxel resolution of 108 nm for thexy plane and 500 nm for thez plane), we believe that the 3D measurement method is within acceptable limits of repeatability and reproducibility.
Primary cilia in 3D: validation of the 3D measurement method
Following successful measurement of microfibers, we next assessed the suitability of the 3D measurement method for measuring primary cilia in two different cell types (Figure 8). First, we compared measurements obtained from CLSM maximum projected images (as described in reference 3) with our new 3D method. For chondrocyte cilia, we found no significant difference between length measurements using the two different approaches with a mean length of 1.8 μm (± 0.1) and 1.9μm (± 0.1), for 2D and 3D methods, respectively (P=
0.17; n = 21, Figure 8A). However, the 2D maximum projection method significantly underestimated cilia length in kidney epithelial cells with a mean length of 1.4
μm (± 0.2) compared to 2.2 μm (± 0.2; P = 0.001; n = 19) when measured using the 3D method (Figure 8B). This difference was most likely because chondrocyte cilia are relatively short (< 2μm), and given the resolution limit of an optical microscope, they did not generate a detectable error when measured from 2D projections. However, even though kidney cilia were only slightly longer that the chondrocyte cilia (mean length 2.2μm), there was a statistically significant difference between 2D and 3D measurements.
Since the previously published method used confocal microscopy, and the new 3D method used wide-field microscopy, we then measured the same cilia from the 3D WF image stacks and compared them with 3D WF images stacks that had been converted into 2D maxi-mum projections. In both chondrocytes and kidney cells, cilia length was significantly shorter when
measured in 2D maximum projection images compared to the 3D method (P = 0.0001 for chondrocytes, P = 0.0007 for kidney cells; Figure 8A, B).
Limitations of the study
We believe there were two potential sources of variation in this study. First was related to the use of custom-made microfibers. Since fluorescent rod-like calibration objects are not available commercially, we generated two sets of fluorescent polystyrene microfibers to act as models of cilia. However, although we are confident of
the fiber length in 2D, we cannot be sure that the fibers did not swell, break or physically distort during proces-sing into agarose gels and believe this is a likely source of the increased variability of microfiber measurements observed with the 3D method compared to original 2D fiber population.
Secondly, the only subjective step in the image proces-sing was the manual thresholding of the 3D image object that was used to create the skeleton. However, we have shown that the method is highly reproducible when tested by three independent observers (see Figure 7).
A further important consideration when using skeleto-nization is with regard to overlapping or cilia that are in contact. We found that when two single cilia overlapped in 3D space, they appeared as one long cilium in a 2D maximum projection image (Figure 9C, arrowhead). However, these cilia were easily distinguished as indivi-dual cilia in 3D (Figure 9D, arrowhead), therefore, the 3D method effectively increased the number of cilia that could be skeletonized within the sample. Specifically, 5% of all cilia examined with the new 3D method were excluded in the analyses because they were physically touching, whereas 21% of cilia were rejected from ana-lyses in the 2D maximum projection images. This is because even if cilia are stacked on top of each other but are separated by several microns in the zaxis, they would appear as if they are touching in the 2D maxi-mum projection image (Figure 9C). Therefore, as shown in Figure 9, the new method significantly increased the number of cilia that can be measured within a sample.
In addition, many kidney cilia were curved in 3D. Both overlapping and bending would result in additional inaccuracies when measured from 2D maximum projec-tion images. In conjuncprojec-tion with our microfiber data, these results suggest that, unless cilia are shorter than 2
μm and are regularly arranged, accurate length measure-ments can be achieved using the new 3D method. For objects less than 2 μm in length, it may be sufficient to
Figure 6Comparison of microfiber length by measurement method.(A)The 50μm fiber set.(B)The 18μm fiber set. For both microfiber sets, only deconvolution combined with Gaussian blurring and skeletonization produced a microfiber length measurement that was not significantly different from the original population. Values represents mean ± SD (**P≤0.01).
Table 3 Comparison of intraobserver length measurements
Intraobserver 18μm fibers 50μm fibers
Observer 1 P= 0.540 P= 0.628 Observer 2 P= 0.133 P= 0.797 Observer 3 P= 0.972 P= 0.758
Pvalues from paired t tests comparing each observer’s first and second repeated measurement for each microfiber set.
Figure 7Interobserver variation. Microfiber lengths obtained for the original population, compared with the mean measurements made by the three observers using the developed 3D method.(A)
Figure 8Primary cilia lengths obtained from 2D and 3D measurement methods.(A)Chondrocyte primary ciliain vitromeasured using 2D maximum projection images from confocal laser scanning microscopy (CLSM) data, the new 3D method and from 2D maximum projection (MP) images created from the 3D data. (B) Kidney primary ciliain situ, measured using 2D and 3D methods. In all instances the 3D measurement method produced a larger mean primary cilia length. (*P≤0.05, **P≤0.01).
acquire length measurements directly from 2D maxi-mum projection images.
Further applications
The work presented in this study was conducted to develop a method for the accurate length measurement of primary ciliain vitro andin situ in fixed specimens. However the methods used in this paper could be adapted to allow accurate length measurement of objects in 3D under different conditions. Particularly with the development of image analysis software capable of processing 4D image stacks, in vivo and dynamic length measurements of primary cilia could be calculated.
Conclusions
This study used commercial and public domain image processing software to rectify a long-standing problem of 3D microscopy. Our work has shown that 2D maxi-mum projection images significantly underestimate the lengths of randomly oriented microfibers in 3D. Skeleto-nization enabled length measurement of objects in 3D but only if the images were free of optical distortions. The optical distortions inherent to 3D microscope images were rectified using a combination of deconvolu-tion and Gaussian blurring. The method allowed for accurate length measurements of fibers and primary cilia in 3D with lengths between 2 and 50μm.
Additional material
Additional file 1: Experimental resolution of wide-field fluorescence (WF) and confocal laser scanning microscopy (CLSM) conditions. Table of experimental resolutions for WF and CLSM in raw (unprocessed) and deconvolved images and discussion of results.
Additional file 2: The effect of imaging depth on wide-field fluorescence (WF) axial resolution. Table of experimental resolutions detailing the effect of depth on WF axial resolution due to refractive index mismatch and discussion of the results.
Additional file 3: Deconvolution parameters. Note on the measurement of the refractive index of agarose and a detailed table of deconvolution parameters.
Additional file 4: Comparison of microfiber length by measurement method. Tables of 50μm and 18μm microfiber data detailing statistical comparison of mean microfiber length by type of measurement method.
Acknowledgements
We thank Dr Frederique Vanholsbeeck for help with the refractive index of agarose measurement, Jacqui Ross, Hilary Holloway and the Biomedical Imaging Research Unit for microscopy assistance, Ray Gilbert for imaging and deconvolution advice, Lulu Zuo forin vitrospecimens, Courtney Haycraft for mouse chondrocytes, Avinesh Pillai for statistical analyses advice and Benedict Uy, Sarah Kennedy and Cynthia Jensen for helpful discussions. This work was supported by the Royal Society New Zealand Marsden Fund. Mado Vandewoestyne and Dieter Deforce from the laboratory of Pharmaceutical Technology (Ghent University, Belgium) are acknowledged with gratitude for providing access to the cold ablation system.
Author details
1Department of Anatomy with Radiology, Private Bag 92019, University of Auckland, Auckland 1023, New Zealand.2Faculty of Pharmaceutical Sciences, Ghent University, Harelbekestraat 72, B-9000 Ghent, Belgium.
Authors’contributions
TS: participated in study design, conducted all microscopy work, performed image and statistical analysis and drafted the manuscript. AAY, KB: participated in study design and helped draft the manuscript. CH: produced microfibers and helped draft the manuscript. SRM: conceived the study, participated in its design and coordination, and drafted the manuscript. All authors read and approved the final manuscript
Competing interests
The authors declare that they have no competing interests.
Received: 18 May 2011 Accepted: 3 July 2012 Published: 3 July 2012
References
1. Besschetnova TY, Kolpakova-Hart E, Guan Y, Zhou J, Olsen BR, Shah JV: Identification of signaling pathways regulating primary cilium length and flow-mediated adaptation.Curr Biol2010,20:182-187.
2. Yoder BK:Role of primary cilia in the pathogenesis of polycystic kidney disease.J Am Soc Nephrol2007,18:1381-1388.
3. McGlashan SR, Knight MM, Chowdhury TT, Joshi P, Jensen CG, Kennedy S, Poole CA:Mechanical loading modulates chondrocyte primary cilia incidence and length.Cell Biol Int2010,24:441-446.
4. Wheatley DN:Landmarks in the first hundred years of primary (9+0) cilium research.Cell Biol Int2005,29:333-339.
5. Kim J, Lee JE, Heynen-Genel S, Suyama E, Ono K, Lee K, Ideker T, Aza-Blanc P, Gleeson JG:Functional genomic screen for modulators of ciliogenesis and cilium length.Nature2010,464:1048-1051. 6. Verghese E, Ricardo SD, Weidenfeld R, Zhuang J, Hill PA, Langham RG,
Deane JA:Renal primary cilia lengthen after acute tubular necrosis.J Am Soc Nephrol2009,20:2147-2153.
7. May-Simera HL, Kai M, Hernandez V, Osborn DP, Tada M, Beales PL:Bbs8, together with the planar cell polarity protein Vangl2, is required to establish left-right asymmetry in zebrafish.Dev Biol2010,345:215-225. 8. Wann AK, Zuo N, Haycraft CJ, Jensen CG, Poole CA, McGlashan SR,
Knight MM:Primary cilia mediate mechanotransduction through control of ATP-induced Ca2+ signaling in compressed chondrocytes.FASEB J
2012.
9. Lopes SS, Lourenco R, Pacheco L, Moreno N, Kreiling J, Saude L:Notch signalling regulates left-right asymmetry through ciliary length control. Development2010,137:3625-3632.
10. Ou Y, Ruan Y, Cheng M, Moser JJ, Rattner JB, van der Hoorn FA:Adenylate cyclase regulates elongation of mammalian primary cilia.Exp Cell Res
2009,315:2802-2817.
11. Resnick A, Hopfer U:Force-response considerations in ciliary mechanosensation.Biophys J2007,93:1380-1390.
12. Iomini C, Tejada K, Mo W, Vaananen H, Piperno G:Primary cilia of human endothelial cells disassemble under laminar shear stress.J Cell Biol2004, 164:811-817.
13. Farnum CE, Wilsman NJ:Orientation of Primary Cilia of Articular Chondrocytes in Three-Dimensional Space.Anat Rec (Hoboken)2011, 294:533-549.
14. Donnelly E, Williams R, Farnum C:The primary cilium of connective tissue cells: imaging by multiphoton microscopy.Anat Rec (Hoboken)2008, 291:1062-1073.
15. Gardner K, Arnoczky SP, Lavagnino M:Effect of in vitro stress-deprivation and cyclic loading on the length of tendon cell cilia in situ.J Orthop Res
2010,28:1-6.
16. Miyoshi K, Kasahara K, Miyazaki I, Asanuma M:Lithium treatment elongates primary cilia in the mouse brain and in cultured cells.Biochem Biophys Res Commun2009,388:757-762.
17. Sharma N, Kosan ZA, Stallworth JE, Berbari NF, Yoder BK:Soluble levels of cytosolic tubulin regulate ciliary length control.Mol Biol Cell2011, 22:806-816.
19. McGlashan SR, Cluett EC, Jensen CG, Poole CA:Primary cilia in osteoarthritic chondrocytes: from chondrons to clusters.Dev Dyn2008, 237:2013-2020.
20. Ascenzi MG, Lenox M, Farnum C:Analysis of the orientation of primary cilia in growth plate cartilage: a mathematical method based on multiphoton microscopical images.J Struct Biol2007,158:293-306. 21. McNally JG, Karpova T, Cooper J, Conchello JA:Three-dimensional imaging
by deconvolution microscopy.Methods1999,19:373-385.
22. Shaw P:Deconvolution in 3-D optical microscopy.Histochem J1994, 26:687-694.
23. Swedlow JR:Quantitative fluorescence microscopy and image deconvolution.Methods Cell Biol2007,81:447-465.
24. Wallace W, Schaefer LH, Swedlow JR:A workingperson’s guide to deconvolution in light microscopy.Biotechniques2001,31:1076-1078, 1080, 1082 passim.
25. Weaver CM, Hof PR, Wearne SL, Lindquist WB:Automated algorithms for multiscale morphometry of neuronal dendrites.Neural Comput2004, 16:1353-1383.
26. Lindig TM, Kumar V, Kikinis R, Pieper S, Schrodl F, Neuhuber WL, Brehmer A: Spiny versus stubby: 3D reconstruction of human myenteric (type I) neurons.Histochem Cell Biol2009,131:1-12.
27. Soeller C, Cannell MB:Examination of the transverse tubular system in living cardiac rat myocytes by 2-photon microscopy and digital image-processing techniques.Circ Res1999,84:266-275.
28. Bock AS, Olavarria JF, Leigland LA, Taber EN, Jespersen SN, Kroenke CD: Diffusion tensor imaging detects early cerebral cortex abnormalities in neuronal architecture induced by bilateral neonatal enucleation: an experimental model in the ferret.Front Syst Neurosci2010,4:149. 29. Meijering E:Neuron tracing in perspective.Cytometry A2010,77:693-704.
doi:10.1186/2046-2530-1-11
Cite this article as:Saggeseet al.:Development of a method for the measurement of primary cilia length in 3D.Cilia20121:11.
Submit your next manuscript to BioMed Central and take full advantage of:
• Convenient online submission
• Thorough peer review
• No space constraints or color figure charges
• Immediate publication on acceptance
• Inclusion in PubMed, CAS, Scopus and Google Scholar
• Research which is freely available for redistribution