Efficient Measurement of Shape Dissimilarity
Between 3D Models Using Z-Buffer
and Surface Roving Method
In Kyu Park
Multimedia Lab., Samsung Advanced Institute of Technology, San 14-1, Nongseo-ri, Kiheung-eup, Yongin 449-712, Korea Email: [email protected]
Kyoung Mu Lee
Department of Electronics and Electrical Engineering, Hong-Ik University, Seoul 121-711, Korea Email: [email protected]
Sang Uk Lee
Signal Processing Lab., School of Electrical Engineering, Seoul National University, Seoul 151-742, Korea Email: [email protected]
Received 7 September 2001 and in revised form 14 February 2002
Estimation of the shape dissimilarity between 3D models is a very important problem in both computer vision and graphics for 3D surface reconstruction, modeling, matching, and compression. In this paper, we propose a novel method calledsurface roving techniqueto estimate the shape dissimilarity between 3D models. Unlike conventional methods, oursurface roving approach exploits a virtual camera and Z-buffer, which is commonly used in 3D graphics. The corresponding points on different 3D models can be easily identified, and also the distance between them is determined efficiently, regardless of the representation types of the 3D models. Moreover, by employing the viewpoint sampling technique, the overall computation can be greatly reduced so that the dissimilarity is obtained rapidly without loss of accuracy. Experimental results show that the proposed algorithm achieves fast and accurate measurement of shape dissimilarity for different types of 3D object models.
Keywords and phrases:shape dissimilarity, surface roving, virtual camera, Z-buffer, viewpoint sampling.
1. INTRODUCTION
In 3D computer vision and graphics, shape recovery and modeling have been one of the major research fields dur-ing the last few years. For surface modeldur-ing, multiresolu-tion surface representamultiresolu-tion, object recognimultiresolu-tion, and 3D data compression, it is essential to estimate the geometric dis-tortion or shape dissimilarity in object space, since the per-formance of an algorithm cannot be evaluated quantita-tively without it. In surface modeling [1], the shape dissim-ilarity between the original data and the generated surface model should be compared, and in polygonal mesh reduc-tion [2, 3, 4, 5, 6, 7, 8, 9, 10, 11], the dissimilarity between the original and the simplified mesh should also be determined to guide the model simplification process. While, in 3D data compression [12, 13], the dissimilarity is needed for analyz-ing the rate-distortion property. Similarly, deformable model management and range view registration which employs the
iterative closest point (ICP) algorithm also invoke a shape dissimilarity measurement.
Consider a typical problem of finding the shape dis-similarity between a simplified mesh to an original mesh. Most existing methods use to-vertex [8, 14], vertex-to-plane [3, 9], point-to-surface [2, 5, 15], and surface-to-surface distances [4, 6, 7, 11]. However, most of them are
difficult to implement and require massive computation as
for practical use, and few methods can be found which deal with the problem directly in general setting. A noticeable
pre-vious work isMetro[15].Metroemploys a surface sampling
approach and, in order to achieve fast search, 3D uniform grid is used to index the mesh. Recently, Inagaki et al. [16] proposed an algorithm for measuring error on 3D meshes using pixel division method. An advantage of [16] is that it
can obtain the color difference as well as the geometric error.
In this paper, we propose an efficient method to
evalu-ate the shape dissimilarity between 3D models, even though
they are represented in different types, including point cloud,
polygonal mesh, parametric surface, and voxel model. The reference and test model can be any of them. Only excep-tional case is that point cloud cannot be used for the test model. Unlike the conventional geometric methods, our
ap-proach utilizes a Z-buffer and virtual camera commonly used
in 3D graphics [17]. Using them, the distance between
cor-responding points on different models can be obtained effi
-ciently, which is then used to compute the shape difference
between the models. Since the operation is performed on the geometry engine in graphic hardware, processing time is greatly reduced using 3D graphics accelerator. More than
the shape difference, the proposed approach can be easily
extended to obtain the color difference, by utilizing frame
buffer instead of Z-buffer. Although, in this paper, we only
consider the geometric shape difference.
This paper is organized as follow. In Section 2, we de-fine the shape dissimilarity measure between 3D shapes. Section 3 describes the 3D graphics background which is used in the proposed approach. In Section 4, the proposed algorithm is described in detail. Experimental results are pre-sented in Section 5, and the conclusion is drawn in Section 6.
2. DISTANCE MEASURE
The shape difference is defined as the average distance from
sample points on a reference modelMRto their
correspond-ing points on a test modelMC. Ideally, the sample points are
the whole surfaceS, yielding the difference in a surface
inte-gral onSusing proper metricd(·,·) as follows:
A numerical approximation of (1) can be obtained by
sampling a finite set of point correspondences, {(xiR, xiC)}.
For example, each vertex ofMR can be a sample point in a
mesh model. LetN denote the number of the point
corre-spondences, then (1) can be approximated by a discrete form as
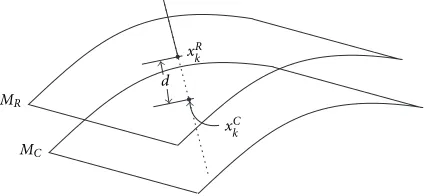
In order to evaluate the distance d(xR
k, xCk) betweenxkR
Figure1: Distance between corresponding points.
and xC
k, we can simply select appropriate d(·,·) among
many distance measures including the signed distance, the absolute distance, and the squared distance.
Then, the only remaining problem is how to find the
cor-responding pointxC
k, that is, for eachxRk, k =0, . . . , N −1.
Usually, the correspondence problem can be solved with rea-sonable accuracy by simply determining the nearest point from each other if the models consist of dense point cloud
or mesh. An improved method is to findxCk by the
intersec-tion of a perpendicular line throughxR
k andMC as shown
in Figure 1. Note that this provides more accurate result but
is computationally more difficult. In this paper, the distance
measure is defined as the latter case. Note that this distance is not a metric, since it is not symmetric.
3. VIRTUAL CAMERA AND Z-BUFFER
In this section, related issues on 3D graphics are addressed,
especially on virtual camera and Z-buffer. They are used effi
-ciently in the proposed method for measuring shape dissim-ilarity, which is described in detail in Section 4.
The most popular camera model used in computer vision and graphics is a perspective projection model. A special case of the perspective camera model is an orthographic camera, in which the focal length is infinite. An example of both mod-els is shown in Figures 2a and 2c, which is implemented using OpenGL [18]. As will be described later, since we are consid-ering just one point in the scene which is positioned on the image center, both cameras can be used in our approach.
The Z-buffer, or depth buffer, is commonly used in 3D
graphics to remove hidden surfaces. It is a memory array, in which each element contains the distance from camera to the object surface drawn at a specific pixel position. The value
in Z-buffer is increasing monotonically as the distance
in-creases.
In OpenGL, there is an important difference in depth
buffering between the two camera models. In a perspective
camera, the value in Z-buffer is not linear. That is, the depth
value in the Z-buffer is not linearly increasing as the distance
from the camera to the object increases. This behavior is well illustrated in Figure 2b, in which depth values are retrieved and plotted while the distance from viewpoint to the target object is increasing. On the other hand, it is linear in an
or-thographic camera, as shown in Figure 2d. Since the Z-buffer
Z-(a)
Figure2: Camera models and their property of depth evaluation in OpenGL. (a) A perspective camera. (b) Depth change in a perspective camera. (c) An orthographic camera. (d) Depth change in an orthographic camera.
direction by simple scaling, we prefer the linear property in
depth buffer values according to the Z position. Therefore, in
this paper, the orthographic projection is adopted. Note that the orthographic projection also simplifies the mathemati-cal computation involved, yielding fast measuring process of shape dissimilarity.
4. MEASURING SHAPE DISSIMILARITY
In this section, a novel method to evaluate the dissimilarity
in (2) using a virtual camera and Z-buffer called surface
rov-ing technique is presented. And then a fast and asymptotic version of the surface roving method based on the view sam-pling technique is described as well.
4.1. Surface roving method
LetXs= {xR0, x1R, . . . , xRn−1}be a set of sample points onMR, on which the approximation error is to be measured. In the
proposed approach, a virtual camera is set to observe xRk,
moving around fork =0,1, . . . , n−1 to observe the whole
surface. The optical axis of the camera is aligned with the op-posite normal direction of each sample point. Based on this
configuration, it is obvious that xR
k and the corresponding
pointxkCare projected onto the same position in the image
coordinates. Note that our objective is to measure the
dis-tance from a sample pointxRk toMCalong the perpendicular
line through it as described in Section 2. Based on this
obser-vation, the distance fromxR
k toxkCcan be evaluated without
explicitly findingxC
k, because the distance from the camera
toxkRand toxCk is recorded in the Z-buffer whenMRandMC
is drawn, respectively. We can retrieve those corresponding
depth values in the Z-buffer and simply compute the diff
er-ence, yielding both signed and unsigned distance fromxR
k to xC
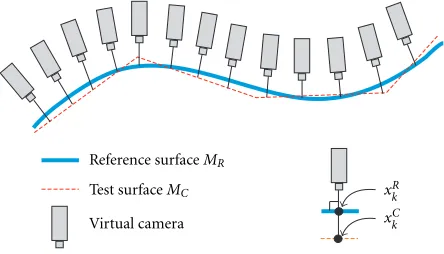
k. This procedure is calledsurface roving, since the virtual
camera visits all the test points over the reference model just like a satellite roving above the earth, as shown in Figure 3.
4.2. Removing geometric ambiguity
Generally, surface roving method works well whenMRis
ex-Reference surfaceMR Test surfaceMC Virtual camera
xR k
xCk
Figure3: Surface roving method with a virtual camera.
tent. However, for the completion of the argument, a few degenerate cases with geometric ambiguity should be ad-dressed.
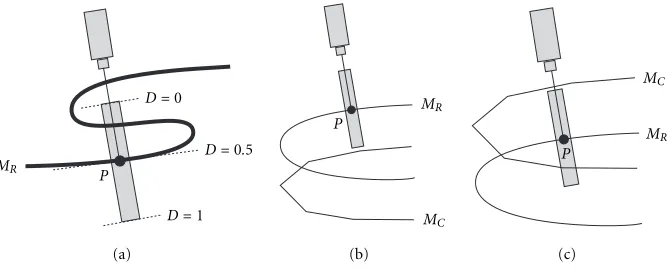
Consider the degenerate cases shown in Figures 4a, 4b, and 4c, which are most likely in real applications. 2D curves imply the intersection of a 3D surface and a normal plane.
Figure 4a shows self-occlusion case of MR, in which other
part ofMR hides the test pointP from the virtual camera.
Since the viewing parameters of the virtual camera can be adjusted easily, the consequent view volume can also be con-structed properly. Therefore, if we choose the view volume of the virtual camera as a rectangular parallelepiped centered at the test point and aligned with the optical axis, the depth
value Dof the test point would be always 0.5, regardless of
the occlusion. We do not need to render the scene in order to compute the depth and therefore occlusion does not influ-ence the depth value at all. In our implementation, the view volume of each virtual camera is built in the same way such
that the Z-buffer evaluation is necessary only forMC.
Other two cases occur when the approximation perfor-mance is very poor. Note that, they seldom occur in our ap-plication, since our concern is a guided multiresolution mod-eling and minor shape distortion by geometry compression. In case of no detection as shown in Figure 4b, we provide a predetermined MAX ERROR value to the test point. A rea-sonable value of MAX ERROR could be the half-height of the view volume.
Figure 4c is the worst case. In this case, since the cor-responding point is determined incorrectly, the measured
depth difference becomes small even though the actual
dis-similarity is large. Note that, any other distance measure
can-not determine the exact difference in this case. Therefore,
a high-level shape matching algorithm is required in order to find the exact correspondence, which is another research topic in computer vision.
4.3. Cooperative method: accelerating surface roving by viewpoint sampling
Although the proposed surface roving method is quite
ac-curate, we have to observe tremendous number of sample
points where the difference is going to be measured. This
might cause redundant operations especially for those
sam-ple points with similar normal direction. However, note that since an orthographic camera model assumes parallel rays, by employing it, we do not need to visit all those sample points individually. For example, for the Bunny model shown in Figure 5a, most of the sample points at the bottom part have similar surface orientations, which is marked as dark region as shown in Figure 5b. In this case, surface roving for those points can be replaced by only one orthographic pro-jection from the viewpoint shown as an arrow in Figure 5b, reducing the number of observations significantly compared with the original surface roving.
The procedure of reducing the number of observations can be interpreted with the extended Gaussian image (EGI). Note that EGI is a mapping of surface normal onto a unit sphere, on which weight is assigned to each point on the sphere equal to the area of the surface having the given normal. For example, the EGI of the Bunny model is il-lustrated in Figure 5c, in which the weight is shown as the length of spike. Based on the EGI of a given model, the vir-tual cameras for surface elements mapped to an EGI point with high weight are replaced with an orthographic projec-tion in the surface normal direcprojec-tion. A few replacement re-duces the number of observations significantly. This
proce-dure is called viewpoint sampling. Note that sampling EGI
points is equivalent to sampling viewpoints which are even-tually viewing directions in orthographic projection. For the convenience, in our implementation, we use uniform sam-pling of EGI on either longitudinal and latitudinal direction. One problem in using viewpoint sample is that there could be self-occlusion when an object is seen from a view sample. There may be unobservable part of the object, espe-cially when the object is not convex. For example, the long ears of the bunny model may occlude the main body. Thus, for those sample points on the occluded region, the view-point sampling method does not work. In order to solve this problem, cooperative method is employed in our approach, in which the surface roving is applied to the occluded region, while the viewpoint sampling is used for the unoccluded re-gion, respectively. Note that whether a sample point is oc-cluded or not can be determined easily by comparing the
depth difference with prespecified threshold. In general, if
the shape of the object is not so complex, most of the sur-face region is observable from one of the viewpoint samples. Note that although the cooperative method is actually an asymptotic implementation of the original surface roving us-ing (2), it provides almost the same performance of the ex-act measure. For instance, for the mesh models in Figures 5a and 8a, the shape distortions are measured using both methods. The histograms of the measured errors are shown in Figure 6, in which both distributions are almost similar, while the number of observations required for the cooper-ative method is reduced to only 5% of that of the original surface roving.
MR P
D=1
D=0.5
D=0
(a)
MC
P
MR
(b)
MR
P
MC
(c)
Figure4: 2D examples of degenerate case with geometric ambiguity. (a) Self-occlusion. (b) No detection (no hit in the view volume). (c) False alarm (wrong hit in the view volume).
(a) (b) (c)
Figure5: Viewpoint sampling method. (a) Bunny model. (b) View samples and a specific mapping. (c) Extended Gaussian image (EGI) of the Bunny model.
does not record the depth on it, the proposed method is not applicable in this case.
Especially, if the reference model is represented by voxel, the number of view samples reduces to only six, since each voxel is actually a cube with six faces. Thus, in this case, the measurement process could be extremely fast.
5. EXPERIMENTAL RESULTS
In this section, we present the experimental results of mea-suring the shape dissimilarity using the proposed coopera-tive surface roving method. First, it is investigated how much the viewpoint sampling reduces the number of observations. For the reference models shown in Figure 7, the numbers of observations required in both the original surface roving and
the cooperative methods are counted for a few different
res-olutions of viewpoint sampling. We summarize the result in Table 1, for various horizontal and vertical resolution, H and V, respectively. As shown in Table 1, the number of observa-tions is reduced significantly compared with that of the orig-inal surface roving method, ranging from 10% (Rocker Arm
model) to 0.65% (Venus model) of the original ones.
View-point sampling replaces the surface roving if the test View-point is
visible from a sample viewpoint in its normal orthographic direction. In case of Rocker Arm model, since the interior wall around the hole is not visible, surface roving should be employed for those area. On the contrary, Venus model is roughly sphere-like such that most of the surface region is visible from appropriate view samples. Therefore, the num-ber of observations can be reduced significantly for the Venus model than for the Rocker Arm model.
In order to show the efficacy of the proposed technique,
experiments are carried out on four different representations
of the Bunny model. The reference model is a dense mesh
with 69.451 triangles shown in Figure 5a, and the test
mod-els are simplified meshes with different resolutions (800 and
10.459 triangles, respectively), rough voxel (32×32×32) and
fine voxel (128×128×128), as shown in Figure 8. The
algo-rithm is implemented on a 1.7 GHz Pentium IV CPU and
GeForce3 Ti200 GPU.
triangula-4
Signed value of the approximation error 0
Signed value of the approximation error 0
Figure 6: Histogram of the approximation error between the Bunny mesh models. (a) Result of applying exact measure by sur-face roving (original sursur-face roving). (b) Result of applying asymp-totic measure by viewpoint sampling plus surface roving (coopera-tive method).
tion algorithm [19], respectively. Finer mesh and voxel show much smaller average errors in both SiAD and USiAD than rough ones, as is expected. Also, it is shown that average error of simplified mesh is smaller than voxel models. This is be-cause the quantization error of voxel model is accumulated all over the surface while the vertex of simplified mesh is se-lected according to the minimum quadric error criterion of [9].
In Table 3, execution time is recorded to show the effi
-cacy in computational complexity. It can be seen that the
proposed approach is computationally efficient and
mea-sures the shape dissimilarity for several different types of
erative methods.
Model name Surface roving Cooperative (H×V) 36×18 24×12 12×6
Bunny 69.451 3.422 3.286 5.396
Teeth 116.602 3.705 3.412 4.619
Rocker Arm 60.264 7.962 7.193 6.307
Venus 134.342 978 868 2.265
Table2: Measured shape dissimilarity. (SiAD: Signed average dis-tance, USiAD: Unsigned average disdis-tance, STD: Standard devia-tion.)
Model type Shape dissimilarity
SiAD USiAD STD
Low-resolution mesh −0.2088 0.6800 0.8575
Middle-resolution mesh 0.0147 0.0541 0.2517
Sparse voxel 1.6307 1.6606 0.9971 Dense voxel 0.4431 0.4450 0.2237
3D models rapidly. Compared with naive implementation of the vertex-to-vertex and vertex-to-plane measures, the co-operative algorithm reduces the execution time significantly.
In this experiment, a total of 24 ×12 view samples are
used, spaced 15 degrees in both latitudinal and longitudinal directions. Unlike the proposed method, neither conven-tional vertex-to-vertex nor vertex-to-plane measure can be used for voxel model. Note that the execution time can be further decreased if the number of samples is reduced by selecting larger spacing. However, in this case, the measure-ment accuracy may decrease as well.
6. CONCLUSION
In this paper, we proposed an efficient method to evaluate the
shape dissimilarity for different types of 3D models. Unlike
the conventional geometric methods, our approach called
surface roving methodutilizes the Z-buffer and virtual cam-era commonly used in 3D graphics to obtain the distance
be-tween corresponding points on different 3D surface models.
In order to make the surface roving faster, an asymptotic im-plementation of the surface roving method was developed, in which viewpoint sampling and simultaneous orthographic
projection of virtual camera were used efficiently. Since the
operation is performed on the geometry engine, it can be sped up by adopting a faster hardware accelerator.
Experi-mental result shows the efficacy of the proposed approach,
(a) (b) (c)
Figure7: 3D reference models. (a) Teeth model with 69,451 triangles. (b) Rocker Arm model with 116,602 triangles. (c) Venus model with 134,342 triangles.
(a) (b)
(c) (d)
Figure8: Different representations of the Bunny model. (a) Simplified mesh at low resolution (1.2% of the original). (b) Simplified mesh at middle resolution (15.1% of the original). (c) Rough voxel. (d) Fine voxel.
Table3: Execution time on a 1.7 GHz Pentium IV CPU and GeForce3 Ti200 GPU.
Model type Execution time (second)
Proposed (cooperative) Vertex-to-vertex Vertex-to-plane
Low-resolution mesh 14.3 72.8 104.8
Middle-resolution mesh 46.1 1152.6 1736.2
Sparse voxel 15.5 N/A N/A
REFERENCES
[1] I. K. Park, I. D. Yun, and S. U. Lee, “Automatic 3-D model synthesis from measured range data,”IEEE Trans. Circuits and Systems for Video Technology, vol. 10, no. 2, pp. 293–301, 2000. [2] H. Hoppe, T. DeRose, T. Duchamp, J. McDonald, and W. Stuetzle, “Mesh optimization,” inProc. SIGGRAPH ’93, pp. 19–26, Anaheim, Calif, USA, August 1993.
[3] R. Ronfard and J. Rossignac, “Full-range approximation of triangulated polyhedra,” Computer Graphics Forum, vol. 15, no. 3, pp. 67–76, 1996.
[4] R. Klein, G. Liebich, and W. Strasser, “Mesh reduction with error control,” in Proc. IEEE Visualization Conference, pp. 311–318, San Francisco, Calif, USA, October 1996.
[5] H. Hoppe, “Progressive meshes,” inProc. SIGGRAPH ’96, pp. 99–108, New Orleans, La, USA, August 1996.
[6] J. Cohen, A. Varshney, D. Manocha, and et al., “Simplifica-tion envelopes,” inProc. SIGGRAPH ’96, pp. 119–128, New Orleans, La, USA, August 1996.
[7] J. Cohen, D. Manocha, and M. Olano, “Simplifying polygo-nal models using successive mappings,” inProc. IEEE Visual-ization Conference, pp. 395–402, Phoenix, Ariz, USA, October 1997.
[8] D. Luebke and C. Erikson, “View-dependent simplification of arbitrary polygonal environments,” inProc. SIGGRAPH ’97, pp. 199–208, Los Angeles, Calif, USA, August 1997.
[9] M. Garland and P. S. Heckbert, “Surface simplification using quadric error metrics,” inProc. SIGGRAPH ’97, pp. 209–216, Los Angeles, Calif, USA, August 1997.
[10] A. E. Johnson and M. Hebert, “Control of polygonal mesh resolution for 3-D computer vision,” Graphical Models and Image Processing, vol. 60, no. 4, pp. 261–285, 1998.
[11] A. Gu´eziec, “Locally toleranced surface simplification,”IEEE Transactions on Visualization and Computer Graphics, vol. 5, no. 2, pp. 168–189, April–June 1999.
[12] G. Taubin and J. Rossignac, “Geometric compression through topological surgery,”ACM Trans. Graphics, vol. 17, no. 2, pp. 84–115, 1998.
[13] C. S. Kim and S. U. Lee, “Compact encoding of 3D voxel sur-faces based on pattern code representation,” IEEE Trans. Im-age Processing, vol. 11, no. 8, pp. 932–943, 2002.
[14] J. Rossignac and P. Borrel, “Multi-resolution 3D approxi-mations for rendering,” inModeling in Computer Graphics, B. Falcidieno and T. L. Kunii, Eds., pp. 455–465, Springer-Verlag, 1993.
[15] P. Cignoni, C. Rocchini, and R. Scopigno, “Metro: measuring error on simplified surfaces,” Computer Graphics Forum, vol. 17, no. 2, pp. 167–174, 1998.
[16] K. Inagaki, M. Okuda, M. Ikehara, and S.-I. Takahashi, “Measuring error on 3D meshes using pixel division,” in IEEE Workshop on Multimedia Signal Processing, pp. 281–286, Cannes, France, October 2001.
[17] J. D. Foley, A. van Dam, S. K. Feiner, and J. F. Hughes, Com-puter Graphics: Principles and Practice, Addison-Wesley, Read-ing, Mass, USA, 1992.
[18] M. Woo, J. Neider, T. Davis, and D. Shreiner, OpenGL Pro-gramming Guide, Addison-Wesley, Reading, Mass, USA, 3rd edition, 1999.
[19] V. Brimkov, R. Barneva, and P. Nehlig, “Minimally thin dis-crete triangulation,” inVolume Graphics, M. Chen, A. Kauf-man, and R. Yagel, Eds., pp. 51–70, Springer-Verlag, 2000.
Ph.D. degrees from Seoul National Univer-sity, Seoul, Korea in 1995, 1997, and 2001, respectively, all in electrical engineering and computer science. In September 2001, he joined the Samsung Advanced Institute of Technology, Yongin, Korea as a member of technical staff, where he has been involved in MPEG-4 standardization activities. Dr. Park’s research interests include the joint
area of 3D computer vision, computer graphics, and multimedia application, especially 3D shape reconstruction, image-based mod-eling and rendering, and 3D face modmod-eling and animation.
Kyoung Mu Leereceived his B.S. and M.S. degrees in control and instrumentation en-gineering from Seoul National University, Seoul, Korea in 1984 and 1986, respectively, and the Ph.D. degree in electrical engineer-ing from the University of Southern Cali-fornia, Los Angeles, in 1993. From 1993 to 1994, he was a Research Associate in the Sig-nal and Image Processing Institute at the University of Southern California. He was
with the Samsung Electronics Co. Ltd. at Suwon in Korea as a Se-nior Researcher from 1994 to 1995, where he worked on developing industrial real-time vision systems. In 1995, he joined the Depart-ment of Electronics and Electrical Engineering of the Hong-Ik Uni-versity in Seoul, Korea, where he is currently an Associate Profes-sor. Dr. Lee’s current primary research interests include computa-tional vision, shape from X, 2D, and 3D object recognition, human-computer interface, and visual navigation.
Sang Uk Leereceived his B.S. degree from Seoul National University, Seoul, Korea, in 1973, the M.S. degree from Iowa State Uni-versity, Ames in 1976, and Ph.D. degree from the University of Southern California, Los Angeles, in 1980, all in electrical engi-neering. From 1980 to 1981, he was with the General Electric Company, Lynchburg, VA, working on the development of digital mobile radio. From 1981 to 1983, he was a