Comparison of three measurement models of soil nitrate-nitrogen based
on ion-selective electrodes
Shangfeng Du
,
Qi Pan
,
Yun Xu
*,
Shushu Cao
(College of Information and Electrical Engineering, China Agricultural University, Beijing 100083, China)
Abstract: Ion-selective electrode (ISE) is a quick and low-cost method of soil nitrate nitrogen (N) detection. The measurement models of soil nitrate-N based on ISEs includes the linear regression model, multiple linear regression model and BP neural network model, and so on. Three models were analyzed in theory, measurement experiments of validation samples and soil nitrate-N concentrations were carried out in this study, and the measurement accuracies of the three models were compared. The results showed that, in the measurement experiments of validation samples and soil nitrate-N concentrations, BP neural network model had the highest accuracy (the average relative errors between results of the BP neural network model and the reference values were 5.07% and 8.81%, respectively) among the three models, multiple linear regression model had the second highest accuracy (the average relative errors between results of the multiple linear regression model and the reference values were 7.70% and 10.51%, respectively), linear regression model couldn’t exclude the interference of chloride ions so that it had the lowest accuracy (the average relative errors between results of the linear regression model and the reference values were 11.16% and 12.28%, respectively) among the three models. The BP neural network model can effectively restrain the interference of chloride ions, and it has a high accuracy for the measurement of soil nitrate-N concentration, so that the BP neural network model can be used to measure soil nitrate-N concentration accurately.
Keywords: ion-selective electrode, soil nitrate-nitrogen, measurement model, accuracy DOI: 10.25165/j.ijabe.20201301.3599
Citation: Du S F, Pan Q, Xu Y, Cao S S. Comparison of three measurement models of soil nitrate-nitrogen based on ion-selective electrodes. Int J Agric & Biol Eng, 2020; 13(1): 211–216.
1 Introduction
In recent years, the Chinese population has been increasing dramatically, but the arable land has been reducing year after year. Food security is facing the serious challenge. The Chinese government attaches great importance to this case under such a situation. Improving land productivity is the necessary way to improve the overall grain production capacity and it is also an important measure to guarantee food security[1].
Among many methods of agricultural increase yield, increasing fertilizer application is one of the most effective measures. Nitrogen (N) is an essential nutrient element of crops. The loss of N affects not only the yield of crops but also the quality of crops[2]. However, the excessive application of N fertilizer will
increase the content of nitrate-N and nitrite-N in plants[3], and some
of the N will remain in the soil and underground water in the form of nitrate which causes environmental pollution[4].
The content of nitrate-N in soil can reflect the N supply capacity of soil, so the detection of nitrate-N has important significance for economic and reasonable fertilization to increase crop yield, meanwhile, reduce the waste of resources and environmental pollution caused by excessive fertilization[5]. The
simple, rapid and low cost method is beneficial to the promotion of
Received date: 2018-06-26 Accepted date: 2019-12-16
Biographies: Shangfeng Du, PhD, Professor, research interests:detection and control technology, Email: [email protected]; Qi Pan, MS, research interests: Detection and control technology, Email: [email protected];
Shushu Cao, MS, research interests: Detection and control technology, Email: [email protected].
*Corresponding author: Yun Xu, PhD, Associate Professor, research interests: Detection and control technology. College of Information and Electrical Engineering, China Agricultural University, No.17, Qinghua East Road, Beijing 100083, China. Tel: +86-13141255052, Email: [email protected].
soil nitrate-N measurement technology[6]. The ion-selective
electrode (ISE) method is with simple operation, fast response speed, low cost, and little pollution[7-9], which provides technical
support for the detection of soil nitrate-N content.
There are many kinds of soil nitrate-N measurement models based on ISE. The choice of measurement model is one of the important factors affect nitrate nitrogen measurement precision. The traditional measurement model of soil nitrate-N is a linear regression model[10], which can be used to characterize the
relationship between reading of nitrate ISE and the concentration of nitrate ions. Because of the interference of chloride ion on the nitrate ISE[11,12], there are some multi-parameter measurement
models of the concentrations of chloride ions and nitrate ions. One of them is the multiple linear regression model, which reflects the linear relationships between ISEs and ion concentrations. The Back Propagation (BP) neural network has nonlinear mapping capability[13], which can map the relationship between the nitrate
ion concentration and the readings of nitrate ISE and chlorine ISE. This study analyzed the linear regression model, multiple linear regression model and BP neural network model, and used them to measure the soil nitrate-N concentrations. The measurement accuracies of three models were compared in order to find out the soil nitrate-N measurement model with the highest accuracy.
2 Theory background
2.1 Linear regression model
ISE is a kind of electrochemical sensor which can make specific potential response to target ions in solutions[4]. The
relationship between the electrode potential and the target ions is in accordance with the Nernst equation
lg 303 . 2
0
zF RT E
where, E is the potential difference of ISE, mV; E0 is the standard
potential of ISE, mV; R is the gas constant (J/K·mol), the ideal value is 8.314 J/K·mol; T is the absolute temperature, K; F is the Faraday constant (C/mol), the value is 96485 C/mol; z is electric charge number of the measured ion;αis the activity (concentration) of the measured ion.
Let
K
E
0, andzF RT S2.303 , then
lg
EK S C (2) where, K is the intercept of the electrode, mV; S is the slope of the electrode, mV/decade; C is the concentration of the measured ion, mol/L.
Using the least square method to estimate K and S, then the linear regression model between the electrode potential and the negative logarithm of the concentration of nitrate ions can be obtained.
2.2 Multiple linear regression model
ISE has responses not only to the specific ion but also to other interfering ions. The influence of interfering ions on the electrode can be described by the selectivity coefficient[14,15]. Nikolsky
modified the Nernst Equation and put forward a semi-empirical formula according to the influence of interfering ions. Eisenman et al. carried out the strict derivation and confirmation of this formula called Nikolsky-Eisenman equation described as Equation (3):
A A
B C
0 A A,B B A,C C
A
2.303 lg z z z
z
pot pot
RT
E E K K
z F
… (3)
where, αA, αB and αC are the ion activities of ion A to be measured,
interfering ion B and C, respectively; KA,Bpot ,
A,Cpot
K are the selectivity coefficients of B and C, respectively; zA, zB, zC are
electric charge numbers of A, B and C, respectively.
Chloride ion is the main interfering ion in soil nitrate-N measurement and the influences of other interfering ions are not so obvious so that they can be ignored. Therefore, Equation (3) can be simplified as a binary model that is described as Equation (4):
E=K+Slg(CNO-3+K
pot C
Cl-1) (4) where, CNO-3 is the concentration of nitrate ion, mol/L; CCl-1 is the
concentration of chloride ion; Kpot
is the selectivity coefficient of chloride ion.
Multiple regression analysis is a typical multivariate calibration method for multicomponent simultaneous determination. The relationship between the change of the electrode potential and the concentration of coexisting ions is a non-deterministic correlation. Let the logarithms of concentrations of the measured ion NO3- and the interfering ion Cl-be independent variables, and
nitrate ISE potential be the dependent variable. Assuming a linear relationship between the dependent variable and the independent variable, namely
0 1lgCNO3 2CCl
E (5) The following is the proof of the feasibility of using Equation (5) to estimate the coexistence ion concentration instead of Equation (4):
Expand Equations (4) and (5) according to two-order Taylor expansion. Under conditions of satisfying practical precision in engineering, both formulae can be expanded into the form of
Ax2+By2+Cx+Dy+E. In addition, in experiments of Mei[16] and
the experimental validation in this study, the results of the multiple linear regression model satisfied the precision requirements. Therefore, Equation (5) can substitute Equation (4).
Therefore, the multiple linear regression model can be described as
3
3
1 01 11 NO 21 Cl
2 02 12 NO 22 Cl
lg lg
lg lg
E C C
E C C
(6)
where, E1 is the detection potential of nitrate ISE, mV; E2 is the
detection potential of chloride ISE, mV.
Using the least square method to estimate regression parameters β01, β11, β21, β02, β12 and β22, then the multiple linear
regression model can be obtained.
Let
-3 1 lg CNO
X ,X2lgCCl- , and ˆ01, ˆ11, ˆ21, ˆ02,
12
ˆ
, ˆ22 be the least square estimates of the above parameters.
n groups of experimental data (X11, X21, E11, E21), (X12, X22, E12,
E22), …, (X1n, X2n, E1n, E2n) meets
1
1
1
, 1,2; 1,2, ,
1
, 1,2; 1,2, ,
n j ji i n j ji i
X X j i n
n
E E j i n
n
…… …… (7)where, X1i is the ith group of the logarithm of nitrate ion
concentration; X1 is the average value of the logarithm of nitrate
ion concentration; X2iis the ith group of the logarithm of chloride
ion concentration; X2 is the average value of the logarithm of
chloride ion concentration;
Let xjiXjiXj, ejiEjiEj, then
2
1 1 2 2 1 1 2
1 1 1 1
11 2
2 2
1 2 1 2
1 1 1
2
2 1 1 1 1 1 2
1 1 1 1
21 2
2 2
1 2 1 2
1 1 1
01 1 11 1 21 2
1
ˆ
ˆ
ˆ ˆ ˆ
ˆ
n n n n
i i i i i i i
i i i i
n n n
i i i i
i i i
n n n n
i i i i i i i
i i i i
n n n
i i i i
i i i
x e x x e x x
x x x x
x e x x e x x
x x x x
E X X
21 2 2 2 2 1 2
1 1 1 1
2 2
2 2
1 2 1 2
1 1 1
2
2 2 1 1 2 1 2
1 1 1 1
22 2
2 2
1 2 1 2
1 1 1
02 2 12 1 22 2
ˆ
ˆ ˆ ˆ
n n n n
i i i i i i i
i i i i
n n n
i i i i
i i i
n n n n
i i i i i i i
i i i i
n n n
i i i i
i i i
x e x x e x x
x x x x
x e x x e x x
x x x x
E X X
(8)2.3 BP neural network model
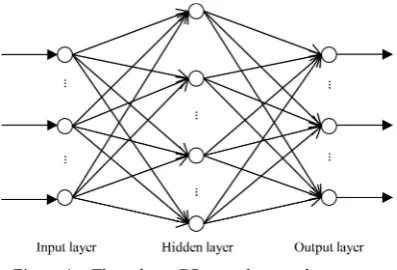
BP neural network, which is a multi-layer and feed-forward artificial neural network can perform non-linear mapping of an input space onto another output space without detailed information about the system[17,18]. It is composed of an input layer, a hidden
layer(s) and an output layer as described in Figure 1.
The BP neural network should be trained by training samples before used. The training of the BP neural network consists of two phases, forward propagation of signal and backward propagation of error[19]. In the forward phase, the signal is input
layer are revised from the output layer backwards to the first one based on the change of the total error, thus making error smaller. These two phases don’t stop operating alternately and repeatedly until the total error meets the requirement. After training, the weights and thresholds of each layer are determined so that data can be measured by the BP neural network[20]. It has been proved
theoretically that a three-layer BP neural network is able to approximate to any functions[21] as long as the hidden layer nodes
are sufficient, so a three-layer BP neural network was adopted as the measurement model.
Figure 1 Three-layer BP neural network structure It can be seen from Equation (3) that the relationship between the response potential of nitrate ISE and concentrations of nitrate ion and chloride ion is nonlinear. BP neural network has strong nonlinear mapping ability so that the trained BP neural network can reflect the relationship between the nitrate ISE response potential and concentrations of nitrate ion and chloride ion.
Because the standard BP neural network converges slowly and is easy to fall into local minimum, it is necessary to improve the convergence speed and accuracy of the model. The improved methods include the following several ones which are adaptive learning rate, adaptive adjustment error signal, adjusting the parameter of activation function, additional momentum method, normalization method[22-26].
In this study, the improved BP neural network used 2-4-1 structure, namely, the BP neural network was with two input neurons, four hidden neurons and one output neuron of three-layer structure. The inputs of the BP neural network model were potential difference U1 (mV) of nitrate ISE and potential difference U2 (mV) of chloride ISE, and the output data was concentration C (mol/L) of nitrate ion. The structure of this model could be described in Figure 2.
Figure 2 Structure of BP neural network model
3 Materials and methods
3.1 Materials
The devices and materials used in the experiment included 403FH type nitrate ion-selective composite electrodes, PCL-1-01 type chloride ISE and 217 type reference electrode, WL-15B type ion meter (Jiangsu Jiangfen Electroanalytical Instrument Co., Ltd. Nanjing, China), electronic analytical balance(FA2004C), digital
display thermostatic magnetic stirrer(85-2A/HJ-3), speed control multipurpose oscillator(HY-4A), vacuum circulating water pump (SHB-III), sodium nitrate and sodium chloride analytical reagent (AR grade), deionized water.
3.2 Methods
Standard solutions were prepared with deionized water, sodium nitrate and sodium chloride reagent. The preparations of the modeling samples and training samples were shown in Table 1. The modeling samples of the linear regression model were the zeroth group of samples in Table 1. The modeling samples of multiple linear regression model were the samples of group 1-3 in Table 1. The training samples of the BP neural network model were the samples of group 1-6 in Table 1. The concentrations of nitrate and chloride ions in the solutions of validation samples were shown in Table 2. The experiment was conducted at 25oC.
Table 1 Modeling solution preparation method
Group Number
Solution of NaCl Solution of NaNO3- Concentration
/mol·L-1 Volume /mL Concentration /mol·L-1 Volume /mL
0
0-1
0
50 2×10⁻⁴ 50
0-2 50 2×10⁻³ 50
0-3 50 2×10⁻² 50
1
1-1
2×10⁻⁵
50 2×10⁻⁴ 50
1-2 50 2×10⁻³ 50
1-3 50 2×10⁻² 50
2
2-1
2×10⁻⁴
50 2×10⁻⁴ 50
2-2 50 2×10⁻³ 50
2-3 50 2×10⁻² 50
3
3-1
2×10⁻³
50 2×10⁻⁴ 50
3-2 50 2×10⁻³ 50
3-3 50 2×10⁻² 50
4 4-1 2×10⁻⁵ 50 1×10⁻³ 50
4-2 50 1×10⁻² 50
5 5-1 2×10⁻⁴ 50 1×10
-3 50
5-2 50 1×10⁻² 50
6 6-1 2×10⁻³ 50 1×10
-3 50
6-2 50 1×10⁻² 50
Table 2 Concentration of validation solution
Number Concentration/mol·L
-1
NO3- Cl-
Sample 1 1×10⁻⁴ 5×10⁻⁵
Sample 2 1×10⁻³ 5×10⁻⁵
Sample 3 1×10⁻² 5×10⁻⁵
Sample 4 1×10⁻⁴ 5×10⁻⁴
Sample 5 1×10⁻³ 5×10⁻⁴
Sample 6 1×10⁻² 5×10⁻⁴
Sample 7 5×10⁻⁴ 5×10⁻⁵
Sample 8 5×10⁻³ 5×10⁻⁵
Sample 9 5×10⁻⁴ 5×10⁻⁴
Sample 10 5×10⁻³ 5×10⁻⁴
Sample 11 2.5×10⁻⁴ 2.5×10⁻⁵
Sample 12 2.5×10⁻³ 2.5×10⁻⁵
Sample 13 2.5×10⁻⁴ 2.5×10⁻⁴
Sample 14 2.5×10⁻³ 2.5×10⁻⁴
Sample 15 1×10⁻⁴ 2.5×10⁻⁵
and reference electrode were connected to the ion meter (Figure 4). The electrode potentials of the first to third groups of modeling samples in Tab 1 were detected by the ion meter successively, and the multiple linear regression model was established. As well as connect the nitrate ISE, chlorine ISE, reference electrode and the ion meter (Figure 4). The electrode potentials of the first to sixth groups of modeling samples in Tab 1 were detected by the ion meter successively and the BP neural network model was trained. A magnetic stirrer was used to stir the solutions in the measuring process. After measuring each solution, electrodes were cleaned by using deionized water and dried by using filter paper.
The electrode potentials in the mixed solutions of the sample 1-15 were detected successively, and the three models were verified and compared.
a b
Figure 3 Detecting electrode schematic for the linear regression model (a) and multiple regression and BP network model (b)
The places, where these 50 soil samples were selected from, were Tongzhou in Beijing, Baiwang Mountain in Beijing, Olympic Forest Park in Beijing, Yichang City in Hubei Province, and Anyang City in Henan Province. These soil samples were collected from September to November in 2016. The soil samples were dried in an oven under 105oC for 8 hours. After that, the soil
samples after dried were crushed by using a stick, and sieved using a sieve with 1 millimeter screen mesh. After sieved, the soil samples were divided into two parts and labeled respectively. One part of the samples was sent to Beijing Center for Physical and Chemical Analysis (BCPCA) in China and detected by using the spectrophotometric method, and the other part of samples were detected by ISEs in the laboratory.
Fifty 30 g dry soil samples were weighed and added into fifty 250 mL Erlenmeyer flasks. 150 mL deionized water was added to each flask. The flasks were capped, and shaken for 20 min on a
horizontal oscillator. The mixture in each Erlenmeyer flask was poured into a filter device and the leachate was collected in an Erlenmeyer flask under the filter device.
Electrode potentials in leaching solutions of soil samples were detected by ion meter. Concentrations of nitrate ions in leaching solutions were calculated by the linear regression model, multiple linear regression model and BP neural network model respectively, and they were compared with values detected by the spectrophotometric method in BCPCA.
The nitrate ion concentrations calculated by three models above were converted to soil nitrate-N concentrations according to the Equation (9).
RNO-3 =CNO-3×14×10
3×5 (9)
where, RNO-3 is the mass ratio of nitrate-N to soil, mg/kg; 14×10
3
is the quality of one mole of N, mg/mol; 5 is water soil ratio, L/kg.
4 Results and discussion
According to the detection results of the modeling samples, a linear regression model and multiple linear regression model were established. According to the detection results of the training samples, the BP neural network model was trained. The detection results of validation samples were analyzed and accuracies of three models were compared.
The linear regression model was obtained by the linear fitting calculation of the detection results of the zeroth group of sodium nitrate solutions:
E=12.167–56.7lgCNO-3 (10)
The multiple linear regression model was obtained by the linear fitting calculation of the detection results of the first to third groups of mixed solutions:
3
3
1 NO Cl
2 NO Cl
46.01417 1.556667lg 46.6375lg
22.63167 35.06lg 3.775lg
E C C
E C C
(11)
The BP neural network model was trained with the detection results of the first to sixth groups of mixed solutions.
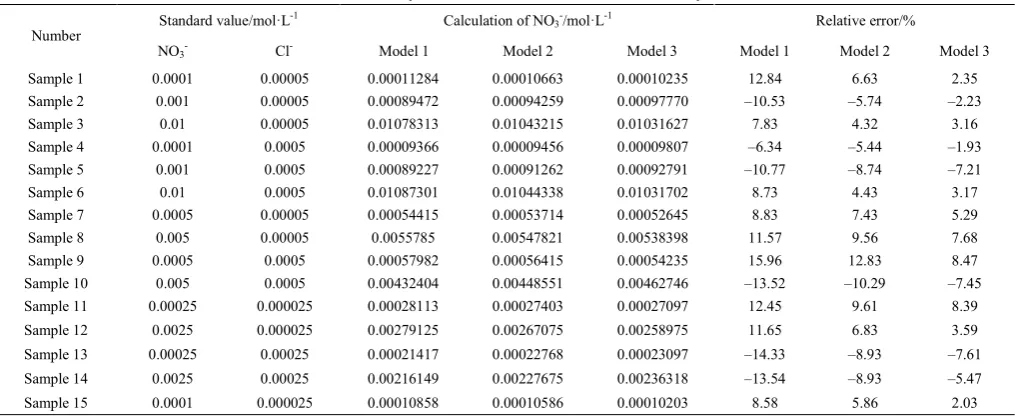
Electrode potential values of Sample 1-15 of the validation sample solutions were plugged into the linear regression model (model 1), multiple linear regression model (model 2) and BP neural network model (model 3), and then the nitrate ion concentrations were obtained. The relative errors between these calculation values by three models and the reference values were analyzed and compared. The results were shown in Table 3.
Table 3 Contrastive Analysis of ion concentrations measured by three models
Number Standard value/mol·L
-1 Calculation of NO
3-/mol·L-1 Relative error/%
NO3- Cl- Model 1 Model 2 Model 3 Model 1 Model 2 Model 3
Sample 1 0.0001 0.00005 0.00011284 0.00010663 0.00010235 12.84 6.63 2.35
Sample 2 0.001 0.00005 0.00089472 0.00094259 0.00097770 –10.53 –5.74 –2.23
Sample 3 0.01 0.00005 0.01078313 0.01043215 0.01031627 7.83 4.32 3.16
Sample 4 0.0001 0.0005 0.00009366 0.00009456 0.00009807 –6.34 –5.44 –1.93
Sample 5 0.001 0.0005 0.00089227 0.00091262 0.00092791 –10.77 –8.74 –7.21
Sample 6 0.01 0.0005 0.01087301 0.01044338 0.01031702 8.73 4.43 3.17
Sample 7 0.0005 0.00005 0.00054415 0.00053714 0.00052645 8.83 7.43 5.29
Sample 8 0.005 0.00005 0.0055785 0.00547821 0.00538398 11.57 9.56 7.68
Sample 9 0.0005 0.0005 0.00057982 0.00056415 0.00054235 15.96 12.83 8.47
Sample 10 0.005 0.0005 0.00432404 0.00448551 0.00462746 –13.52 –10.29 –7.45
Sample 11 0.00025 0.000025 0.00028113 0.00027403 0.00027097 12.45 9.61 8.39
Sample 12 0.0025 0.000025 0.00279125 0.00267075 0.00258975 11.65 6.83 3.59
Sample 13 0.00025 0.00025 0.00021417 0.00022768 0.00023097 –14.33 –8.93 –7.61
Sample 14 0.0025 0.00025 0.00216149 0.00227675 0.00236318 –13.54 –8.93 –5.47
As seen from Table 3, the maximum relative error of nitrate ion concentration calculated by the linear regression model (model 1) reached 15.96%; the maximum relative error of nitrate ion concentration calculated by the multiple linear regression model (model 2) was 12.83%; while the maximum relative error of nitrate ion concentration calculated by the BP neural network model (model 3) was 8.47%. In addition, the average relative errors of nitrate ion concentration calculated by three models were 11.16%, 7.70% and 5.07% respectively after calculation. To sum up, in comparison of the three models, the BP neural network model effectively reduced the interference of chloride ion and had the highest accuracy, the accuracy of the multiple linear regression model came to the second, and the linear regression model had the lowest accuracy.
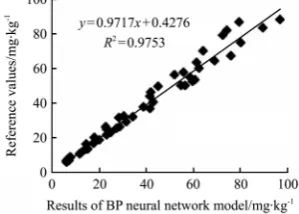
The electrode potentials of the leaching solutions of soil samples were plugged into three models, and then the nitrate ion concentrations were obtained. Soil nitrate-N concentrations were calculated by Equation (9) with the nitrate ion concentrations as the inputs. The calculated values of the three models were taken as the abscissa and results of the spectrophotometric method (reference values) were taken as the ordinate. The linear fitting was performed and fitting results were shown in Figures 4-6.
Figure 4 Linear fitting between results of BP neural network model and reference values
Figure 5 Linear fitting between results of multiple linear regression model and reference values
Figure 6 Linear fitting between results of the linear regression model and reference values
The average relative errors of the BP neural network model, multiple linear regression model and linear regression model were
8.81%, 10.51% and 12.28% by calculation respectively. From Figure 3 to Figure 5, it could be known that the results of three models had good linear correlations with the reference values respectively, and three coefficients of determination were all bigger than 0.96. Therefore, it could be seen that the BP neural network model was the most accurate model to measure the soil nitrate-N concentration among the three models, the accuracy of the multiple linear regression model was the second, and the linear regression model had the lowest accuracy. The BP neural network model can effectively restrain the interference of chloride ions on the nitrate ISE and it can be used to measure soil nitrate-N concentrations accurately.
5 Conclusions
Measurement experiments of nitrate-N were carried out by using a linear regression model, multiple linear regression model and an improved BP neural network model, and the measurement accuracies of the three models were compared and analyzed. Results showed that the average relative errors of validation sample solutions measured by three models were 11.16%, 7.70% and 5.07%, respectively, the average relative errors of the measurement of soil samples were 12.28%, 10.51% and 8.81%, respectively, and the determination coefficient between values calculated by three models and reference values measured by spectrophotometry method were all greater than 0.96. The accuracy of the BP neural network model was the highest among the three models’, the multiple linear regression model had the second highest accuracy and the accuracy of the linear regression model was the lowest. The BP neural network model can effectively restrain the interference of coexisting chloride ions, and can be used for accurate measurement of soil nitrate-N.
Acknowledgements
The research was supported by the key project of the National Natural Science Foundation of China (61134011).
[References]
[1] Huang J. China's agricultural and rural development in the 21st century. Beijing: China Agriculture Press, 2006; pp.334–336. (in Chinese)
[2] Zhou J. Determination and analysis of soil nitrogen concentration. Information of Agricultural Science and Technology, 2008; 15: 40–41. (in Chinese)
[3] Li S J. Brief analysis on function of nitrogen fertilizer in agricultural production and current existing questions. Heilongjiang Agricultural Sciences, 2010; 1: 41–44. (in Chinese)
[4] Zhang M, Ang S S, Nguyen V C, Li L. Rapid nitrate detection system based on ion selective electrode. Transactions of the CSAE, 2009; 25(Supp. 2): 235–239. (in Chinese)
[5] Giles J F, Reuss J O, Ludwick A E. Prediction of nitrogen status of sugar beet by soil analysis. Agronomy Journal, 1975; 67(4): 454–459. [6] Du S F, Cao S S, Pan Q, Zhu Y. Study on interference factors and
measurement model of soil nitrate-nitrogen detection based on ion selective electrode. Transactions of the CSAM, 2016; 47(9): 171–179. (in Chinese) [7] Zhang L N, Zhang M, Ren H Y, Pu P, Kong P. Feasibility of rapid detection of soil nitrate-nitrogen content using Superfloc127 in ion-selective electrode. Transactions of the CSAE, 2015; 31(Supp1): 196–204. (in Chinese)
[8] Tully K L, Weil R. Ion-selective electrode offers accurate, inexpensive method for analyzing soil solution nitrate in remote regions. Communications in Soil Science and Plant Analysis, 2014; 45(14): 1974–1980.
[9] Claudio Z, Dermot D. Opportunities and challenges of using ion-selective electrodes in environmental monitoring and wearable sensors. Electrochimica Acta, 2012; 84(1): 29–34.
investigation on soil nitrate-nitrogen and available potassium measurement capability by using solid-state and PVC ISE. Computers and Electronics in Agriculture, 2014; 112: 83–91. (in Chinese)
[11] Francesco D G, Eric H S, Maria G, Pietro S, Aparna G, Zenyth S. Assessment of ionic interferences to nitrate and potassium analyses with ion-selective electrodes. Communications in Soil Science and Plant Analysis, 2010; 41(14): 1750–1768.
[12] Huang L. Determination of nitrate nitrogen in water by ion selective electrode method. Chinese Journal of Public Health, 1999; 15(3): 220–220. (in Chinese)
[13] Sun X D, Zhang H L, Liu Y D. Nondestructive assessment of quality of Nanfeng mandarin fruit by a portable near infrared spectroscopy. Int J Agric & Biol Eng, 2009; 2(1): 65–71.
[14] Chang Z K. Research and development of a prototype of instrument for soil nitrate measurement based on ion selective electrode. China Agricultural University, 2014. (in Chinese)
[15] Du S F, Cao S S, Pan Q, Zhu Y, Feng L. Improving accuracy of soil nitrate-nitrogen detection based on ion selective electrode. Transactions of the CSAM, 2016; 47(1): 118–125. (in Chinese)
[16] Mei D. Studies on simultaneous determination of multicomponent by ion-selective electrodes analytical method. Tianjin University, 2005. (in Chinese)
[17] Jin W L, Zhou M Y. Study on calibration of binocular stereovision based on BP neural network with different layers. Optical Technique, 2015; 41(1): 72–76. (in Chinese)
[18] Li S K, Suo X M, Bai Z Y, Qi Z L, Liu X H, Gao S J, et al. The machine recognition for population feature of wheat images based on BP neural network. Journal of Integrative Agriculture, 2002; 1(8): 885–889. [19] Pau M, María G, Pablo G. An artificial neural network approach to the
estimation of stem water potential from frequency domain reflectometry soil moisture measurements and meteorological data. Computers and Electronics in Agriculture, 2013; 91: 75–86.
[20] Li T, Zhang M, Ji Y H, Sha S, Jiang Y Q, Li M Z. Management of CO2 in a tomato greenhouse using WSN and BPNN techniques. Int J Agric & Biol Eng, 2015; 8(4): 43–51.
[21] Sun B Q, Pan Q S, Feng Y J, Zhang C S. Research on improving the training speed of BP network. Journal of Harbin Institute of Technology, 2001; 4: 439–441. (in Chinese)
[22] Sun W W. Study on Improved Algorithm and Application of BP Neural Network. Chongqing University, 2009. (in Chinese)
[23] Deng J, Yang J M. An improvement of learning algorithm for BP neural network. Journal of Donghua University, 2005; 31(3): 123–126. (in Chinese)
[24] Haruhiko T, Hidehiko K, Terumine H. Partially weight minimization approach for fault tolerant multilayer neural networks. International Joint Conference on Neural Networks, 2002; 2: 1092–1096.
[25] Liu T S. The Research and Application on BP Neural Network Improvement. Northeast Agricultural University, 2011. (in Chinese) [26] Zhao X M. Controlling the platform phenomenon in BP neural network