Geosci. Instrum. Method. Data Syst., 1, 221–227, 2012 www.geosci-instrum-method-data-syst.net/1/221/2012/ doi:10.5194/gi-1-221-2012
© Author(s) 2012. CC Attribution 3.0 License.
RGB
Geoscientific
InstrumentationMethods and
Data Systems
Discussions
Geoscientific
InstrumentationMethods and
Data Systems
Open
Access
Review article
“Geo-neutrinos”
L. Ludhova
Istituto Nazionale di Fisica Nucleare, via Celoria 16, 20133 Milan, Italy Correspondence to: L. Ludhova ([email protected])
Received: 23 July 2012 – Published in Geosci. Instrum. Method. Data Syst. Discuss.: 3 August 2012 Revised: 29 October 2012 – Accepted: 30 October 2012 – Published: 10 December 2012
Abstract. Geo-neutrinos, electron anti-neutrinos produced in β-decays of naturally occurring radioactive isotopes in the Earth, are a unique direct probe of our planet’s interior. After a brief introduction about the Earth (mostly for physicists) and the very basics about the neutrinos and anti-neutrinos (mostly for geologists), I describe the geo-neutrino proper-ties and the main aims of their study. An overview of the lat-est experimental results obtained by KamLAND and Borex-ino experiments is provided. A short overview of future per-spectives of this new inter-disciplinary field is given.
1 Introduction
The introduction is divided into three parts. First, the struc-ture, composition, and sources of information about the Earth are described. It is a short summary meant mostly for physi-cists. Secondly, the basic physics of neutrinos and anti-neutrinos, relevant for the geo-neutrino studies, is described. This part is meant mostly for geologists. The last part of the introduction finally describes the geo-neutrinos, their proper-ties, and the importance of their study.
1.1 The Earth (mostly for physicists)
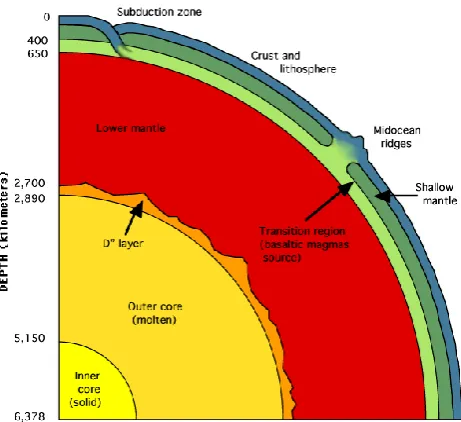
It is assumed that the Earth was created via accretion as an homogeneous object. The metallic core (3500 km radius) was the first to separate from the silicate primordial mantle, which further differentiated into the current mantle (3000 km thick-ness) and the crust (5 to 75 km). The Fe-Ni metallic core, with up to∼10 % admixture of lighter elements, has a tem-perature range from 4100 to 5800 K. Its central part, inner core with the radius∼1300 km, is solid due to high pres-sure. The 2200-km-thick outer core is liquid and has a key
role in the geodynamo process generating the Earth’s mag-netic field. The D00layer is a core–mantle boundary, a 200-km-thick seismic discontinuity of unclear origin. The lower mantle (2000 km) with a temperature gradient from 600 to 3700 K is solid, but viscose on long time scales. It is in-volved in the convection driving the movement of tectonic plates with a speed of few centimeters per year. A transition zone in the depth of 400–600 km is a seismic discontinuity due to mineral recrystallization. The upper mantle contains viscose asthenosphere, on which are floating the lithospheric tectonic plates. These comprise the uppermost, rigid part of the mantle and the crust of two types: oceanic and continen-tal. The continental crust (30 km average thickness) has the most complex history being the most differentiated and het-erogeneous, consisting of igneous, metamorphic, and sedi-mentary rocks. The oceanic crust (5–10 km) is created along the mid-oceanic ridges where the basaltic magma differenti-ates from the partially melting mantle. A schematic profile of the Earth’s structure can be found in Fig. 1.
Information about the Earth’s interior composition has in-sofar come exclusively from indirect probes. Geophysics, studying the propagation of mechanical waves through the Earth, constrains the density profile and the phase state. Geo-chemistry has limited sources of direct data as well and de-velops models of the Earth’s bulk composition based on in-direct information. The deepest drill hole ever made (12 km, Kola, Russia) represents enormous technical difficulties, but is negligible with respect to the Earth’s radius of∼6400 km. Some geological processes bring the deep rocks to the sur-face (volcanism, obduction, xenolith...), but their chemical composition can be altered during the transport and the deep mantle is completely unreachable. Similar trends of relative abundances of chemical elements in meteorites and in the
222 L. Ludhova: Geo-neutrinos
2
Livia Ludhova: Geo–neutrinos
Fig. 1. A schematic profile of the Earth structure (from
http://www.homepages.ucl.ac.uk/ ucfbdxa/resint.htm). Details in the text.
tion of the primitive mantle. The BSE model therefore
de-scribes the composition of the silicate Earth, the mean
com-70
position of the Earth after the metallic core separation and
be-fore the crust–mantle differentiation. Several authors
devel-oped such models, e. g. (Turcotte and Schubert, 2002),
(An-derson, 2007), (Palme and O’Neill, 2003), (Allegre et al.,
1995), (McDonoough et al., 1995), (Lyubetskaya and
Kore-75
naga, 2007), and (Javoy et al., 2010). The predictions of the
absolute abundances of the long–lived radioactive elements
producing geo–neutrinos differ up to a factor of 2-3, while
the predictions of their relative proportions are in a much
bet-ter agreement within 10%.
80
The total terrestrial surface heat flux is deduced from
the temperature–gradient measurements along
∼
40,000 drill
holes distributed around the world. It is important to note
that these drill holes are not distributed homogeneously, they
are concentrated mostly on the continental crust, while
al-85
most missing in the hottest regions along the mid–ocean
ridges. Using these temperature gradient data, geophysical
models typically conclude that the present surface heat flux
is
47
±
2
TW (Davies and Davies, 2010). This conventional
view has been challenged by an alternative flux estimate of
90
31
±
1 TW (Hofmeister and Criss, 2004) and other authors
predict 44 TW (Pollack et al., 1993). Such big discrepancies
indicate that some systematic errors or model assumptions
are out of the control.
There are several possible sources contributing to the total
95
terrestrial surface heat flux but the radiogenic heat is
gener-ally considered as the main contribution to the total heat
bud-get. The main long–lived radioactive elements producing this
radiogenic heat are
238U,
232Th, and
40K. The range of the
BSE models predicting the Th, U, and K abundances
trans-100
lates to radiogenic heat contributions of 12 - 30 TW (crust
+ mantle). Typically, based on geophysical calculations,
pa-rameterized convection models of the mantle require higher
radiogenic heat contributions (
∼
70 % of the total heat flux)
in order to describe the Earth’s cooling history in terms of
105
a balance of forces between thermal dissipation and
man-tle viscosity. Consequently, a geochemist’s view of the Earth
predicts that its budget of heat producing elements in the BSE
are up to a factor of
∼
3 lower than the models predicted by
geophysicists (Wurm et al., 2012). Thus, the relative
contri-110
bution of the radioactive power to the total planetary heat flux
is poorly known. No contribution is expected from the core.
Thorium and uranium are refractory lithophile elements and
contribute equally
∼
80 % of the total radiogenic heat
pro-duction of the Earth, while the remaining fraction is due to
115
40
K, a volatile element (assuming Th
/
U
∼
4 and K
/
U
∼
10
000) (Wurm et al., 2012). During mantle melting and
be-cause of their chemistry and size, K, Th, and U are
quanti-tatively partitioned into the melt and depleted from the
man-tle. Thus, the continental crust, has over geologic time, been
120
enriched in these elements and has a sizable fraction (about
half) of the planet’s inventory, producing radiogenic power
of 7.3
±
1.2 TW (Rudnick and Gao, 2003). The main
un-known remain the abundances of the long–lived radioactive
elements and the radiogenic heat produced in the mantle.
125
It is possible that additional heat sources contribute to the
total surface heat flux (estimated based on the temperature
gradient measurements). Such additional heat might
orig-inate from accretion, gravitational contraction, latent heat
from phase transitions, or from a (rather exotic) nuclear
re-130
actor in the core/core-mantle boundary (Herndon, 1996) or
presence of
40K in the metallic core (Murthy, 2003). It can
be concluded, that systematic errors in both geochemical and
geophysical models are not very well known and the validity
of several assumptions on which they are based is not proven.
135
Therefore, any new, independent source of information about
the Earth’s heat sources are needed.
1.2
Neutrinos and anti–neutrinos (mostly for geologists)
Neutrinos (
ν
) and their anti–particles, anti–neutrinos (
ν
¯
), are
the fundamental elementary particles belonging to the
fam-140
ily of leptons. In contrast to charged leptons (electron, muon,
and tau particles with negative electric charge and their
pos-itively charged anti–particles), they have no electric charge,
so they do not interact via electromagnetic forces. All
lep-tons do not interact via strong interactions. Neutrinos and
145
anti–neutrinos, being neutral leptons, can interact only via
weak interactions, making the probability of their
interac-tion along their passage through matter very rare. The so
called cross-section of their weak interactions with matter
is of the order of 10
−44cm
2to 10
−43cm
2. It means, that
150
neutrinos and anti–neutrinos, once detected, can bring to the
observer undisturbed information about the region of their
production. The same low probability of interaction makes
these particles extremely difficult to detect and often huge
Fig. 1. A schematic profile of the Earth’s structure (available at: http://www.homepages.ucl.ac.uk/∼ucfbdxa/resint.htm). Details in the text.
Sun’s photosphere indicate that the solar system developed from a chemically homogeneous nebula. Assuming these trends for the primordial Earth as well as rock melting trends, which produced the current rocks, the Bulk Silicate Earth (BSE) model was developed, describing the composition of the primitive mantle. The BSE model therefore describes the composition of the silicate Earth, the mean composition of the Earth after the metallic core separation and before the crust–mantle differentiation. Several authors developed such models, e.g. Turcotte and Schubert (2002); Anderson (2007); Palme and O’Neill (2003); Allegre et al. (1995); Mc-Donough and Sun (1995); Lyubetskaya and Korenaga (2007) and Javoy et al. (2010). The predictions of the absolute abun-dances of the long-lived radioactive elements producing geo-neutrinos differ up to a factor of 2–3, while the predictions of their relative proportions are in a much better agreement within 10 %.
The total terrestrial surface heat flux is deduced from the temperature-gradient measurements along∼40 000 drill holes distributed around the world. It is important to note that these drill holes are not distributed homogeneously; they are concentrated mostly on the continental crust, while al-most missing in the hottest regions along the mid-ocean ridges. Using these temperature-gradient data, geophysical models typically conclude that the present surface heat flux is 47±2 TW (Davies and Davies, 2010). This conventional view has been challenged by an alternative flux estimate of 31±1 TW (Hofmeister and Criss, 2004), and other authors predict 44 TW (Pollack et al., 1993). Such big discrepancies indicate that some systematic errors or model assumptions are out of the control.
There are several possible sources contributing to the to-tal terrestrial surface heat flux, but the radiogenic heat is generally considered as the main contribution to the total heat budget. The main long-lived radioactive elements pro-ducing this radiogenic heat are 238U,232Th, and40K. The range of the BSE models predicting the Th, U, and K abun-dances translates into radiogenic heat contributions of 12– 30 TW (crust + mantle). Typically, based on geophysical cal-culations, parameterized convection models of the mantle re-quire higher radiogenic heat contributions (∼70 % of the to-tal heat flux) in order to describe the Earth’s cooling history in terms of a balance of forces between thermal dissipation and mantle viscosity. Consequently, a geochemist’s view of the Earth predicts that its budget of heat producing elements in the BSE are up to a factor of ∼3 lower than the mod-els predicted by geophysicists (Wurm et al., 2012). Thus, the relative contribution of the radioactive power to the to-tal planetary heat flux is poorly known. No contribution is expected from the core. Thorium and uranium are refractory lithophile elements and contribute equally∼80 % of the total radiogenic heat production of the Earth, while the remaining fraction is due to40K, a volatile element (assuming Th/U
∼4 and K/U∼10 000) (Wurm et al., 2012). During mantle melting and because of their chemistry and size, K, Th, and U are quantitatively partitioned into the melt and depleted from the mantle. Thus, the continental crust has, over geo-logic time, been enriched in these elements and has a sizable fraction (about half) of the planet’s inventory, producing ra-diogenic power of 7.3±1.2 TW (Rudnick and Gao, 2003). The main unknowns remain the abundances of the long-lived radioactive elements and the radiogenic heat produced in the mantle.
It is possible that additional heat sources contribute to the total surface heat flux (estimated based on the temperature gradient measurements). Such additional heat might orig-inate from accretion, gravitational contraction, latent heat from phase transitions, or from a (rather exotic) nuclear re-actor in the core/core–mantle boundary (Herndon, 1996) or presence of40K in the metallic core (Murthy et al., 2003). It can be concluded that systematic errors in both geochemical and geophysical models are not very well known and the va-lidity of several assumptions on which they are based is not proven. Therefore, any new, independent sources of informa-tion about the Earth’s heat sources are needed.
1.2 Neutrinos and anti-neutrinos (mostly for geologists)
Neutrinos (ν) and their anti-particles, anti-neutrinos (ν¯), are the fundamental elementary particles belonging to the fam-ily of leptons. In contrast to charged leptons (electron, muon, and tau particles with negative electric charge and their posi-tively charged anti-particles), they have no electric charge, so they do not interact via electromagnetic forces. All leptons do not interact via strong interactions. Neutrinos and anti-neutrinos, being neutral leptons, can interact only via weak
L. Ludhova: Geo-neutrinos 223
interactions, making the probability of their interaction along their passage through matter very rare. The so-called cross-section of their weak interactions with matter is of the order of 10−44cm2to 10−43cm2. It means that neutrinos and anti-neutrinos, once detected, can bring to the observer undis-turbed information about the region of their production. The same low probability of interaction makes these particles ex-tremely difficult to detect, and often huge multi-ton detectors placed in underground laboratories in order to shield them from the cosmic radiation are required for (anti-)neutrino de-tection.
Both neutrinos and anti-neutrinos exist in three types, so-called flavors: electron, muon, and tau. Each flavor is a lin-ear combination of 3 so-called mass eigenstates, labeled sim-ply 1, 2, and 3, each flavor in characteristic proportions of 3 mass eigenstates. The dominant neutrino flux on the Earth comes from the neutrinos produced in electron flavor in the nuclear reactions powering the Sun: the flux of about 1011cm−2s−1with energies mostly below 15 MeV. Neutri-nos are usually detected via elastic scattering off electrons. The dominant sources of electron anti-neutrino fluxes on the Earth’s surface are the Earth itself (geo-neutrinos with ener-gies below 3.5 MeV) and the nuclear power plants producing anti-neutrinos with energies up to 10 MeV. Geo-neutrinos are electron flavor anti-neutrinos, produced inβ-decays of40K and of several nuclides in the chains of long-lived radioac-tive isotopes238U and232Th, which are naturally present in the Earth. Their typical flux on the Earth’s surface is about 106cm−2s−1. Electron flavor anti-neutrinos are detected via the inverse neutronβ-decay reaction,
¯
νe+p→e++n, (1)
with a kinematic threshold of 1.806 MeV.
Both neutrinos and anti-neutrinos are very light particles, and therefore they propagate with the velocity very close to that of light. During their passage, the neutrino and/or anti-neutrino is represented as a mixture of 3-mass eigen-states with periodically evolving proportions. Therefore, the (anti-)neutrino, which was produced in an interaction charac-terizing it as being of a certain flavor, can be later on detected as an (anti-)neutrino of the same or of a different flavor. For electron anti-neutrino, the probability to be detected again as electron anti-neutrino oscillates according to
Pee=cos4θ13(1−sin2(2θ12)sin2(1m212L/4E))
+sin4θ13, (2)
whereθ12andθ13are the mixing parameters, so-called mix-ing angles, 1m212 a difference of the squares of masses of mass eigenstates 1 and 2, while E is the anti-neutrino en-ergy andLis the source-detectors distance. As we can see, for an anti-neutrino of a certain energy, thePeechanges with
distanceL. For a 3-MeV anti-neutrino (about the end-point of the geo-neutrino spectrum and the peak energy of reac-tor neutrinos), the oscillation length is of∼100 km. There-fore, for geo-neutrinos originating from a continuous source
of few thousands of kilometers (the Earth’s mantle and crust), the oscillation pattern cannot be distinguished on the en-ergy spectrum of detected geo-neutrinos and one can con-sider only the reduction of the total flux by 1−Pee with Pee=0.551±0.015 (Fiorentini et al., 2012). For
consider-ing the spectral shape of reactor anti-neutrinos, the oscilla-tion pattern has to be taken into account.
1.3 Geo-neutrinos
Geo-neutrinos (geo-ν¯e), electron anti-neutrinos (ν¯e), are
pro-duced in β-decays of 40K and of several nuclides in the chains of long-lived radioactive isotopes 238U and 232Th, which are naturally present in the Earth:
238U→206Pb+8α+6e−+6ν¯
e+51.7 MeV; (3)
232Th→208Pb+6α+4e−+4¯
νe+42.8 MeV; (4)
40K→40Ca+e−+ ¯
νe+1.32 MeV. (5)
The Earth shines in geo-neutrinos with a flux of about 106cm−2s−1. It is important to note that the ratio of the re-leased radiogenic heat and the geo-neutrino flux is in a well-fixed and known ratio. Therefore, it is in principle possible to determine the amount of the radiogenic heat contributing to the total terrestrial surface heat flux (Urey ratio) by mea-suring the geo-neutrino flux. By meamea-suring the geo-neutrino flux at different locations through the globe, in different geo-logical settings and/or by being able to identify the incoming direction of detected geo-neutrinos, it might be possible to
– study the distribution of radioactive elements within the
Earth, to determine their abundances in the crust and in the mantle;
– determine if there are radioactive elements in the Earth’s
core;
– understand if the mantle composition is homogeneous
or not;
– test, validate, and discriminate among different BSE
models;
– exclude or confirm the presence of the geo-reactor in the
core;
– determine the so-called Urey ratio by measuring the
ra-diogenic heat flux, an important parameter for both geo-chemistry and geophysics;
– to study the bulk U and Th ratio in the silicate Earth, an
important parameter for geochemistry that could shed light on the process of the Earth’s formation.
224 L. Ludhova: Geo-neutrinos
We can see that geo-neutrinos can be used as a unique di-rect probe of the Earth’s interior, not accessible by any other means. All this information could be important data used as inputs for many geological, geophysical, and geochemi-cal models describing such complex processes as the man-tle convection, movement of tectonic plates, geodynamo (the process of the generation of the Earth’s magnetic field), and the process of the Earth’s formation, etc.
The energy spectrum of geo-neutrinos extends to about 3.3 MeV. They are detected via the inverse neutronβ-decay reaction described above; see Eq. (1) which has a kinematic threshold of 1.806 MeV. The cross section of this interaction as a function of anti-neutrino energy is well known and can be found in Strumia and Vissani (2003). Unfortunately, all geo-neutrinos produced in the decay of40K are below this threshold and we are able to detect only the high-energy tail of the238U and232Th geo-neutrinos. Geo-neutrinos from the
232Th chain have the end point of their energy spectrum at
about 2.25 MeV while those from the238U chain extend up to 3.3 MeV. Ideally, this spectral feature could be used in order to measure the U and Th ratio in the Earth. It is im-portant to recall that the relative proportions of the elements abundances are much better known than their absolute abun-dances. Therefore, by measuring the absolute abundances of
238U and232Th, the absolute abundance of 40K can be
de-duced with a better precision.
2 Latest geo-neutrino experimental results
There are only two running experiments able to measure geo-neutrinos: Borexino located at Laboratori Nazionali del Gran Sasso in central Italy and KamLAND in Kamioka mine in Japan. Both experiments are large volume scintil-lator detectors placed in the underground in order to shield from cosmic rays. Both experiments detect geo-neutrinos via the inverse beta decay reaction; see Eq. (1) in which anti-neutrino interacts with a free proton (hydrogen nucleus) and a positron and a neutron are the reaction products. The positron promptly comes to rest and annihilates emitting two 511 keVγ-rays, yielding a prompt event, with a visible en-ergyEpromptdirectly correlated with the energy of incident anti-neutrinoEν¯e:
Eprompt=Eν¯e−0.784 MeV. (6)
The free neutron emitted is typically captured on protons with a mean time ofτ ∼200−−250 µs, resulting in the emis-sion of a 2.22-MeV de-excitation γ-ray, which provides a coincident delayed event. The characteristic time and spatial coincidence of prompt and delayed events offers a clean sig-nature ofν¯edetection.
The knownν¯esources are geo-ν¯eand reactorν¯e, while
at-mospheric and supernova relicν¯es give a negligible
contribu-tion. A detailed analysis of the expected reactor anti-neutrino rate is necessary for both experiments. The determination of
the expected signal from reactorν¯es requires the collection
of the detailed information on the time profiles of the ther-mal power and nuclear fuel composition for nearby reactors. In Japan there are many nuclear power plants, and in addi-tion KamLAND detector was constructed to measure reactor anti-neutrinos, so it is placed close to the reactor. Therefore, the reactor anti-neutrino background for geo-neutrino mea-surement was quite high in this experiment. To the contrary, in Italy there are no nuclear power plants (the mean reactor distance is of approximately 1000 km), so the reactor anti-neutrino flux in Borexino is up to a factor of 7 lower than in KamLAND. In addition, since neutrinos are detected via elastic scattering off electrons of the scintillator, there is no coincidence tag to possibly distinguish neutrino interactions from the signals due to the natural radioactivity background. Therefore, the extreme radio-purity is a must for Borexino, which in fact succeeded to decrease the internal radioac-tivity background to unprecedented low levels. Therefore, the other important backgrounds for geo-neutrino measure-ments, random coincidences and (α,n) interactions, in which
αs are mostly from the210Po decay, are strongly suppressed in Borexino. To the contrary, KamLAND has an advantage of bigger target mass since it features about 1000 t of liquid scintillator while Borexino “only” 280 t. For both detectors the scintillator is placed in the very core of the detector and it is shielded by a layer of the buffer liquid (mineral oil in Kam-LAND and quenched scintillator in Borexino). The scintilla-tor volume is viewed by an array of about 2000 photomul-tipliers. The scintillation light isotropically propagates from the interaction point outwards. The number of hit photomul-tipliers is a measure of energy deposited in the detector. The position of the interaction point can be determined via the time-of-flight measurement of detected scintillation photons. The time of each trigger is flagged by a GPS timestamp. In both detectors the scintillator and buffer containing vessels are further surrounded by a tank filled with ultra-pure wa-ter, called Outer Detector. This medium serves both as a pas-sive shield against external gammas and neutrons as well as an active muon Cherenkov detector equipped with about 200 photomultipliers detecting Cherenkov light produced by cos-mic muons traversing water. The schemes of the Borexino and KamLAND detectors are shown in Figs. 2 and 3, respec-tively.
Borexino and KamLAND are located in very different ge-ological environments and are also very far from each other. Borexino is located on a continental crust, while KamLAND around a boundary of continental and oceanic crusts. The measurements from both experiments are therefore comple-mentary and probing different geological settings, and they could shed light on the hypothesis of a homogeneous vs. het-erogeneous mantle.
The first experimental indication of a geo-neutrino mea-surement (∼2.5σconfidence level was reported by the Kam-LAND collaboration (Araki et al., 2005; Abe et al., 2008). The observation of geo-neutrinos at 99.997 % C.L. was then
L. Ludhova: Geo-neutrinos 225
Livia Ludhova: Geo–neutrinos 5
Stainless Steel Sphere External water tank
Nylon Inner Vessel Nylon Outer Vessel
Fiducial volume Internal PMTs Scintillator Buffer Water Ropes Steel plates for extra shielding
Borexino Detector
Muon PMTsFig. 2. Schematic view of the Borexino detector (Alimonti et al., 2010).
Fig. 3. Schematic view of the KamLand detector (Eguchi et al., 2003).
the chondritic value of 3.9. The contribution of other back-ground results negligible. Fig. 6 shows the allowed regions forNgeo andNreactat 1, 2, and 3σC.L. These results hint
at a higher rate for geo–ν¯e than the BSE from (Fiorentini et
360
al., 2007) predicts, but the uncertainty prevents any conclu-sions. This Borexino measurement rejects the hypothesis of an active geo–reactor of composition as in Herndon 1996 in the Earth’s core with a power above 3 TW at 95% C.L.
KamLand detected 841 anti–neutrino candidates in
365
the geo–neutrino energy window between 0.9 MeV and 2.6 MeV. The best fit with the Th:U ratio fixed to the chon-dritic value of 3.9 results in the number of detected geo– neutrinosNgeo = 106+29−28. The ∆χ2–profile from the fit to
the total number of geo–neutrino events is shown in Fig. 7.
370
The best fit is in agreement with the prediction of the BSE model from Ref. (Enomoto et al., 2007), but other models cannot be firmly excluded yet.
Fig. 4.Borexino data and fit (Bellini et al., 2010): Light yield spec-trum for the positron prompt events of the 21ν¯ecandidates and the
best-fit (solid thick line). The small filled area is the background. Thin solid black/dotted red lines: reactor– and geo–ν¯esignal from
the fit, respectively. The darker area isolates the contribution of the geo–ν¯ein the total signal. The conversion from p.e. to energy is
approximately 500 p.e./MeV.
KamLand performed a combined analyses of the Kam-Land and Borexino results, which are summarized in Fig. 8.
375
They find that decay of 238U and232Th together contribute 20.0+8−8..86 TW to the Earth’s surface heat flux. They adopt the estimation of the total heat flux from40K of 4 TW. They conclude, that the radiogenic heat contributes about half to the total Earth’s heat flux and that other heat sources or the
380
Earth’s primordial heat are contributing to the total heat bud-get. The fully radiogenic, homogeneous hypothesis is there-fore excluded at 97.2% C.L.
Fig. 5. KamLand data and fit (Gando et al., 2011): Prompt en-ergy spectrum of low–enen-ergy anti–neutrino spectrum. The his-tograms indicate the backgrounds, whereas the best fit (including geo–neutrinos) is shown in blue.
Fig. 2. Schematic view of the Borexino detector (Alimonti et al., 2009).
Livia Ludhova: Geo–neutrinos 5
Stainless Steel Sphere External water tank
Nylon Inner Vessel Nylon Outer Vessel
Fiducial volume Internal PMTs Scintillator Buffer Water Ropes Steel plates for extra shielding
Borexino Detector
Muon PMTsFig. 2. Schematic view of the Borexino detector (Alimonti et al., 2010).
Fig. 3. Schematic view of the KamLand detector (Eguchi et al., 2003).
the chondritic value of 3.9. The contribution of other back-ground results negligible. Fig. 6 shows the allowed regions forNgeo andNreact at 1, 2, and 3σC.L. These results hint at a higher rate for geo–¯νe than the BSE from (Fiorentini et
360
al., 2007) predicts, but the uncertainty prevents any conclu-sions. This Borexino measurement rejects the hypothesis of an active geo–reactor of composition as in Herndon 1996 in the Earth’s core with a power above 3 TW at 95% C.L.
KamLand detected 841 anti–neutrino candidates in
365
the geo–neutrino energy window between 0.9 MeV and 2.6 MeV. The best fit with the Th:U ratio fixed to the chon-dritic value of 3.9 results in the number of detected geo– neutrinosNgeo =106+29−28. The ∆χ2–profile from the fit to the total number of geo–neutrino events is shown in Fig. 7.
370
The best fit is in agreement with the prediction of the BSE model from Ref. (Enomoto et al., 2007), but other models cannot be firmly excluded yet.
Fig. 4.Borexino data and fit (Bellini et al., 2010): Light yield spec-trum for the positron prompt events of the 21ν¯ecandidates and the
best-fit (solid thick line). The small filled area is the background. Thin solid black/dotted red lines: reactor– and geo–ν¯esignal from
the fit, respectively. The darker area isolates the contribution of the geo–¯νein the total signal. The conversion from p.e. to energy is
approximately 500 p.e./MeV.
KamLand performed a combined analyses of the Kam-Land and Borexino results, which are summarized in Fig. 8.
375
They find that decay of238U and232Th together contribute 20.0+8−8..86 TW to the Earth’s surface heat flux. They adopt the estimation of the total heat flux from40K of 4 TW. They conclude, that the radiogenic heat contributes about half to the total Earth’s heat flux and that other heat sources or the
380
Earth’s primordial heat are contributing to the total heat bud-get. The fully radiogenic, homogeneous hypothesis is there-fore excluded at 97.2% C.L.
Fig. 5. KamLand data and fit (Gando et al., 2011): Prompt en-ergy spectrum of low–enen-ergy anti–neutrino spectrum. The his-tograms indicate the backgrounds, whereas the best fit (including geo–neutrinos) is shown in blue.
Fig. 3. Schematic view of the KamLAND detector (Eguchi et al., 2003).
achieved by both Borexino (Bellini et al., 2010) and Kam-LAND (Gando et al., 2011). The observed energy spectra of the prompt candidates are shown in Figs. 4 and 5, respec-tively.
Borexino detected in total 21 candidates in 537.2 days of live time and in the energy range up to the end point of the reactor anti-neutrino spectrum. The result of an un-binned maximum likelihood fit gives the number of detected geo-neutrinosNgeo=9.9+−43..14and the number of reactor anti-neutrinosNreact=10.7+−43..34. The Th : U ratio was fixed to the chondritic value of 3.9. The contribution of other background results was negligible. Figure 6 shows the allowed regions for Ngeo andNreact at 1, 2, and 3σC.L. These results hint
at a higher rate for geo-ν¯e than the BSE from Fiorentini et
al. (2007) predicts, but the uncertainty prevents any conclu-sions. This Borexino measurement rejects the hypothesis of an active geo-reactor of composition as in Herndon (1996) in the Earth’s core with a power above 3 TW at 95 % C.L.
Livia Ludhova: Geo–neutrinos
5
Stainless Steel Sphere External water tank
Nylon Inner Vessel Nylon Outer Vessel
Fiducial volume Internal PMTs Scintillator Buffer Water Ropes Steel plates for extra shielding
Borexino Detector
Muon PMTsFig. 2. Schematic view of the Borexino detector (Alimonti et al., 2010).
Fig. 3. Schematic view of the KamLand detector (Eguchi et al., 2003).
the chondritic value of 3.9. The contribution of other
back-ground results negligible. Fig. 6 shows the allowed regions
for
N
geoand
N
reactat 1, 2, and 3
σ
C.L. These results hint
at a higher rate for geo–¯
ν
ethan the BSE from (Fiorentini et
360
al., 2007) predicts, but the uncertainty prevents any
conclu-sions. This Borexino measurement rejects the hypothesis of
an active geo–reactor of composition as in Herndon 1996 in
the Earth’s core with a power above 3 TW at 95% C.L.
KamLand detected 841 anti–neutrino candidates in
365the geo–neutrino energy window between 0.9 MeV and
2.6 MeV. The best fit with the Th:U ratio fixed to the
chon-dritic value of 3.9 results in the number of detected geo–
neutrinos
N
geo=
106
+29−28. The
∆
χ
2
–profile from the fit to
the total number of geo–neutrino events is shown in Fig. 7.
370The best fit is in agreement with the prediction of the BSE
model from Ref. (Enomoto et al., 2007), but other models
cannot be firmly excluded yet.
Fig. 4.Borexino data and fit (Bellini et al., 2010): Light yield spec-trum for the positron prompt events of the 21ν¯ecandidates and the
best-fit (solid thick line). The small filled area is the background. Thin solid black/dotted red lines: reactor– and geo–ν¯esignal from
the fit, respectively. The darker area isolates the contribution of the geo–ν¯e in the total signal. The conversion from p.e. to energy is
approximately 500 p.e./MeV.
KamLand performed a combined analyses of the
Kam-Land and Borexino results, which are summarized in Fig. 8.
375They find that decay of
238U and
232Th together contribute
20
.
0
+8−8..86TW to the Earth’s surface heat flux. They adopt
the estimation of the total heat flux from
40K of 4 TW. They
conclude, that the radiogenic heat contributes about half to
the total Earth’s heat flux and that other heat sources or the
380Earth’s primordial heat are contributing to the total heat
bud-get. The fully radiogenic, homogeneous hypothesis is
there-fore excluded at 97.2% C.L.
Fig. 5. KamLand data and fit (Gando et al., 2011): Prompt en-ergy spectrum of low–enen-ergy anti–neutrino spectrum. The his-tograms indicate the backgrounds, whereas the best fit (including geo–neutrinos) is shown in blue.
Fig. 4. Borexino data and fit (Bellini et al., 2010): light yield spec-trum for the positron prompt events of the 21ν¯ecandidates and the
best fit (solid thick line). The small filled area is the background. Thin solid black/dotted red lines: reactor- and geo-ν¯esignal from
the fit, respectively. The darker area isolates the contribution of the geo-ν¯ein the total signal. The conversion from p.e. to energy is
ap-proximately 500 p.e./MeV.
Livia Ludhova: Geo–neutrinos
5
Stainless Steel Sphere External water tank
Nylon Inner Vessel Nylon Outer Vessel
Fiducial volume Internal PMTs Scintillator Buffer Water Ropes Steel plates for extra shielding
Borexino Detector
Muon PMTsFig. 2. Schematic view of the Borexino detector (Alimonti et al., 2010).
Fig. 3. Schematic view of the KamLand detector (Eguchi et al., 2003).
the chondritic value of 3.9. The contribution of other
back-ground results negligible. Fig. 6 shows the allowed regions
for
N
geoand
N
reactat 1, 2, and 3
σ
C.L. These results hint
at a higher rate for geo–¯
ν
ethan the BSE from (Fiorentini et
360
al., 2007) predicts, but the uncertainty prevents any
conclu-sions. This Borexino measurement rejects the hypothesis of
an active geo–reactor of composition as in Herndon 1996 in
the Earth’s core with a power above 3 TW at 95% C.L.
KamLand detected 841 anti–neutrino candidates in
365the geo–neutrino energy window between 0.9 MeV and
2.6 MeV. The best fit with the Th:U ratio fixed to the
chon-dritic value of 3.9 results in the number of detected geo–
neutrinos
N
geo=
106
+29−28. The
∆
χ
2–profile from the fit to
the total number of geo–neutrino events is shown in Fig. 7.
370The best fit is in agreement with the prediction of the BSE
model from Ref. (Enomoto et al., 2007), but other models
cannot be firmly excluded yet.
Fig. 4.Borexino data and fit (Bellini et al., 2010): Light yield spec-trum for the positron prompt events of the 21ν¯ecandidates and the
best-fit (solid thick line). The small filled area is the background. Thin solid black/dotted red lines: reactor– and geo–ν¯esignal from
the fit, respectively. The darker area isolates the contribution of the geo–¯νein the total signal. The conversion from p.e. to energy is
approximately 500 p.e./MeV.
KamLand performed a combined analyses of the
Kam-Land and Borexino results, which are summarized in Fig. 8.
375They find that decay of
238U and
232Th together contribute
20
.
0
+8−8..86TW to the Earth’s surface heat flux. They adopt
the estimation of the total heat flux from
40K of 4 TW. They
conclude, that the radiogenic heat contributes about half to
the total Earth’s heat flux and that other heat sources or the
380Earth’s primordial heat are contributing to the total heat
bud-get. The fully radiogenic, homogeneous hypothesis is
there-fore excluded at 97.2% C.L.
Fig. 5. KamLand data and fit (Gando et al., 2011): Prompt en-ergy spectrum of low–enen-ergy anti–neutrino spectrum. The his-tograms indicate the backgrounds, whereas the best fit (including geo–neutrinos) is shown in blue.
Fig. 5. KamLAND data and fit (Gando et al., 2011): prompt energy spectrum of low-energy anti-neutrino spectrum. The his-tograms indicate the backgrounds, whereas the best fit (including geo-neutrinos) is shown in blue.
KamLAND detected 841 anti-neutrino candidates in the geo-neutrino energy window between 0.9 MeV and 2.6 MeV. The best fit with the Th : U ratio fixed to the chondritic value of 3.9 results in the number of detected geo-neutrinos
Ngeo=106+−2928. The 1χ2-profile from the fit to the total
number of geo-neutrino events is shown in Fig. 7. The best fit is in agreement with the prediction of the BSE model from Enomoto et al. (2007), but other models cannot be firmly ex-cluded yet.
KamLAND performed a combined analysis of the Kam-LAND and Borexino results, which are summarized in Fig. 8. They find that decay of238U and232Th together contributes 20.0+−88..86TW to the Earth’s surface heat flux. They adopt the estimation of the total heat flux from 40K of 4 TW. They conclude that the radiogenic heat contributes about half to
2266 Livia Ludhova: Geo–neutrinosL. Ludhova: Geo-neutrinos
Fig. 6. Borexino contour plot (Bellini et al., 2010): Allowed re-gions forNgeoandNreact at 68%, 90%, and 99.73% C.L. Verti-cal dashed lines: 1σrange about the expectedNreact(expected in presence of neutrino oscillations). Horizontal dashed lines: range forNgeopredictions based on the BSE model in (Fiorentini et al., 2007). Horizontal solid red lines: predictions of the Fully Radio-genic and Minimal RadioRadio-genic Earth (only the crust contribution considered) models.
Fig. 7. KamLand results (Gando et al., 2011): ∆χ2–profile from the fit to the total number of geo–neutrino events. The BSE model from (Enomoto et al., 2007) prediction is represented by the shaded bend.
3 Future perspectives
The two geo-neutrino measurements opened a door towards 385
a new field. It was proved that geo–neutrinos can be detected and that we, as a mankind, have a new tool how to learn new things about our planet. In order to find definitive answers to the questions correlated to the radiogenic heat and
abun-Fig. 8. Borexino and KamLand combined analysis from (Gando et al., 2011): aMeasured geo–neutrinos flux at KamLand and Borexino sites, and expected fluxes at these sites and Hawaii. The red lines represent fully radiogenic models under different assump-tions.bMeasured geo–neutrinos flux after subtracting the estimated crustal contribution. No modeling uncertainties are shown. The solid red line indicates the fully radiogenic model.
dances of radiogenic elements, more data is needed. Both 390
Borexino and KamLAND will continue to take data in the near future. The earthquake disaster in Japan in March 2012 caused the reactor power plants in Japan to be switched off and some of them will be restarted after a thorough campaign of tests. The strong reduction of the reactor anti–neutrino 395
background could help in improving the future geo–neutrino measurement of KamLand. In addition it would be important to construct larger volume detectors in order to increase the number of detected geo–neutrinos and so improve the preci-sion of the flux measurement. Results from different detec-400
tor sites placed at different geological settings is a key point for understanding, for example, if the Earth mantle compo-sition and heat distributions are homogeneous or not. An-swers to questions like what is the bulk-Earth U versus Th ratio, is it the same like in meteorites can help in better un-405
derstanding of the process of Earth formation and the dis-tribution of elements in the Solar system. A new genera-tion of experiments using liquid scintillators is either under the design or even construction process. SNO+ at Sudbury mine in Canada (Chen et al., 2006), having 1000 tons of tar-410
get, is in an advanced construction phase. The site is lo-cated on an old continental crust and the signal from reactor anti–neutrinos is about twice as the one at Gran Sasso. A new ambitious project to construct a 50000 ton detector is called LENA (Wurm et al., 2012). Among the most proba-415
ble sites are Pyh¨asalmi in Finland or Fr´ejus in France. This experiment could detect at the order of 1000 geo-neutrinos per year. A few percent precision of the total flux measure-ment could be reached within the first couple of few years. The individual contribution of the U and Th geo–neutrino 420
flux could be determined as well. An interesting project of 5000 ton underwater experiment is HanoHano (Learned, 2007) planned to be placed on the oceanic crust (Hawaii). Due to the thin oceanic crust, the mantle contribution to the total geo–neutrino flux should be dominant. Therefore, 425
this measurement would provide the most direct information
Fig. 6. Borexino contour plot (Bellini et al., 2010): allowed regions forNgeoandNreactat 68 %, 90 %, and 99.73 % C.L. Vertical dashed
lines: 1σrange about the expectedNreact(expected in presence of
neutrino oscillations). Horizontal dashed lines: range forNgeo
pre-dictions based on the BSE model in Fiorentini et al. (2007). Hori-zontal solid red lines: predictions of the fully radiogenic and mini-mal radiogenic Earth (only the crust contribution considered) mod-els.
the total Earth’s heat flux and that other heat sources or the Earth’s primordial heat is contributing to the total heat bud-get. The fully radiogenic, homogeneous hypothesis is there-fore excluded at 97.2 % C.L.
3 Future perspectives
The two geo-neutrino measurements opened a door into a new field. It was proved that geo-neutrinos can be detected and that we, as mankind, have a new tool to learn new things about our planet. In order to find definitive answers to the questions correlated to the radiogenic heat and abundances of radiogenic elements, more data are needed. Both Borex-ino and KamLAND will continue to take data in the near future. The earthquake disaster in Japan in March 2012 caused the reactor power plants in Japan to be switched off, and some of them will be restarted after a thorough campaign of tests. The strong reduction of the reactor anti-neutrino background could help in improving the future geo-neutrino measurement of KamLAND. In addition it would be important to construct larger volume detectors in order to increase the number of detected geo-neutrinos and so improve the precision of the flux measurement. Results from different detector sites located at different geological settings are key for understanding, for example, if the Earth’s mantle composition and heat distributions are homogeneous or not. Answers to questions like what is the bulk-Earth U versus Th ratio, and if it is the same like in meteorites, can help in better understanding of the process
6
Livia Ludhova: Geo–neutrinos
Fig. 6.
Borexino contour plot (Bellini et al., 2010): Allowed
re-gions for
N
geoand
N
reactat 68%, 90%, and 99.73% C.L.
Verti-cal dashed lines: 1
σ
range about the expected
N
react(expected in
presence of neutrino oscillations). Horizontal dashed lines: range
for
N
geopredictions based on the BSE model in (Fiorentini et al.,
2007). Horizontal solid red lines: predictions of the Fully
Radio-genic and Minimal RadioRadio-genic Earth (only the crust contribution
considered) models.
Fig. 7.
KamLand results (Gando et al., 2011):
∆χ
2–profile from
the fit to the total number of geo–neutrino events. The BSE model
from (Enomoto et al., 2007) prediction is represented by the shaded
bend.
3
Future perspectives
The two geo-neutrino measurements opened a door towards
385a new field. It was proved that geo–neutrinos can be detected
and that we, as a mankind, have a new tool how to learn new
things about our planet. In order to find definitive answers
to the questions correlated to the radiogenic heat and
abun-Fig. 8.
Borexino and KamLand combined analysis from (Gando
et al., 2011):
a
Measured geo–neutrinos flux at KamLand and
Borexino sites, and expected fluxes at these sites and Hawaii. The
red lines represent fully radiogenic models under different
assump-tions.
b
Measured geo–neutrinos flux after subtracting the estimated
crustal contribution. No modeling uncertainties are shown. The
solid red line indicates the fully radiogenic model.
dances of radiogenic elements, more data is needed. Both
390Borexino and KamLAND will continue to take data in the
near future. The earthquake disaster in Japan in March 2012
caused the reactor power plants in Japan to be switched off
and some of them will be restarted after a thorough campaign
of tests. The strong reduction of the reactor anti–neutrino
395background could help in improving the future geo–neutrino
measurement of KamLand. In addition it would be important
to construct larger volume detectors in order to increase the
number of detected geo–neutrinos and so improve the
preci-sion of the flux measurement. Results from different
detec-400tor sites placed at different geological settings is a key point
for understanding, for example, if the Earth mantle
compo-sition and heat distributions are homogeneous or not.
An-swers to questions like what is the bulk-Earth U versus Th
ratio, is it the same like in meteorites can help in better
un-405derstanding of the process of Earth formation and the
dis-tribution of elements in the Solar system. A new
genera-tion of experiments using liquid scintillators is either under
the design or even construction process. SNO+ at Sudbury
mine in Canada (Chen et al., 2006), having 1000 tons of
tar-410get, is in an advanced construction phase. The site is
lo-cated on an old continental crust and the signal from reactor
anti–neutrinos is about twice as the one at Gran Sasso. A
new ambitious project to construct a 50000 ton detector is
called LENA (Wurm et al., 2012). Among the most
proba-415ble sites are Pyh¨asalmi in Finland or Fr´ejus in France. This
experiment could detect at the order of 1000 geo-neutrinos
per year. A few percent precision of the total flux
measure-ment could be reached within the first couple of few years.
The individual contribution of the U and Th geo–neutrino
420flux could be determined as well. An interesting project
of 5000 ton underwater experiment is HanoHano (Learned,
2007) planned to be placed on the oceanic crust (Hawaii).
Due to the thin oceanic crust, the mantle contribution to
the total geo–neutrino flux should be dominant. Therefore,
425this measurement would provide the most direct information
Fig. 7. KamLAND results (Gando et al., 2011):1χ2-profile fromthe fit to the total number of geo-neutrino events. The BSE model from Enomoto et al. (2007) prediction is represented by the shaded bend.
6
Livia Ludhova: Geo–neutrinos
Fig. 6. Borexino contour plot (Bellini et al., 2010): Allowed re-gions forNgeo andNreact at 68%, 90%, and 99.73% C.L. Verti-cal dashed lines: 1σrange about the expectedNreact(expected in presence of neutrino oscillations). Horizontal dashed lines: range forNgeo predictions based on the BSE model in (Fiorentini et al., 2007). Horizontal solid red lines: predictions of the Fully Radio-genic and Minimal RadioRadio-genic Earth (only the crust contribution considered) models.
Fig. 7. KamLand results (Gando et al., 2011): ∆χ2–profile from the fit to the total number of geo–neutrino events. The BSE model from (Enomoto et al., 2007) prediction is represented by the shaded bend.
3
Future perspectives
The two geo-neutrino measurements opened a door towards
385a new field. It was proved that geo–neutrinos can be detected
and that we, as a mankind, have a new tool how to learn new
things about our planet. In order to find definitive answers
to the questions correlated to the radiogenic heat and
abun-Fig. 8. Borexino and KamLand combined analysis from (Gando et al., 2011): a Measured geo–neutrinos flux at KamLand and Borexino sites, and expected fluxes at these sites and Hawaii. The red lines represent fully radiogenic models under different assump-tions.bMeasured geo–neutrinos flux after subtracting the estimated crustal contribution. No modeling uncertainties are shown. The solid red line indicates the fully radiogenic model.
dances of radiogenic elements, more data is needed. Both
390Borexino and KamLAND will continue to take data in the
near future. The earthquake disaster in Japan in March 2012
caused the reactor power plants in Japan to be switched off
and some of them will be restarted after a thorough campaign
of tests. The strong reduction of the reactor anti–neutrino
395background could help in improving the future geo–neutrino
measurement of KamLand. In addition it would be important
to construct larger volume detectors in order to increase the
number of detected geo–neutrinos and so improve the
preci-sion of the flux measurement. Results from different
detec-400tor sites placed at different geological settings is a key point
for understanding, for example, if the Earth mantle
compo-sition and heat distributions are homogeneous or not.
An-swers to questions like what is the bulk-Earth U versus Th
ratio, is it the same like in meteorites can help in better
un-405derstanding of the process of Earth formation and the
dis-tribution of elements in the Solar system. A new
genera-tion of experiments using liquid scintillators is either under
the design or even construction process. SNO+ at Sudbury
mine in Canada (Chen et al., 2006), having 1000 tons of
tar-410get, is in an advanced construction phase. The site is
lo-cated on an old continental crust and the signal from reactor
anti–neutrinos is about twice as the one at Gran Sasso. A
new ambitious project to construct a 50000 ton detector is
called LENA (Wurm et al., 2012). Among the most
proba-415ble sites are Pyh¨asalmi in Finland or Fr´ejus in France. This
experiment could detect at the order of 1000 geo-neutrinos
per year. A few percent precision of the total flux
measure-ment could be reached within the first couple of few years.
The individual contribution of the U and Th geo–neutrino
420flux could be determined as well. An interesting project
of 5000 ton underwater experiment is HanoHano (Learned,
2007) planned to be placed on the oceanic crust (Hawaii).
Due to the thin oceanic crust, the mantle contribution to
the total geo–neutrino flux should be dominant. Therefore,
425this measurement would provide the most direct information
Fig. 8. Borexino and KamLAND combined analysis from Gando et al. (2011): (a) measured geo-neutrinos flux at KamLAND and Borexino sites, and expected fluxes at these sites and Hawaii. The red lines represent fully radiogenic models under different assump-tions. (b) Measured geo-neutrinos flux after subtracting the esti-mated crustal contribution. No modeling uncertainties are shown. The solid red line indicates the fully radiogenic model.of Earth’s formation and the distribution of elements in the solar system. A new generation of experiments using liquid scintillators is either under design or even construction process. SNO+ at Sudbury mine in Canada (Chen, 2006), having 1000 t of target, is in an advanced construction phase. The site is located on an old continental crust, and the signal from reactor anti-neutrinos is about twice as the one at Gran Sasso. A new ambitious project to construct a 50 000-t detector is called LENA (Wurm et al., 2012). Among the most probable sites are Pyh¨asalmi in Finland and Fr´ejus in France. This experiment could detect on the order of 1000 geo-neutrinos per year. A few percent precision of the total flux measurement could be reached within the first
L. Ludhova: Geo-neutrinos 227
couple of few years. The individual contribution of the U and Th geo-neutrino flux could be determined as well. An interesting project of about 10 000 t underwater experiment is HANOHANO (Learned et al., 2007) planned to be placed on the oceanic crust (Hawaii). Due to the thin oceanic crust, the mantle contribution to the total geo-neutrino flux should be dominant. Therefore, this measurement would provide the most direct information about the mantle. This forthcoming project together with the currently running experiments could be a starting point of a network useful to understand the Earth’s heat distribution.
Edited by: P. Strolin
References
Abe, S., Ebihara, T., Enomoto, S., et al., KamLAND collabora-tion: Precision measurement of Neutrino Oscillation Parameters with KamLAND, Phys. Rev. Lett., 100, 221803-1–221803-5, doi:10.1103/PhysRevLett.100.221803, 2008.
Alimonti, G., Arpesella, C., Back, H., et al., Borexino collabora-tion: The Borexino detector at the Laboratori Nazionali del Gran Sasso, Nucl. Instrum. Meth. A, 600, 568–593, 2009.
All´egre, C. J., Poirier, J. P., Humler, E., and Hofmann, A. W: The chemical composition of the Earth, Earth Planet. Sc. Lett., 134, 515–526, 1995.
Anderson, D. L.: New Theory of the Earth, Cambridge University Press, 400 pp., ISBN:9780521849593, 2007.
Araki, T., Enomoto, S., Furuno, K., et al., KamLAND collaboration: Experimental investigation of geologically produced antineutri-nos with KamLAND, Nature, 436, 499–503, 2005.
Bellini, G., Benziger, J., Bonetti, S., et al., Borexino collaboration: Observation of geo-neutrinos, 2010, Phys. Lett. B, 687, 299–304, 2010.
Chen, M. J.: Geo-neutrinos in SNO+, Earth Moon Planets, 99, 221– 228, 2006.
Davies, J. H. and Davies, D. R.: Earth’s surface heat flux, Solid Earth, 1, 5–24, 2010.
Eguchi, K., Enomoto S., Furuno, S., et al., KamLAND collab-oration: First Results from KamLAND: Evidence for Reac-tor Anti-Neutrino Disappearance, Phys. Rev. Lett., 90, 021802, doi:10.1103/PhysRevLett.90.021802, 2003.
Enomoto, S., Ohtani, E., Inoue, K., and Suzuki, A.: Neutrino geo-physics with KamLAND and future prospects, Earth Planet Sc. Lett., 258, 147–159, 2007.
Fiorentini, G., Lissia, M., and Mantovani, F.: Geo-neutrinos and Earth’s interior, Phys. Rep., 453, 117–172, 2007.
Fiorentini, G., Fogli, G. L, Lisi, E., Mantovani, F., and Ro-tunno, A. M.: Mantle geoneutrinos in KamLAND and Borexino, arXiv:1204.1923, 2012.
Gando, A., Gando., Y., Ichimura, K., et al., KamLAND col-laboration: Partial radiogenic heat model for Earth revealed by geoneutrino measurements, Nat. Geosci., 4, 647–651, doi:10.1038/ngeo1205, 2011.
Herndon, J. M.: Substructure of the inner core of the Earth, P. Natl. Acad. Sci. USA, 93, 646–648, 1996.
Hofmeister, A. M. and Criss, R. E.: Earth’s heat flux revised and linked to chemistry, Tectonophysics, 395, 159–177, 2004. Javoy, M., Kaminski, E., Guyot, F., Andrault, D., Sanloup, C.,
Mor-eira, M., Labrosse, S., Jambon, A., Argrinier, P., Davaille, A., and Jaupart, C.: The chemical composition of the Earth: Enstatite chondrite models, Earth Planet. Sc. Lett., 293, 259–268, 2010. Learned, J. G., Dye, S. T., and Pakvasa, S.: Hanohano: A Deep
Ocean Anti-Neutrino Detector for Unique Neutrino Physics and Geophysics Studies, in: Proceedings of the XII International Workshop on Neutrino Telescopes”, Venice, 6–9 March 2007, edited by: Baldo Ceolin, M., 235–269, 2007.
Lyubetskaya, T. and Korenaga, J.: Chemical composition of Earth’s primitive mantle and its variance: 2. Implications for global geodynamics, J. Geophys. Res., 112, B03212, doi:10.1029/2005JB004224, 2007.
McDonough, W. F. and Sun, S.-S.: The composition of the Earth, Chem. Geol., 120, 223–253, 1995.
Murthy, V. R., van Westrenen, W., and Fei, Y.: Experimental evi-dence that potassium is a substantial radioactive heat source in planetary cores, Nature, 423, 163–165, 2003.
Palme, H. and O’Neill, H. S. C: Cosmochemical Estimates of Man-tle Composition, in: The manMan-tle and core, edited by: Carlson, R. W., Vol. 2, Treatise on Geochemistry, 1–31, 2003.
Pollack, H. N., Hurter, S. J., and Johnson, J. R.: Heat flow from the Earth’s interior: Analysis of the global data set, Rev. Geophys., 31, 267–280, 1993.
Rudnick, R. L. and Gao, S.: The Composition of the Continental Crust, Treatise Geochem., 3, 1–64, 2003.
Strumia, A. and Vissani, F.: Precise quasielastic neutrino/nucleon cross section, Phys. Lett. B, 564, 42–54, 2003.
Turcotte, D. and Schubert, G.: Geodynamics, Cambridge University Press, 472 pp., ISBN:9780521666244, 2002.
Wurm, M., Beacom, J. F., Bezrukov, L. B., Bick, D., Bl¨umer, J., Choubey, S., Ciemniak, Ch., D’Angelo, D., Dasgupta, B., Derbin, A., Dighe, A., Domogatsky, G., Dye, S., ELiseev, S., Enquist, T., Erykalov, A., von Feilitzsch, F., Fiorentini, G., Fis-cher, T., G¨oger-Neff, M., Grabmayr, P., Hagner, C., Hellgartner, D., Hissa, J., Horiuchi, S., Janka, H. T., Jaupart, C., Jochum, J., Kalliokoski, T., Kayunov, Al, Kuusiniemi, P., Lachenmaier, T., Lazanu, I., Learned, J. G., Lewke, T., Lombardi, P., Lorenz, S., Lubsandorzhiev, B., Ludhova, L., Loo, K., Maalampi, J., Mantovani, F., Marafini, M., Maricic, J., Marrodan Undagoitia, T., McDonough, W. F., Miramonti, L., Mirizzi, Al., Meindel, Q., Mena, O., M¨ollenberg, R., Muratova, V., Nahnhauer, R., Nesterenko, D., Novikov, Y. N., Nuijten, G., Oberauer, L., Pak-vasa, S., Palomates-Ruiz, S., Pallavicini, M., Pascoli, S., Patzak, T., Peltoniemi, J., Potzel, W., Raiha, T., Raffelt, G. G., Ranucci, G., Razzaque, S., Rammukainen, K., Sarkamo, J., Sinev, V., Spiering, Ch., Stahl, A., Thorne, F., Tippmann, M., Tonazzo, A., Trzaska, W. H., Vergados, J. D., Wiesbusch, Ch., and Winter, J.: The next-generation liquid-scintillator neutrino observatory LENA, Astrop. Phys., 35, 685–732, 2012.