HERITABILITY AND SELECTION RESPONSE IN SEGREGATING
GENERATIONS OF UPLAND COTTON
Z. A. Soomro, M.B. Kumbhar, A.S. Larik*, M. Imran** and S.A. Brohi***
ABSTRACT: Heritability (b.s), genetic advance, phenotypic and genotypic vari-ance for different quantitative traits is important in determining the effective-ness of selection. In this study the potential effectiveeffective-ness of selection in parents and their F2 and F3 progenies of Gossypium hirsutum for plant height, sympodia/ plant, bolls/plant, boll weight, seed index and seed cotton yield/plant was deter-mined. It was found that all the populations alongwith parents differed signifi-cantly (P < 0.01) and exhibited genetic variability among the genotypes for all the traits except sympodia/plant. Genetic parameters computed through variance com-ponents method show that all the traits were highly heritable in F2 and F3 genera-tions except sympodia/plant, indicating quantitative pattern of inheritance, of-fering better chances of selection for these traits in F2 and F3 generations. The traits namely plant height, bolls/plant and seed cotton yield/plant displayed high heritability (72.97 - 75.55%) with remarkable genetic advance (112.46 - 357.01%) indicating that these traits were predominantly governed by additive gene effects and direct selection may be effective. Boll weight and seed index exhibited low genetic advances irrespective to their high heritability estimates, probably due to non-additive gene effects, developing transgressive segregants through hybrid-ization is suggested. However, hybridhybrid-ization system, which exploits both fixable and non-fixable components, simultaneously, could be useful in the genetic im-provement of yield and yield components in upland cotton.
Key Words: G. hirsutum; Heritability; Genetic Advance; Segregating Generation; Pakistan.
INTRODUCTION
Success in crop improvement programme depends on the amount of ge-netic variability and its utilization. In popu-lation improvement it is important to de-termine the extent of genetic variation for traits to be improved. The genetic informa-tion on broad sense (b. s.) heritability and genetic advance are very important to pre-dict the behavior of the parents to be uti-lized in breeding programme for selecting high yielding cultivars. High genetic ad-vance coupled with high heritability esti-mates offers a most effective response to selection (Larik et al. 1997). Khan et al. (2002) and Soomro et al. (2005) observed additive type of gene action for seed cotton yield and some yield components of
Gossypium hirsutum due to high
heritabil-ity and selection response. Considering the
importance of this type of research, it was contemplated to ascertain heritability and genetic gain in upland cotton genotypes. The information so obtained shall be use-ful in formulating a sound future breeding programme in this crop for tangible ad-vancement.
MATERIALS AND METHODS Five cotton (Gossypium hirsutum L.) cultivars namely TH-3/83, NIAB-78, CIM-109, Mc-Nair-3150 and Reshmi were crosses in all possible combinations. The five parental cultivars and their 20 F2’s and 20 F3’s were grown in a RCB design with four replications at Sindh Agriculture Uni-versity, Tandojam, Pakistan in 2005-06. Seeds were dibbled in rows 75 cm apart @ of 3.5 kg ha-1. Before first irrigation
seed-lings were thinned to maintain plant to
*Department of Plant Breeding and Genetics, Sindh Agriculture University Tandojam, Pakistan. **Fodder Programme, National Agricultural Research Centre, Islamabad, Pakistan.
plant distance of 30 cm. A 3.75 m x 14.2 m plot size was maintained. All required cul-tural operations were adopted uniformly in all the plots throughout growing season. Ten competitive plants in parents, F2 and F3 progenies were selected for recording ob-servation on plant height, sympodia/plant, bolls/plant, boll weight, seed index and seed cotton yield/plant.
Genetic selection parameters were determined through variance component method (Breese, 1972; Larik et al. 1997) as follows:
Genetic variance =ä2g =(MSG - MSE)/r
Phenotypic variance =ä2ph = MSG/r
Heritability (h.w) =ä2g/ä2ph
Selection index (s) =k x äph
Genetic advance (Gs) =hw x s Genetic advance =GA x 100 percent of population mean X
Where, MSG and MSE=are genotypic and error mean squares, respectively from analysis of variance
r= Number of replications X= Population mean and
K= 2.06 at 5% selection intensity (Kang et al., 1983).
RESULTS AND DISCUSSION Performance of Parents, F2 and F3 Hybrids
Analysis of variance (Table 1) exhib-ited that the genotypes differed significantly (P=0.01) for all the traits, indicating the presence of considerable genetic variabil-ity among parents, F2’s and F3 progenies for further evaluation. Results revealed that in F2 generation (Table 1) the cross TH-3/ 83 x Reshmi produced taller plants (111.3 cm), while Mc-Nair-3150 x NIAB-78 had the shortest plants (77.6 cm), while in F3 gen-eration, cross NIAB-78 x Mc-Nair-3150 pro-duced tallest plants (88.34 cm). The parent CIM-109 and TH-3/83 manifested shortest plants of 53.48 and 53.43 cm, respectively as compared to the other genotypes. For sympodia/plant NIAB-78 x CIM-109 dis-played highest number of fruiting branches (22.18) and Reshmi x Mc-Nair-3150 ex-pressed lowest number of fruiting branches (17.07) per plant in F2 generation. In F3, s
the cross CIM-109 x NIAB-78 displayed 17.93 sympodia/plant, while parent TH-3/ 83 expressed lowest number (12.25) of sympodia/plant. For bolls/plant, parent NIAB-78 expressed maximum bolls/plant (33.9) as compared to other genotypes, while low values for bolls/plant were expressed by cross TH-3/83 x Reshmi (17.4) in F2 gen-eration. In F3, s cross CIM-109 x TH-3/83
produced maximum bolls/plant (20.14) and the lowest number of bolls/plant were shown by parent TH-3/83 (8.56). The culti-var Reshmi gave maximum boll weight (3.55 g) and the lowest boll weight was shown by Mc-Nair-3150 (2.36 g) in F2, s. In F
3, s
NIAB-78 x Mc-Nair-3150 produced maximum boll weight (3.22 g) and the lowest boll weight was shown by the parent NIAB-78 (2.19 g). Maximum seed index was manifested by the cross Mc-Nair-3150 x Reshmi (6.77 g) and lowest (5.17 g) by the cross NIAB-78 x CIM-109 in F2, s. In F
3 generation cross
NIAB-78 x Mc-Nair-3150 displayed maxi-mum (7.65 g) seed index and TH-3/83 x Reshmi gave minimum seed index (5.62 g). The cross Reshmi x TH-3/83 provided maximum seed cotton yield of 91.18 g plant-1, while cross Mc-Nair-3150 x
NIAB-78 gave lowest (51.01 g) seed cotton yield plant-1 in F
2 generation. In F3 generation,
NIAB-78 x Mc-Nair-3150 produced highest seed cotton yield plant-1 (50.14 g), whereas
the parent TH-3/83 and CIM-109 expressed lowest (21.45 g) seed cotton yield plant-1.
Generally the two hybrids NIAB-78 x Mc-Nair-3150 and CIM-109 x NIAB-78 displayed better performance for six quantitative traits as compared to other genotypes. It was further noticed that F2 generation ex-celled the F3 generation for all the quanti-tative traits which may be due to deterio-ration of heterosis in F3 generation.
Heritability and other Genetic Parameters Genetic parameters computed through variance components method in F2, s and
F3, s demonstrate that all the characters
were highly heritable except sympodial branches per plant in F2 generation whereas, seed index in F3 generation (Table 2). Seed index displayed maximum (88.13%)
Table 1.Mean performance and ANOVA (mean squares) of 5 parents and 20 crosses of cotton (Gossypium hirsutum L) for yield and yield components in F2 and F3 generations
Parents and Crosses Plant Sympo- No of Boll Seed Seed cotton
height dial/ bolls/ weight index yield/plant
(cm) plant plant (g) (g) (g)
F2 generation
TH-3/83 94.45 feg 18.72 26.07 bcd 2.812 c-f 6.264 c-f 72.24 b-e
NIAB-78 98.45 d-h 20.05 33.90 a 2.597 d-g 5.398 jk 87.03 ab
CIM-109 90.16 hi 20.63 22.06 c-h 2.626 d-g 5.514 ij 56.33 efg
Mc-Niar-3150 83.12 ij 19.39 23.27 c-h 2.367 g 5.667 hij 54.56 fg
Reshmi 110.6 ab 19.34 18.06 gh 3.556 a 6.576 ab 65.52 c-g
TH-3/83 x NIAB-78 97.83 e-h 19.14 33.64 a 2.517 efg 5.472 j 84.69 ab
TH-3/83 x CIM-109 110.7 ab 19.71 23.95 c-g 2.570 d-g 5.796 ghi 61.52 d-g
TH-3/83 x Mc-Niar-3150 104.4 a-e 18.96 27.18 bc 2.664 c-g 6.087 efg 72.14 b-e
TH-3/83 x Reshmi 111.3 a 19.5 17.40 h 2.799 c-f 6.165 ef 49.37 g
NIAB-78 x CIM-109 110.3 ab 22.18 23.10 c-h 2.566 d-g 5.173 k 58.8 d-g
NIAB-78 x Mc-Niar-3150 98.28 d-h 19.98 23.38 c-h 2.592 d-g 5.667 hij 57.92 d-g
NIAB-78 x Reshmi 103.9 a-e 17.74 22.56 c-h 2.861 c-f 6.559 abc 63.70 c-g
CIM-109 x Mc-Niar-3150 96.65 e-h 19.89 26.32 bcd 2.677 c-g 6.509 a-d 70.87 b-f
CIM-109 x Reshmi 94.32 gh 18.84 20.55 d-h 2.827 c-f 6.025 fg 57.25 efg
Mc-Niar-3150 x Reshmi 102.1 b-g 17.21 21.37 c-h 3.066 bc 6.775 a 64.11 c-g
NIAB-78 x TH-3/83 93.45 gh 18.44 25.09 cde 2.432 fg 5.409 jk 61.31 d-g
CIM-109 x TH-3/83 100.6 c-g 20.78 25.75 cde 2.940 cde 6.353 b-e 74.77 a-d
Mc-Niar-3150 x TH-3/83 107.0 a-d 19.63 22.75 c-h 2.694 c-g 5.949 fgh 58.91 d-g
Reshmi x TH-3/83 109.4 ab 20.14 32.04 ab 2.867 cde 6.198 ef 91.18 a
CIM-109 x NIAB-78 99.62 c-g 20.08 24.53 c-f 2.575 d-g 5.534 ij 62.35 c-g
Mc-Niar-3150 x NIAB-78 77.60 j 20.30 19.92 e-h 2.612 d-g 5.513 ij 51.01 g
Reshmi x NIAB-78 103.3 a-f 18.96 24.75 c-f 3.456 ab 6.095 efg 84.85 ab
Mc-Niar-3150 x CIM-109 95.67 e-h 20.51 26.96 bc 2.525 efg 5.489 ij 64.72 c-g
Reshmi x CIM-109 107.4 abc 19.68 18.74 fgh 2.694 c-g 6.238 def 52.97 g
Reshmi x Mc-Niar-3150 99.02 c-h 17.07 25.07 cde 2.981 cd 5.572 ij 79.57 abc
Source of variation D F Mean squares
Replication 3 733.761 25.288 93.947 0.258 0.441 236.764
Genotypes 24 289.128** 5.264 73.098** 0.321** 0.792** 557.580**
Error 72 70.688 3.356 18.792 0.093 0.094 150.707
F3 generation
TH-3/83 53.437 e 12.250 d 8.562 f 2.707 abc 6.360 bcd 21.450 f
NIAB-78 60.750de 14.687a-d 12.437 b-f 2.197 c 6.812 abc 27.807 c-f
CIM-109 53.488 e 12.500 cd 9.406 ef 2.641 abc 6.822 abc 21.450 f
Mc-Niar-3150 71.598 a-e 16.696 ab 18.652 ab 2.427 bc 6.657 a-d 42.161 a-d
Reshmi 73.087 a-d 15.562 a-d 13.75 a-f 2.794 abc 6.906 abc 37.809 a-f
TH-3/83 x NIAB-78 67.656 b-e 16.210 ab 11.884 b-f 2.949 ab 6.652 a-d 31.861 b-f
TH-3/83 x CIM-109 65.750 b-e 13.719 bcd 10.859 def 2.376 bc 6.574 a-d 25.533 def
TH-3/83 x Mc-Niar-3150 69.865 b-e 15.883 abc 11.608 b-f 2.848 abc 6.527 bcd 31.896 b-f
TH-3/83 x Reshmi 66.313 b-e 15.375 a-d 11.094 c-f 2.721 abc 5.623 d 28.663 c-f
NIAB-78 x CIM-109 70.250 a-e 15.805 a-d 10.888 def 2.850 abc 6.301 bcd 30.638 b-f
NIAB-78 x Mc-Niar-3150 88.348 a 17.792 a 16.091 a-e 3.216 a 7.653 a 50.141 a
NIAB-78 x Reshmi 77.537 a-d 15.650 a-d 13.112 b-f 2.897 abc 7.293 ab 37.998 a-f
CIM-109 x Mc-Niar-3150 62.130 cde 15.214 a-d 11.428 c-f 2.401 bc 6.561 a-d 27.303 c-f
CIM-109 x Reshmi 75.531 a-d 15.438 a-d 15.562 a-f 2.854 abc 6.625 a-d 43.958 abc
Mc-Niar-3150 x Reshmi 64.656 b-e 14.904 a-d 8.798 f 2.910 abc 6.920 abc 25.896 def
NIAB-78 x TH-3/83 77.563 a-d 17.500 a 17.358 a-d 2.482 bc 6.224 bcd 43.959 abc
CIM-109 x TH-3/83 76.015 a-d 16.594 ab 20.141 a 2.428 bc 6.065 cd 47.121 ab
Mc-Niar-3150 x TH-3/83 61.525 cde 15.800 a-d 11.162 c-f 3.033 ab 6.905 abc 33.501 a-f
Reshmi x TH-3/83 61.928 cde 15.247 a-d 11.250 c-f 2.586 abc 6.486 bcd 28.549 c-f
CIM-109 x NIAB-78 82.419 ab 17.934 a 18.153 abc 2.808 abc 6.575 a-d 50.116 a
Mc-Niar-3150 x NIAB-78 78.331 a-d 15.181 a-d 13.031 b-f 2.430 bc 6.835 abc 31.418 b-f
Reshmi x NIAB-78 82.101 ab 17.750 a 15.791 a-f 2.480 bc 6.397 bcd 39.982 a-e
Mc-Niar-3150 x CIM-109 63.375 cde 13.844 bcd 10.00 ef 2.511 abc 6.613 a-d 23.894 ef
Reshmi x CIM-109 73.699 a-d 16.886 ab 14.313 a-f 2.722 abc 6.706 a-d 39.035 a-f
Reshmi x Mc-Niar-3150 79.910 abc 14.896 a-d 10.746 def 2.821 abc 6.871 abc 28.853 c-f
Source of variation D F Mean squares
Replication 3 1700.671 59.846 10.894 0.170 1.656 1142.325
Genotypes 24 323.116** 8.774** 40.679** 0.239** 0.612** 299.766**
Error 72 69.241 2.616 10.332 0.10 0.24 63.795
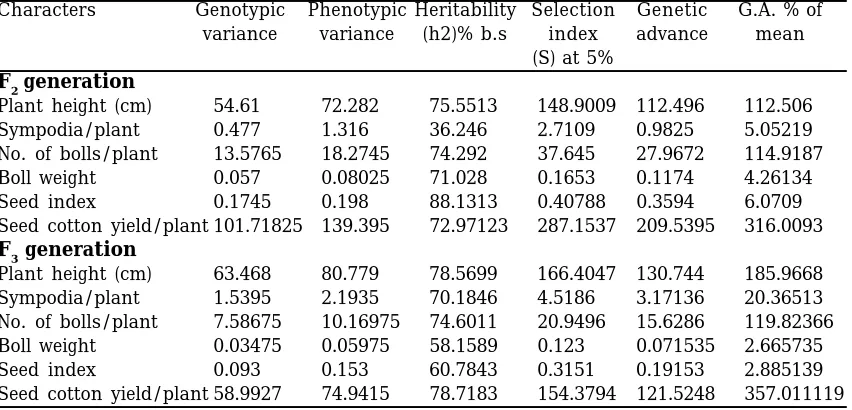
heritability followed by bolls per plant (74.29%) in F2 while in F3 generation seed cotton yield/plant and plant height dis-played (78.72%) and (78.57%) heritability respectively.
There was a wide range of genotypic and phenotypic variances among the char-acters. The highest phenotypic and geno-typic variances of 139.395 and 101.72 re-spectively were recorded for seed cotton yield per plant followed by plant height (72.28 and 54.61) in F2 generation. Seed cotton yield per plant displayed highest ge-netic advance (209.54), selection index (287.15) and G.A% of mean (316.01) followed by number of bolls per plant. Heritability estimates alongwith genetic advance are very useful in predicting expected gain under selection instead of heritability alone. High heritability estimates with high GA indicated that due to additive gene effects direct selection may be effective in F2 and F3 for these traits. All the traits though displayed high estimates of herita-bility (b.s.), yet the magnitude of other ge-netic parameters were quite low in F2 gen-eration. In F3 generation highest genotypic and phenotypic variances 80.78 and 63.47 also showed by plant height followed by seed
cotton yield/plant (74.94 and 58.99). Plant height also showed highest genetic ad-vance (130.74), selection index (166.40) and G.A% of mean (185.97) followed by seed cot-ton yield/plant (Table 2). All the traits though displayed high estimates of broad sense heritability, yet the magnitude of other genetic parameters were quite low except in plant height and seed cotton yield/plant.
Comstock and Moll (1963) reported that more diverse the environmental population the smaller the estimates of genetic vari-ance which supports the present results of low estimates of genetic variance in F2 population. The knowledge of the genetic and phenotypic variances for each param-eter is necessary to construct a definite selection index (Sprague, 1966). Consider-ing the broad sense heritability estimates, plant height, bolls per plant, boll weight, seed index, and seed cotton yield were ranked as high heritable. Rehman et al. (1991), Larik et al. (1992, 1997 & 2000), Yankun et al. (1998) and Hendaway et al. (1999) also reported high heritability for these traits. High heritability suggests that the parents could be used to develop better genotypes in early generations. The high heritability Table 2. Estimation of phenotypic and genotypic variance, heritability (b.s), ge-netic advance or seed cotton yield and its quantitative and qualitative characters in Gossypium hirsutum in F2 and F3 generations
Characters Genotypic Phenotypic Heritability Selection Genetic G.A. % of
variance variance (h2)% b.s index advance mean
(S) at 5%
F2 generation
Plant height (cm) 54.61 72.282 75.5513 148.9009 112.496 112.506
Sympodia/plant 0.477 1.316 36.246 2.7109 0.9825 5.05219
No. of bolls/plant 13.5765 18.2745 74.292 37.645 27.9672 114.9187
Boll weight 0.057 0.08025 71.028 0.1653 0.1174 4.26134
Seed index 0.1745 0.198 88.1313 0.40788 0.3594 6.0709
Seed cotton yield/plant 101.71825 139.395 72.97123 287.1537 209.5395 316.0093
F3 generation
Plant height (cm) 63.468 80.779 78.5699 166.4047 130.744 185.9668
Sympodia/plant 1.5395 2.1935 70.1846 4.5186 3.17136 20.36513
No. of bolls/plant 7.58675 10.16975 74.6011 20.9496 15.6286 119.82366
Boll weight 0.03475 0.05975 58.1589 0.123 0.071535 2.665735
Seed index 0.093 0.153 60.7843 0.3151 0.19153 2.885139
Seed cotton yield/plant 58.9927 74.9415 78.7183 154.3794 121.5248 357.011119
estimates also indicated that the additive/ additive x additive effect were more effec-tive than dominance/dominance x domi-nance effects. High heritable characters were least affected by environmental fluc-tuations. Hence simple selection method would be effective for these traits. The said traits displayed considerable amount of expected genetic advance percentage and the presence of non-allelic interaction played a major role in decreasing h2 esti-mates for these traits. Furthermore sympodia is polygenically controlled. Cumu-lative environmental effects on this polygenically controlled trait gave poor heri-tabilities for this trait.
Seed cotton yield exhibited 81.14% heritability (b.s.) coupled with genetic ad-vance of 60.18%. Although the yield is a complex polygenic character, its inherit-ance has been characterized as the most fluctuative showing high heritability and genetic advance, indicating the impor-tance of additive type of gene effects for its inheritance (Larik et al., 1997 and 2000). High phenotypic and genotypic variance of this trait resulted in high heritability and GA values which suggested the improve-ment of these traits by simple selection method. Therefore, the selection based on plant height, seed cotton yield per plant and bolls/plant could be exploited for the im-provement of yield in cotton. However, the traits boll weight and seed index also dis-played high heritability estimates but failed to express higher estimates of genetic ad-vance expected through selection. Higher estimates of heritability (b.s) do not neces-sarily provide high values of genetic ad-vance and hence heritability alone provides no indication for the amount of genetic progress in the trait that can be achieved through selection (Ansari et al., 2002, Hussain et al., 1999, Larik et al., 1997). High heritability associated with low ge-netic advance for these traits was probably due to non additive gene (dominance and epistasis) effects (Sharma and Tyagi, 1990, 1991) in F2, s while in F
3 generation seed
cotton yield exhibited 78.72% broad sense heritability coupled with 121.52% genetic
advance indicating the contribution of ad-ditive type of gene effects for its inherit-ance (Gomaa et al., 1999). Hendaway et al.
(1999), Yuan et al. (2002) and Baloch (2004)
explained that genetic variance in most cases however, were equal to that of phe-notypic variances consequently giving high heritability estimates and significant genetic gain. Therefore, the selection based on seed cotton yield and bolls/plant, and plant height could be exploited for the im-provement of yield and fibre quality in F3 generation.
Low estimates of broad sense herita-bility accompanied with low GA in respect of sympodia/plant in F2 generation sug-gested that the characters are poorly heri-table and may be due to non-additive gene action and presence of GxE interaction, simple selection may not be rewarding (Kumar et al., 2002) and in such cases breeders can go for selecting desirable transgressive segregants. The successful breeding methods will be the ones, which will exploit the non-additive gene effects. The methods which mop-up the non-addi-tive effects are restricted recurrent selec-tion by the way of intermating the most desirable segregants followed the selection (Joshi, 1979) and diallel selective mating (Jensen, 1978). Hybridization system may therefore be useful in genetic improvment of yield and yield components in upland cot-ton.
LITERATURE CITED
Ansari, B.A. Khushik, A.M. and Ansari. K.A. 2002. Heritability and genetic advance of yield traits in the hybrids of spring wheat. Pakistan J. Agric., Agril. Engg. Vet. Sci. 18(1-2): 5-9.
Baloch, M.J. 2004. Genetic variability and heritability estimates of some polygenic traits in upland cotton. Pakistan J. Sci. Ind. Res. 42(6): 451-454.
Beese, E.L. 1972. Biometrical genetics and its application. Eucarpia Congr., Cam-bridge, 1971. p. 135-146.
Sci. Washington D.C. p. 164-196
Gomaa, M.A.M. Shaheen, A.M.A. and Khattab, S.A.M. 1999. Gene action and selection indices in two cotton (Gossypium barbadense L.) crosses. An-nals of Agric. Sci., Cairo, 44(1): 293-308. Hendaway, F.A. Rady, M.S. Hamid, A.M. and Esmail, R.M. 1999. Inheritance of fibre traits in some cotton crosses. Egyp. J. Agron. 21: 35-36.
Hussain, B. Amin, M.A. and Khan, M.A. 1999. Quantitative inheritance in cot-ton. J. Agric. Res. 37(2-3): 109-116. Jensen, N.F. 1978. Composite breeding
methods and the diallel selective mat-ing system in cereals. Crop Sci. 9: 622-626.
Joshi, A.B. 1979. Breeding methodology for autogamous crops. Ind. J. Genet. 39: 567-578.
Kang, M.S. Mille, J.D. and Tai, P.Y.P. 1983. Genetic and phenotypic path analysis and heritability in sugarcane. Crop Sci. 23: 643-647.
Khan, M.A. Larik, A.S. and Soomro, Z.A. 2002. Study of gene action for yield and yield components in Gossypium hirsutum L. Asian J. Pl. Sci. 1(2): 130-131. Kumar, R. Singh, M. and Singh, S.D. 2002.
Genetic variability and heritability stud-ies in Cuphae pocumbans. Indian J. Plant Gent. Resou. 15(1):40-45.
Larik, A.S. Hafiz, H.M.I. Lashari, M.I. and H. Sethar. 1992. Hybrid vigour and com-bining ability in barley (Hordeum vulgare L). Pakphyton, 4: 87-96.
Larik, A.S. Ansari, S.R. and Kumbhar, M.B. 1997. Heritability analysis of yield and quality components in Gossypium
hirsutum L. Pakistan J. Bot. 29(1):
97-101.
Larik, A.S. Malik, S.I. Kakar, A.A. and Naz, M.A. 2000. Assessment of heritability and genetic advance for yield and yield components in Gossypium hirsutum L. Scientific Khyber. 13(1): 39-44.
Rehman, S. Ahmed, M. Ayoub, M. and Amin, M. 1991. Genetic architecture of yield components in cotton (Gossypium
hirsutum L). Sarhad J. Agric. 7(2):
113-128.
Sharma, S. and Tyagi, B. 1990. Heritabil-ity and coheritable variation in Japa-nese mint. J. Genet and Breed. 44: 81-84.
Sharma, S. and Tyagi, B. 1991. Character correlation, path coefficient and herita-bility analysis of essential oil and qual-ity components in Japanese mint. J. Genet and Breed. 45: 257-262.
Soomro, Z.A. Larik, A.S. Kumbhar, M.B. and Khan, M.A. 2005. Estimation of combin-ing ability in 5x5 dialel crosses of up-land cotton. Sci. Int. 17(1): 61-64. Sprague, G.E. 1966. quantitative genetics
in plant improvement. In: Kenneth, J. Fray crosses of con. J. Am. Soc. Agon. 34: 923-952.
Yankun, C.Z. Shufeng, X.J. Zhang, J. and Changxin, V.R. 1998. The hybrid vigour of interspecific upland cotton and a ge-netic analysis of its major characters. China Cotton, 25(5): 10-12.
Yuan YouLu, Zhang TianZhen, Guo WangZhen, Pan JiaJu, Yuan, Y.L. Zhang, T.Z. Guo, W.Z. and Pan, J.J. 2002. Genetic stability of fibre qualities in Up-land cotton. Cotton Sci. 14(2): 67-70.