D A T A B A S E
Open Access
PD_NGSAtlas: a reference database combining
next-generation sequencing epigenomic and
transcriptomic data for psychiatric disorders
Zheng Zhao
1, Yongsheng Li
1, Hong Chen
1, Jianping Lu
1, Peter M Thompson
3, Juan Chen
1, Zishan Wang
1,
Juan Xu
1*, Chun Xu
2*and Xia Li
1*Abstract
Background:Psychiatric disorders such as schizophrenia (SZ) and bipolar disorder (BP) are projected to lead the global disease burden within the next decade. Several lines of evidence suggest that epigenetic- or genetic-mediated dysfunction is frequently present in these disorders. To date, the inheritance patterns have been complicated by the problem of integrating epigenomic and transcriptomic factors that have yet to be elucidated. Therefore, there is a need to build a comprehensive database for storing epigenomic and transcriptomic data relating to psychiatric disorders. Description:We have developed the PD_NGSAtlas, which focuses on the efficient storage of epigenomic and transcriptomic data based on next-generation sequencing and on the quantitative analyses of epigenetic and transcriptional alterations involved in psychiatric disorders. The current release of the PD_NGSAtlas contains 43 DNA methylation profiles and 37 transcription profiles detected by MeDIP-Seq and RNA-Seq, respectively, in two distinct brain regions and peripheral blood of SZ, BP and non-psychiatric controls. In addition to these data that were generated in-house, we have included, and will continue to include, published DNA methylation and gene expression data from other research groups, with a focus on psychiatric disorders. A flexible query engine has been developed for the acquisition of methylation profiles and transcription profiles for special genes or genomic regions of interest of the selected samples. Furthermore, the PD_NGSAtlas offers online tools for identifying aberrantly methylated and expressed events involved in psychiatric disorders. A genome browser has been developed to provide integrative and detailed views of multidimensional data in a given genomic context, which can help researchers understand molecular mechanisms from epigenetic and transcriptional perspectives. Moreover, users can download the methylation and transcription data for further analyses.
Conclusions:The PD_NGSAtlas aims to provide storage of epigenomic and transcriptomic data as well as quantitative analyses of epigenetic and transcriptional alterations involved in psychiatric disorders. The PD_NGSAtlas will be a valuable data resource and will enable researchers to investigate the pathophysiology and aetiology of disease in detail. The database is available at http://bioinfo.hrbmu.edu.cn/pd_ngsatlas/.
Keywords:Schizophrenia, Bipolar disorder, Next-generation sequencing, Epigenomic and transcriptomic data, Brain, Blood
* Correspondence:[email protected];[email protected]; [email protected]
1
College of Bioinformatics Science and Technology, Harbin Medical University, Harbin 150081, China
2
Department of Pediatrics, Paul L. Foster School of Medicine, Texas Tech University Health Science Center, El Paso, TX, USA
Full list of author information is available at the end of the article
Background
Schizophrenia (SZ) and bipolar disorder (BP) are com-mon and highly heritable psychiatric disorders that affect approximately 4% of the world’s population and result in considerable personal and societal burdens [1]. Over the past decades, it has been widely accepted that both genetic and environmental risk factors lead to the occurrence and development of these disorders [2-4]. Moreover, a large number of genetic association and linkage studies have been performed to explore the pathogenesis of SZ and BP [5,6]. However, the results do not replicate well, and they identify risk alleles with small effects, indicating that non-genetic factors may also result in disease [7]. Recent stud-ies have highlighted a role for epigenetic processes in mediating susceptibility, and have provided new insight into disease pathogenesis.
DNA methylation, which consists of the addition of a methyl group to the 5’-position of cytosine in CpG dinucleotides, is an important epigenetic modification involved in the regulation of transcription [8]. DNA methylation has been shown to interfere with transcrip-tion by directly inhibiting the binding of transcriptranscrip-tion factors, enhancering blocking elements, or recruiting methyl-CpG binding proteins (MBPs) to affect chroma-tin structure [9]. DNA methylation plays a crucial role in genomic imprinting, X chromosome inactivation and regulating tissue-specific gene expression [8,10,11]. Ac-cumulating evidence indicates that abnormal DNA methylation at particular locations may affect neuronal activity [12], brain growth and development [13], learn-ing and memory [14], and cognitive performance [15], and is associated with the pathophysiology of psychiatric disorders [16]. Initial studies focused on DNA methyla-tion alteramethyla-tions in some candidate genes. Using cultured rat neurons, Chen et al.and Martinowichet al.showed the importance of DNA methylation in the regulation of brain-derived neurotrophic factor (BDNF), which is es-sential for neuronal survival, development and synaptic plasticity [17,18]. Subsequently, the first genome-wide DNA methylation landscape profiled by Millet al.aimed to investigate DNA methylation changes associated with SZ and BP using CpG-island microarrays of approxi-mately 12,000 GC-rich regions in the prefrontal cortex and in the germline [19]. They found evidence for psychosis-associated DNA methylation differences in numerous loci involved in glutamatergic and GABAergic neurotransmission, brain development, and other pro-cesses functionally linked to disease aetiology. Because monozygotic (MZ) twins share common genetic informa-tion and can be used as an ideal model for investigating the contribution of epigenetic factors to disease aetiology, Dempster et al. performed a genome-wide analysis of methylation of DNA in blood samples from MZ twin pairs discordant for major psychoses using microarrays, and
they demonstrated disease-associated DNA methylation differences between twins.
Although epigenetic studies promote our understand-ing of psychiatric disorders, there have been few studies of methylation and gene expression on a genome-wide scale. Initial studies focused on DNA methylation alter-ations in candidate genes, including RELN [20], SOX10 [21] and GAD67. DNA methylation of the reelin pro-moter was suggested to be involved in downregulating the gene in SZ, and the DNA methylation status of SOX10 inversely correlated with expression levels of SOX10 and other oligodendrocyte genes [21]. Rapid advances in the development of next-generation sequen-cing (NGS) technology facilitates correspondingly dra-matic advances in elucidating how epigenetic processes mediate gene expression and makes it possible to inte-grate epigenomic and transcriptomic data to uncover the aetiology and pathophysiology of psychiatric disorders. Recently, we performed genome-wide methylation and expression analyses in two brain regions and in periph-eral blood samples [22,23]. Our results support the im-portant roles of DNA methylation in SZ and BP and highlight the complex relationships between DNA methy-lation and gene expression in these disorders. In addition, the results indicate that differentially expressed genes with aberrant methylation patterns that we identified may rep-resent novel candidates for the aetiology and pathology of neuropsychiatric disorders.
database has not been updated for a long time. Thus, a reference database combining epigenomic and transcrip-tomic datasets is urgently needed for the combined analyses of the potential pathogenesis mechanisms of psychiatric disorders.
In this study, we developed the PD_NGSAtlas, which aims to store next-generation sequencing epigenomic and transcriptomic data captured from the same individ-uals and to perform quantitative analyses of epigenetic and transcriptional alterations involved in psychiatric disorders. The current version of the PD_NGSAtlas pro-vides internal genome-wide DNA methylation and tran-scription profiles from two generally inaccessible brain regions and from accessible peripheral blood of SZ, BP and non-psychiatric disorder controls. The PD_NGSAtlas supports the search of methylation and transcription pro-files for special genes or genomic regions of selected sam-ples, which should enable a broad range of researchers to explore the molecular mechanisms of psychiatric disorders (Additional file 1: Figure S1). All retrieved results can be downloaded freely for further analysis. Furthermore, the PD_NGSAtlas offers online tools for identifying aberrantly methylated and expressed genes involved in psychiatric disorders. The database also features a genome browser, which can be used to browse multidimensional data in a given genomic context. In summary, the PD_NGSAtlas is a user-friendly, web-based,‘one-stop’ service for basic data retrieval, analyses, visualisation and downloading, which will help provide new insights into the aetiology of psychi-atric disorders.
Construction and content Clinical samples
All of the subjects were diagnosed by consensus for ei-ther BP or SZ according to DSM-IV-TR criteria and the control samples had no history of an Axis I disorder. The diverse types of clinical characteristics were also collected, including disease status, disease types, age, age of onset, sex and twin status (Additional file 2: Table S1). All the subjects in this study were free of confounding neuropathology. DNA and RNA samples were obtained from peripheral blood or from two distinct brain regions. DNA and RNA samples of peripheral blood were ob-tained from the Department of Psychiatry and Center of Excellence –Neurosciences, Texas Tech University Health Science Center (TTUHSC), whereas the post-mortem brain tissues were collected from the Southwest Brain Bank (SWBB), Department of Psychiatry, UTHSCSA, TX USA. Written, informed consent was obtained from all the participants. All of the brain samples were from freshly frozen specimens that were stored in −80°C freezers. Brodmann area 9 (BA9) and BA24 from the same hemi-sphere were both used based on the criteria described by Rajkowska and Goldman-Rakic [29].
For all the samples stored in the PD_NGSAtlas, a tooltip was added that appears when hovering over a potential sample selection and lists its full parameters. Moreover, users can click on the sample item in the‘Tools’section to see its detailed clinical information that helps to better ex-plore the nature of disease.
MeDIP-Seq
The current release of the PD_NGSAtlas contains 43 DNA methylation profiles detected using MeDIP-Seq by our laboratory. The extracted genomic DNA samples were fragmented into 100-500bp by sonication. DNA ends were repaired to overhang a 3’-dA, and adapters were li-gated to the DNA fragment ends. The double-stranded DNA was denatured, and the DNA fragments were immu-noprecipitated using a 5-mC antibody. Real-time PCR was used to validate the immunoprecipitation quality. DNA fragments of the proper size (usually 200–300 bp, includ-ing the adapter sequence) were selected after PCR amplifi-cation. Finally, the resultant libraries were sequenced as paired-end 50 bp reads using the genome-wide massively parallel sequencing platform Illumina HiSeq 2000.
RNA-Seq
RNA-Seq was performed to profile gene expression in 37 samples, including 14 SZ, 12 BP and 11 control sam-ples. Oligo (dT) beads were used to isolate poly(A) mRNA from the total RNA from these samples. Fragmentation buffer was added and the resulting 200–300 bp fragments were used as templates for random hexamer-primer synthesis of first-strand cDNAs. Second-strand cDNA was synthesised using buffer, dNTPs, RNase H and DNA polymerase I. Fragments were purified using a QIAquick PCR extraction kit and eluted with EB buffer for end reparation and poly(A) addition. Based on the results of agarose gel electrophoresis, fragments were connected with sequencing adapters; PCR was performed by select-ing suitable fragments as templates. The library was se-quenced as paired-end 90 bp reads using an Illumina Hiseq 2000.
Genomic features annotation
been remapped from NCBI36/hg18 to GRCh37/hg19 using the UCSC’s liftOver tool.
Genome-wide DNA methylation and transcription profiles From the raw fastq files, Illumina quality scores were converted into Sanger Phred quality scores using MAQ. Quality control was performed on the raw sequence data using FastQC. Additional file 3: Figure S2 highlights the quality of our sequencing datasets. Reads from MeDIP-Seq and RNA-MeDIP-Seq were mapped using the SOAP2 pro-gram [32]. The uniquely mapped reads were retained for further analysis. The genome methylation peaks were further identified by MACS [33], and the threshold of the p-value was set to 1.0e-5. In addition, gene expres-sion levels were measured using RPKM [34]. Finally, all the DNA methylation profiles cover 6,634,043 methyla-tion peaks, and the transcripmethyla-tion profiles involve 19,186 expressed genes.
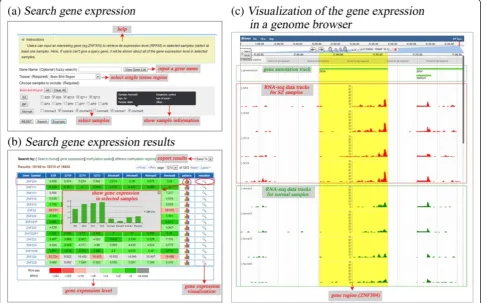
The PD_NGSAtlas provides a user-friendly interface for the acquisition of methylation profiles and transcrip-tion profiles for specific genes or genomic regions of selected samples. A comprehensive search interface is provided (Figure 1a). For transcription data, users can search gene expression levels by entering a gene symbol (optional) and selecting several samples of interest (Figure 1a). The search results are displayed as an overview table that summarises the gene expression levels across se-lected samples (Figure 1b). This table can show the gene
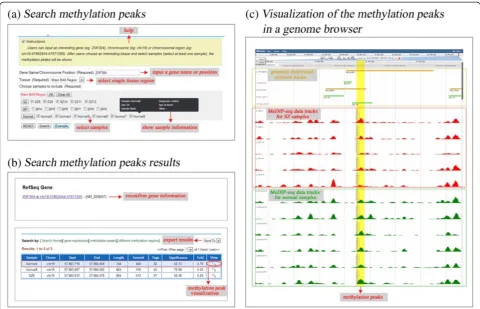
expression pattern across selected samples and can link to the‘Visualize’section in which users can view gene expres-sion profiles under a given genomic context through a tailored genome browser (Figure 1c). Similarly, users can obtain DNA methylation profiles of a given gene symbol or chromosome region across selected samples (Figure 2). Furthermore, these DNA methylation profiles can be visualised through a customised genome browser. All of the above query results can be downloaded freely. These valuable data resources should facilitate researcher on psy-chiatric disorders.
Identification of aberrantly methylated and/or expressed events in psychiatric disorders
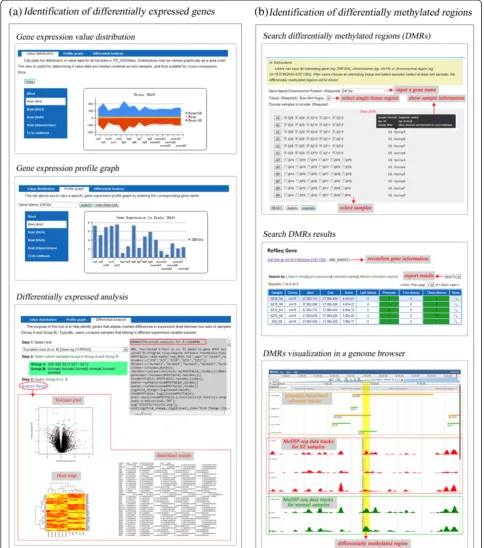
In the PD_NGSAtlas database, to view global gene ex-pression profiles, online tools can calculate the overall distribution of gene expression and present it graphically as a flex area chart (Figure 3a). The tool is useful for determining whether data values are median-centred across samples and thus suitable for cross-comparison. Similarly, users can type in a specific gene symbol and view its expression distribution across all samples in which its expression changes (Figure 3a). Typically, users can compare samples that belong to different experi-mental variable subsets. For transcription data, a tool was developed for users to identify genes that display marked differences in the expression levels of two sets of samples. In the current version of the database, a Table 1 All data content and statistics used in PD_NGSAtlas
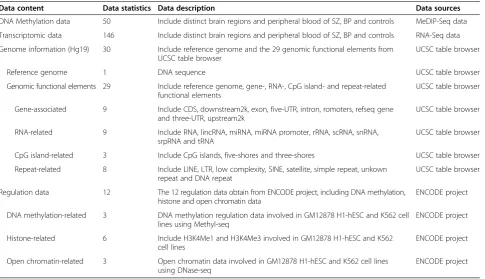
Data content Data statistics Data description Data sources
DNA Methylation data 50 Include distinct brain regions and peripheral blood of SZ, BP and controls MeDIP-Seq data
Transcriptomic data 146 Include distinct brain regions and peripheral blood of SZ, BP and controls RNA-Seq data
Genome information (Hg19) 30 Include reference genome and the 29 genomic functional elements from UCSC table browser
UCSC table browser
Reference genome 1 DNA sequence UCSC table browser
Genomic functional elements 29 Include reference genome, gene-, RNA-, CpG island- and repeat-related functional elements
UCSC table browser
Gene-associated 9 Include CDS, downstream2k, exon, five-UTR, intron, romoters, refseq gene and three-UTR, upstream2k
UCSC table browser
RNA-related 9 Include RNA, lincRNA, miRNA, miRNA promoter, rRNA, scRNA, snRNA, srpRNA and tRNA
UCSC table browser
CpG island-related 3 Include CpG islands, five-shores and three-shores UCSC table browser
Repeat-related 8 Include LINE, LTR, low complexity, SINE, satellite, simple repeat, unkown repeat and DNA repeat
UCSC table browser
Regulation data 12 The 12 regulation data obtain from ENCODE project, including DNA methylation, histone and open chromatin data
ENCODE project
DNA methylation-related 3 DNA methylation regulation data involved in GM12878 H1-hESC and K562 cell lines using Methyl-seq
ENCODE project
Histone-related 6 Include H3K4Me1 and H3K4Me3 involved in GM12878 H1-hESC and K562 cell lines
ENCODE project
Open chromatin-related 3 Open chromatin data involved in GM12878 H1-hESC and K562 cell lines using DNase-seq
two-tailed t-test and several other widely used methods (including EdgeR [35] and DEGseq [36]) were provided to identify the differentially expressed genes (DEGs). The t-test is the most commonly used method to iden-tify DEGs. With the development of high-throughput se-quencing, several R packages were developed to identify DEGs for RNA-seq data. EdgeR integrated three existing methods and introduced two novel methods based on MA-plots to detect and visualise gene expression differ-ence, whereas DEGseq used empirical Bayes methods to moderate the degree of overdispersion across transcripts, improving the reliability of inference. In addition, the Limma method can be used to identify the DEGs ac-counting for age and sex. All the p-values obtained by these methods were adjusted. In addition, the results of the DEGs are shown in a volcano plot, an M-A plot and a heatmap is provided to show the expression of the top 50 DEGs (Figure 3a). For DNA methylation data, aber-rantly methylated peaks were detected between two samples. For each peak, the number of reads for each sample was calculated, and the significance was assessed using chi-squared tests. Then, the resultant regions
with an FDR less than 5% and more than a two-fold difference of read numbers were considered to be differentially methylated regions (DMRs) [37]. In the PD_NGSAtlas, a query interface was designed to enable a comparison between disease samples and controls, which users can employ to obtain DMRs (Figure 3b). We propose that the combination of aberrantly methylated re-gions and expressed genes can be used to elucidate the molecular mechanisms underlying psychiatric disorders.
Visualizing the methylation and transcription profiles of interesting genes and regions
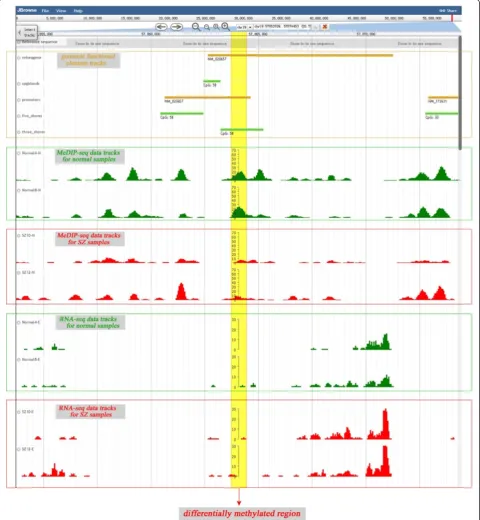
To capture meaningful information from epigenetic and transcriptomic data, a genome browser based on JBrowse was proposed for users, and it allowed users to compare multilevel genomic, epigenetic and transcrip-tomic data visually to discover functional relationships (Figure 4) [38]. Here, both methylation and transcription data can be visualised in the same view in bigWig format, which can help users to find the functional relationships between the two types of data. Furthermore, users can view other genome information including gene structure,
CpG islands, repeat elements and several genomic regula-tion features against a human reference genome (Hg19). These data can intuitively reflect epigenetic and transcrip-tomic changes between different samples, which would be useful for the study of the molecular mechanisms of psychiatric disorders. The genome browser offers several easy-to-use tools, including the ability to navigate directly to a region of interest by typing in the region coordinates, to zoom in or out or drag a region, to view the annotation details by double-clicking on the annotation track, and to configure genomic annotation by clicking on the track name. Importantly, users can upload their own data to be visualised. The users’ data reside on a local computer without the need to transfer any data to the server. As shown in Figures 1–2, a visual interface can be accessed through the links in the query results.
Relational database and web interface
The web interface was developed in Java using the Servlet framework. The PD_NGSAtlas website is deployed on a Tomcat 6.0.33 web server and runs under the Cent OS 5.5 system. It is supported by a MySQL database of DNA methylation and transcription data. The JQuery was used
to render, generate and manipulate the gene expression distribution views. The module for the identification of differentially expressed genes (DEGs) is realised by R and Perl script. In the ‘Visualize’ module, JBrowse (release 1.11.5), an open source genome browser, can be used to navigate multiple omics data and diverse genome informa-tion over the web. Moreover, the PD_NGSAtlas has been fully tested in Google Chrome (version 17 and later), Apple Safari (version 5 and later) and Mozilla Firefox (version 10 and later).
Utility
It is worth noting that the integration of epigenetic and transcriptomic data is intended to enhance the analysis of the aetiology of psychiatric disorders at the gene level. Taking the gene ZNF304 as an example, in the BA9 re-gion, ZNF304 is specifically upregulated in patients with SZ compared with controls (Figure 4, t-test, p<10e-3). Furthermore, we found that the promoter of ZNF304 is hypomethylated in SZ samples compared with con-trols (Figure 4). In addition to ZNF304, we found that the expression of gene ZNF483 is higher in SZ samples than in the controls, and the promoter of ZNF483 is
hypomethylated in SZ samples from the BA24 region of the brain. This is consistent with previous research im-plicating ZNF483 in SZ [39,40]. These results suggest that the combination of epigenetics and transcriptome studies may provide new insights into the cause of psychiatric disorders.
Discussion
The current version of the PD_NGSAtlas is the first re-lease of our database, and it contains next-generation se-quencing DNA methylation and gene expression profiles of datasets obtained from human brain and blood sam-ples. Psychiatric disorders are diseases of the central
nervous system, and therefore, studies of patient-derived living brain cells may provide the most pertinent infor-mation. Post-mortem brains have been extensively used in recent studies; however, obtaining a sufficient number of brains in ideal condition is difficult. Thus, it is more feasible to obtain peripheral samples that can act as po-tential biomarkers of SZ and BP [41]. Psychiatric disor-ders, including SZ and BP, have genetic components [42], and CNS alterations might be reflected in periph-eral tissues. Indeed, previous microarray analyses have found numerous classes of genes that are expressed both in blood and in the prefrontal cortex [43], including ap-proximately half of the so-called SZ susceptibility genes [44]. A previous study comparing the methylation status of pre-mortem blood and post-mortem brain tissue showed that significant variation in the methylation pro-files of brain tissue were reflected in blood [45]. Add-itionally, recent studies have shown that DMRs associated with both chronic pain and ageing are similar in brain and blood tissue [46]. Although the number of blood samples in our current database is limited, peripheral samples for the development of biomarkers and individualised therap-ies may prove to be potent and complementary tools for use in psychiatric research.
Given the importance of the data as a resource for the community focused on psychiatric research, we have made the PD_NGSAtlas publicly available. To build a DNA methylation and gene expression database focusing on human psychiatric diseases, continued efforts will be made to update the PD_NGSAtlas data and improve the genomic viewer and database functionality. In our current study, we also included some sequencing-based DNA methylation and gene expression profiles related to SZ and BP collected from public databases [47]. We will also encourage research scientists to submit their next-generation sequencing data directly to the PD_NGSAtlas and to make this database more comprehensive. The sub-mitted datasets in the future will be manually reviewed and then integrated into this database. In addition, some inter-faces are also provided in our current database, and it will be easy to integrate these datasets into the database in the future.
In this study, we proposed the PD_NGSAtlas for the visualisation and analysis of methylation and expression datasets for psychiatric disorders; however, some limita-tions to the current system need to be addressed in the future. Although a number of datasets were collected and processed into our database, the numbers of samples are still limited. We expected to acquire more samples to make the database more comprehensive in the future. In addition, some statistical methods were incorporated into the database to identify the DEGs. These methods should be used with caution. The user should select the method that is most suitable for a given dataset. For example, the
edgeR and DEGSeq methods were specifically incorporated for gene expression profiles based on raw read counts. Moreover, it is notable that the newly submitted datasets were mainly transferred by email to our current database. In response to the rapid increase in the amount of sequen-cing data produced by the next-generation sequensequen-cing technologies, we expect to incorporate more effective methods to enhance the efficiency of this process.
Conclusions
In this work, we present the PD_NGSAtlas, a specific database for psychiatric disorders, which offers a com-prehensive reference resource combining epigenetic and transcriptomic data based on next generation sequen-cing, and quantitative analysis of epigenetic and tran-scriptional alterations involved in psychiatric disorders. The PD_NGSAtlas aims to provide reference resources to assist researchers to understand the epigenetic and tran-scriptional effects involved in the aetiology and patho-physiological mechanisms of psychiatric disorders.
Availability and requirements
PD_NGSAtlas is freely available at http://bioinfo.hrbmu. edu.cn/pd_ngsatlas/. The web interface has been tested in the following web browsers: Google Chrome (version 17 and later), Apple Safari (version 5 and later) and Mozilla’s Firefox (version 10 and later). The“Help” page of the PD_NGSAtlas Web interface includes a step-by-step description of all PD_NGSAtlas features.
Additional files
Additional file 1: Figure S1.The overview of the PD_NGSAtlas. (a) The search page of the database shows. (b) The detail page of search gene expression, search methylation peaks and DMRs. (c) The gene expression of specific gene was shown in the search result page. The users can also view the distribution of the gene expression across samples by clicking the bar button. (d) The DNA methylation of specific gene across samples was shown. (e) The identified DMRs across the samples selected by users. (f) The visualization of DNA methylation and gene expression.
Additional file 2: Table S1.The clinical characteristics of samples used in PD_NGSAtlas.
Additional file 3: Figure S2.Median Phred score vs. base position. The quality scores of the reads were satisfactory, most of the called bases had a Phred score≥30.
Abbreviations
SZ:Schizophrenia; BP: Bipolar disorder; MBPs: Methyl-CpG binding proteins; BDNF: Brain-derived neurotrophic factor; MZ: Monozygotic; TTUHSC: Texas Tech University Health Science Center; SWBB: Southwest Brain Bank; NOK: Next-of-kin; BA9: Brodmann area 9; BA24: Brodmann area 24; CGIs: CpG islands.
Competing interests
The authors declare that they have no competing interests.
Authors’contributions
and implemented the database. ZZ, JX, CX and XL wrote the manuscript. All authors have read and approved the final manuscript.
Acknowledgements
This work was supported by the National High Technology Research and Development Program of China [863 Program, Grant No. 2014AA021102], the National Program on Key Basic Research Project [973 Program, Grant No. 2014CB910504], the National Natural Science Foundation of China [Grant Nos. 91129710, 61170154 and 61203264], the China Postdoctoral Science Foundation [Grant No. 2012M520764 and 2014T70364], WeihanYu Youth Science Fund Project of Harbin Medical University, and the Innovation Research Fund for Graduate Students of Harbin Medical University [Grant No. YJSCX2014-22HYD].
The authors thank the Department of Psychiatry and Center of Excellence-Neurosciences, Texas Tech University Health Science Center (TTUHSC) for blood samples, and Southwest Brain Bank, Department of Psychiatry, UTHSCSA, TX USA for post-mortem brains samples.
Author details
1College of Bioinformatics Science and Technology, Harbin Medical University, Harbin 150081, China.2Department of Pediatrics, Paul L. Foster School of Medicine, Texas Tech University Health Science Center, El Paso, TX, USA.3Southwest Brain Bank, Department of Psychiatry, UTHSCSA, San Antonio, TX, USA.
Received: 22 September 2014 Accepted: 11 December 2014
References
1. Patel V, Prince M:Global mental health: a new global health field comes of age.JAMA2010,303(19):1976–1977.
2. Burmeister M, McInnis MG, Zollner S:Psychiatric genetics: progress amid controversy.Nat Rev Genet2008,9(7):527–540.
3. Karlsgodt KH, Sun D, Jimenez AM, Lutkenhoff ES, Willhite R, van Erp TG, Cannon TD:Developmental disruptions in neural connectivity in the pathophysiology of schizophrenia.Dev Psychopathol2008,20(4):1297–1327. 4. Lewis DA, Levitt P:Schizophrenia as a disorder of neurodevelopment.
Annu Rev Neurosci2002,25:409–432.
5. Craddock N, O'Donovan MC, Owen MJ:The genetics of schizophrenia and bipolar disorder: dissecting psychosis.J Med Genet2005,42(3):193–204. 6. Kushima I, Aleksic B, Ito Y, Nakamura Y, Nakamura K, Mori N, Kikuchi M,
Inada T, Kunugi H, Nanko S, Kato T, Yoshikawa T, Ujike H, Suzuki M, Iwata N, Ozaki N:Association study of ubiquitin-specific peptidase 46 (USP46) with bipolar disorder and schizophrenia in a Japanese population.
J Hum Genet2010,55(3):133–136.
7. Pidsley R, Mill J:Epigenetic studies of psychosis: current findings, methodological approaches, and implications for postmortem research.
Biol Psychiatry2011,69(2):146–156.
8. Bird A:DNA methylation patterns and epigenetic memory.Genes Dev
2002,16(1):6–21.
9. Nan X, Ng HH, Johnson CA, Laherty CD, Turner BM, Eisenman RN, Bird A: Transcriptional repression by the methyl-CpG-binding protein MeCP2 involves a histone deacetylase complex.Nature1998, 393(6683):386–389.
10. Suzuki MM, Bird A:DNA methylation landscapes: provocative insights from epigenomics.Nat Rev Genet2008,9(6):465–476.
11. Li E, Bestor TH, Jaenisch R:Targeted mutation of the DNA methyltransferase gene results in embryonic lethality.Cell1992, 69(6):915–926.
12. Guo JU, Ma DK, Mo H, Ball MP, Jang MH, Bonaguidi MA, Balazer JA, Eaves HL, Xie B, Ford E, Zhang K, Ming GL, Gao Y, Song H:Neuronal activity modifies the DNA methylation landscape in the adult brain.
Nat Neurosci2011,14(10):1345–1351.
13. Pidsley R, Dempster EL, Mill J:Brain weight in males is correlated with DNA methylation at IGF2.Mol Psychiatry2010,15(9):880–881. 14. Lubin FD, Roth TL, Sweatt JD:Epigenetic regulation of BDNF gene
transcription in the consolidation of fear memory.J Neurosci2008, 28(42):10576–10586.
15. Isles AR, Davies W, Wilkinson LS:Genomic imprinting and the social brain.
Philos Trans R Soc Lond B Biol Sci2006,361(1476):2229–2237.
16. Connor CM, Akbarian S:DNA methylation changes in schizophrenia and bipolar disorder.Epigenetics2008,3(2):55–58.
17. Chen WG, Chang Q, Lin Y, Meissner A, West AE, Griffith EC, Jaenisch R, Greenberg ME:Derepression of BDNF transcription involves calcium-dependent phosphorylation of MeCP2.Science2003, 302(5646):885–889.
18. Martinowich K, Hattori D, Wu H, Fouse S, He F, Hu Y, Fan G, Sun YE:DNA methylation-related chromatin remodeling in activity-dependent BDNF gene regulation.Science2003,302(5646):890–893.
19. Mill J, Tang T, Kaminsky Z, Khare T, Yazdanpanah S, Bouchard L, Jia P, Assadzadeh A, Flanagan J, Schumacher A, Wang SC, Petronis A: Epigenomic profiling reveals DNA-methylation changes associated with major psychosis.Am J Hum Genet2008,82(3):696–711. 20. Grayson DR, Jia X, Chen Y, Sharma RP, Mitchell CP, Guidotti A, Costa E:
Reelin promoter hypermethylation in schizophrenia.Proc Natl Acad Sci U S A2005,102(26):9341–9346.
21. Iwamoto K, Bundo M, Yamada K, Takao H, Iwayama-Shigeno Y, Yoshikawa T, Kato T:DNA methylation status of SOX10 correlates with its downregulation and oligodendrocyte dysfunction in schizophrenia.J Neurosci2005, 25(22):5376–5381.
22. Xiao Y, Camarillo C, Ping Y, Arana TB, Zhao H, Thompson PM, Xu C, Su BB, Fan H, Ordonez J, Wang L, Mao C, Zhang Y, Cruz D, Escamilla MA, Li X:The DNA methylome and transcriptome of different brain regions in schizophrenia and bipolar disorder.PLoS One2014,9(4):e95875.
23. Y Li, Camarillo C, J Xu, TB Arana, Y Xiao, Z Zhao, H Chen, M Ramirez, J Zavala, MA Escamilla, R Armas, R Mendoza, A Ontiveros, H Nicolini, A Jerez, LP. Rubin, X Li, C Xu:Genome-wide methylome analyses reveal novel epigenetic regulation patterns in schizophrenia and bipolar disorder.Biomed Res Int2014, http://www.hindawi.com/ journals/bmri/aa/201587/.
24. Hackenberg M, Barturen G, Oliver JL:NGSmethDB: a database for next-generation sequencing single-cytosine-resolution DNA methylation data.
Nucleic Acids Res2011,39(Database issue):D75–79.
25. Zou D, Sun S, Li R, Liu J, Zhang J, Zhang Z:MethBank: a database integrating next-generation sequencing single-base-resolution DNA methylation programming data.Nucleic Acids Res2014, doi:10.1093/nar/gku920. 26. Lv J, Liu H, Su J, Wu X, Liu H, Li B, Xiao X, Wang F, Wu Q, Zhang Y:
DiseaseMeth: a human disease methylation database.Nucleic Acids Res2012,40(Database issue):D1030–1035.
27. Gu F, Doderer MS, Huang YW, Roa JC, Goodfellow PJ, Kizer EL, Huang TH, Chen Y:CMS: a web-based system for visualization and analysis of genome-wide methylation data of human cancers.PLoS One2013, 8(4):e60980.
28. Xin Y, Chanrion B, O'Donnell AH, Milekic M, Costa R, Ge Y, Haghighi FG: MethylomeDB: a database of DNA methylation profiles of the brain.
Nucleic Acids Res2012,40(Database issue):D1245–1249.
29. Rajkowska G, Goldman-Rakic PS:Cytoarchitectonic definition of prefrontal areas in the normal human cortex: II. Variability in locations of areas 9 and 46 and relationship to the Talairach Coordinate System.Cerebral cortex1995,5(4):323–337.
30. Karolchik D, Hinrichs AS, Furey TS, Roskin KM, Sugnet CW, Haussler D, Kent WJ:The UCSC Table Browser data retrieval tool.Nucleic Acids Res2004,32(Database issue):D493–496.
31. Bernstein BE, Birney E, Dunham I, Green ED, Gunter C, Snyder M:An integrated encyclopedia of DNA elements in the human genome.
Nature2012,489(7414):57–74.
32. Li R, Yu C, Li Y, Lam TW, Yiu SM, Kristiansen K, Wang J:SOAP2: an improved ultrafast tool for short read alignment.Bioinformatics2009, 25(15):1966–1967.
33. Zhang Y, Liu T, Meyer CA, Eeckhoute J, Johnson DS, Bernstein BE, Nusbaum C, Myers RM, Brown M, Li W, Liu XS:Model-based analysis of ChIP-Seq (MACS).Genome Biol2008,9(9):R137.
34. Mortazavi A, Williams BA, McCue K, Schaeffer L, Wold B:Mapping and quantifying mammalian transcriptomes by RNA-Seq.Nat Methods2008, 5(7):621–628.
35. Robinson MD, McCarthy DJ, Smyth GK:edgeR: a Bioconductor package for differential expression analysis of digital gene expression data.
Bioinformatics2010,26(1):139–140.
36. Wang L, Feng Z, Wang X, Wang X, Zhang X:DEGseq: an R package for identifying differentially expressed genes from RNA-seq data.
37. Benjamini Y, Hochberg Y:Controlling the false discovery rate: a practical and powerful approach to multiple testing.J Roy Stat Soc1995, 57(1):289–300.
38. Skinner ME, Uzilov AV, Stein LD, Mungall CJ, Holmes IH:JBrowse: a next-generation genome browser.Genome Res2009,19(9):1630–1638. 39. Sainz J, Mata I, Barrera J, Perez-Iglesias R, Varela I, Arranz MJ, Rodriguez MC,
Crespo-Facorro B:Inflammatory and immune response genes have significantly altered expression in schizophrenia.Mol Psychiatry2013, 18(10):1056–1057.
40. Schultz CC, Nenadic I, Riley B, Vladimirov VI, Wagner G, Koch K, Schachtzabel C, Muhleisen TW, Basmanav B, Nothen MM, Deufel T, Kiehntopf M, Rietschel M, Reichenbach JR, Cichon S, Schlosser RG, Sauer H:ZNF804A and cortical structure in schizophrenia: in vivo and postmortem studies.Schizophr Bull
2014,40(3):532–541.
41. Hayashi-Takagi A, Vawter MP, Iwamoto K:Peripheral biomarkers revisited: integrative profiling of peripheral samples for psychiatric research.
Biol Psychiatry2014,75(12):920–928.
42. Sullivan PF, Daly MJ, O'Donovan M:Genetic architectures of psychiatric disorders: the emerging picture and its implications.Nat Rev Genet2012, 13(8):537–551.
43. Sullivan PF, Fan C, Perou CM:Evaluating the comparability of gene expression in blood and brain.Am J Med Genet B Neuropsychiatr Genet
2006,141B(3):261–268.
44. Rollins B, Martin MV, Morgan L, Vawter MP:Analysis of whole genome biomarker expression in blood and brain.Am J Med Genet B Neuropsychiatr Genet2010,153B(4):919–936.
45. Davies MN, Volta M, Pidsley R, Lunnon K, Dixit A, Lovestone S, Coarfa C, Harris RA, Milosavljevic A, Troakes C, Al-Sarraj S, Dobson R, Schalkwyk LC, Mill J:Functional annotation of the human brain methylome identifies tissue-specific epigenetic variation across brain and blood.Genome Biol
2012,13(6):R43.
46. Bell JT, Tsai PC, Yang TP, Pidsley R, Nisbet J, Glass D, Mangino M, Zhai G, Zhang F, Valdes A, Shin SY, Dempster EL, Murray RM, Grundberg E, Hedman AK, Nica A, Small KS, Dermitzakis ET, McCarthy MI, Mill J, Spector TD, Deloukas P: Epigenome-wide scans identify differentially methylated regions for age and age-related phenotypes in a healthy ageing population.PLoS genetics
2012,8(4):e1002629.
47. Davies MN, Krause L, Bell JT, Gao F, Ward KJ, Wu H, Lu H, Liu Y, Tsai PC, Collier DA, Murphy T, Dempster E, Mill J, Battle A, Mostafavi S, Zhu X, Henders A, Byrne E, Wray NR, Martin NG, Spector TD, Wang J:Hypermethylation in the ZBTB20 gene is associated with major depressive disorder.Genome Biol
2014,15(4):R56.
Submit your next manuscript to BioMed Central and take full advantage of:
• Convenient online submission
• Thorough peer review
• No space constraints or color figure charges
• Immediate publication on acceptance
• Inclusion in PubMed, CAS, Scopus and Google Scholar
• Research which is freely available for redistribution