Available online at http://ijdea.srbiau.ac.ir Int. J. Data Envelopment Analysis (ISSN 2345-458X)
Vol. 1, No. 1, Year 2013 Article ID IJDEA-00113, 9 pages Research Article
Basic ratio-based DEA models
M.R.Mozaffari*a, J.Geramia
(a) Department of Mathematics, Science and Research Branch,Islamic Azad University,Fars, Iran.
Abstract
In this paper, different input-oriented ratio-based DEA (DEA-R-I) models are proposed. By presenting the envelopment-additive-enhanced Russell model based on the DEA-R-I form, each decision making unit is evaluated and its efficiency score is calculated. Also, by presenting the central resource allocation model based on the DEA-R-I form, a suitable benchmark for all DMUs is proposed by solving a linear programming problem. Finally, the efficiency scores obtained for the data of 20 commercial bank branches by each of the proposed models are compared.
Keywords : DEA, DEA-R, Efficiency.
1 Introduction
Data Envelopment Analysis (DEA), by Charnes et al. [2], is a method for evaluating the relative efficiency of comparable entities referred to as Decision Making Units (DMUs). DEA forms a production possibility frontier, or an efficient surface. If a DMU lies on the surface, i.e., there is no other DMU that can either produce the same outputs by consuming less inputs (input-oriented DEA) or produce more outputs by consuming the same amount of inputs (output-oriented DEA), it is referred to as an efficient unit, otherwise inefficient. DEA also provides efficiency scores and reference units for inefficient DMUs.The efficiency score tells the percentage by which a DMU should decrease its inputs (input-oriented DEA) or increase its outputs (output oriented DEA) in order to become efficient. Tracey and Chen [11] first proposed that weight hypothesis may lead to underestimation from additional weight restrictions. However, CCR, based on, implies inherent weight restrictions, and has never been extensively discussed. Such restrictions may lead to a failure to represent the relations of certain weights, thus, output-oriented DEA-R was developed to address such problems ([7]). Since unnecessary and unreasonable weight hypothesis would cause CCR to underestimate the efficiency of a DMU, an input-oriented DEA-R model was developed.
The DEA-R-I model was presented by Despic et al. [7] with weights restrictions. Later, Wei et al. worked on the subject in [3, 4]. In the present paper, basic DEA models such as the envelopment, additive, and enhanced Russell models will be proposed based on the DEA-R-I form. In section 2, a review of DEA is provided. In section 3, basic DEA-R-I models are proposed. Section 4 contains an application of the proposed model by a numerical example for 20 bank branches. Final Section 5 contains conclusions and starting points for future research.
2 Data Envelopment Analysis
Consider n DMUs with m inputs and s outputs. The input and output vectors of DMUj
) , 1, =
(j n are
X
j=
(
x
1j,
,
x
mj)
t,
Y
j=
(
y
1j,
,
y
sj)
t where Xj 0,Xj 0,Yj 0,Yj 0.By using the variable returns to scale, convexity, and possibility postulates, the non-empty production possibility set (PPS) is defined as follows:
( , ): , , 0, =1 ,
. = X Y X =1 X Y =1 Y j nT j j j
n
j j
j n
j
c
By the above definition, the CCR model proposed by Charnes et al. [2] is as follows:
. , 1, = 0,
, 1, = 0,
, 1, = 0,
, 1, = ,
=
, 1, = ,
= .
] [
=1 =1
=1 =1
s r
s
m i
s
n j
s r
y s
y
m i
x s
x t
S
s s
Min
r i
j
rp r
rj j n
j
ip i
ij j n
j
r s
r i m
i
(1)
Clearly, the evaluated DMUp is efficient if and only if * =1 and all slack variables in the optimal solution are zero in problem (1).
2.1 The DEA additive model
The additive model (ADD) maximizes the L1 distance of the DMU under analysis to the projected
=1 =1
=1
=1
. . = , = 1, ,
= , = 1, ,
0, = 1, ,
0, 0, = 1, , , = 1, , .
m s
i r
i r
n
j ij i ip j
n
j rj r rp j
j
i r
M ax s s
s t x s x i m
y s y r s
j n
s s i m r s
(2)Clearly, the evaluated DMUp is efficient if and only if * =1 and all slack variables in the optimal solution are zero in problem (2).
2.2 Enhanced Russell model
Koopmans [8] defined an input-output vector as technically efficient if and only if increasing any output or decreasing any input is possible only by decreasing some other output or increasing some other input, respectively. A nonradial Pareto-Koopmans measure of technical efficiency for DMUp
can be computed as follows:
, 1, = 1
, 1, = 1
, 1, = 0,
, 1, = ,
, 1, = ,
. .
1 1
1 = 1 =
1 1
m i
s r
n j
s r
y y
m i
x x t
s s m Min
i r
j
rp r rj j n
j
ip i ij j n
j s r r
m i i
(3)
3 Input-oriented DEA-R model
Despic et al. [7] proposed a new mathematical model for efficiency score, which combines the DEA methodology with the idea of ratio analysis.
s r
m i
w w
n j
y x y x w t
S Max
ir ir m
i s
r
rp ip rj ij
ir m
i s
r
, 1, = ,
1, = 0 ,
0 1
) 4 ( ,
1, = ,
. .
1 = 1
1 = 1
Model (4) is a DEA-R-I model that calculates the DEA-R-I efficiency score ofDMUp.
=1
=1
. . , = 1, , = 1, , (5)
1,
0, = 1, , . R
ij n
rj
j R
ip j
rp n
j j
j M in
x y
s t i m r s
x y
j n
Definition 1. DMUp is R-CCR-I–efficient (input-oriented CCR –R-efficient) if and only if R* 1.
Model (5) has the following properties.
1) The efficiency and super-efficiency scores obtained by this model are greater than or equal to those of the CCR model.
2) The efficiency scores of the model in the input and output orientations are not necessarily equal.
3) In a situation involving no weight restrictions, the input-target improvement strategy given by DEA-R-I is always better than the CCR-I model.
4) When DEA-R-I weights are concentrated on one output, the CCR-I efficiency and DEA-R-I efficiency are the same.
5) When DEA-R-I weights are not concentrated on multiple outputs, the CCR-I efficiency and DEA-R-I efficiency are the same, with the exception of, every times of corresponding output of targeted DMU. (See [3, 4, 5]).
. , 1, = 0, ) 6 ( , 1, = , 1, = 0 1, , 1, = , 1, = , . . ) ( 1 = 1 = 1 1 n j s r m i S s r m i S y x y x t s S Min j ir j n j ir rp ip rj ij j n j s r m i ir
The additive model based on the DEA-R-I model for distinguishing between efficient and inefficient
units is suggested as follows.
. , 1, = 0, , 1, = , 1, = 0 1, ) 7 ( , 1, = , 1, = 1, . . 1 = 1 = 1 1 n j s r m i S s r m i S y x y x t s S Max j ir j n j ir rp ip rj ij j n j s r m i ir
The enhanced Russell model based on the DEA-R-I model is suggested as follows.
1 1
=1
=1
1
. . , = 1, , = 1, , (8)
1,
1 = 1, , = 1, ,
0, = 1, , .
s m ir r i ij n rj j ir ip j rp n j j ir j M in m s x y
s t i m r s
x y
i m r s
j n
. , 1, = , , , 1 0,
, 1, = 1,
) 9 ( ,
1, = ,
1, = ,
. .
1 =
1 1 1
= 1
n j
n k
n k
s r
m i
y x
y x
t s
Min
kj kj n
j
rj n
j n
j ij
rj ij
kj n
j n
k
4 An application
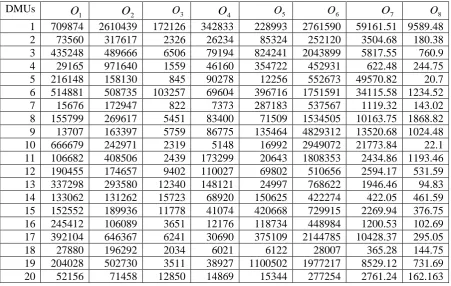
We consider the data of 20 bank branches with three inputs and eight outputs, in the following table:
Table 1.
Outputs and Inputs of bank branches.
Inputs: Outputs:
1. Interest paid 1. Interest-free saving account
2. Level of education of the staff 2. Current account
3. Demand 3. Short-term
4. long-term
5. Other
6. Loans
7. Interest received
Table 2.
Outputs of bank branches.
DMUs
1
O O2 O3 O4 O5 O6 O7 O8
1 709874 2610439 172126 342833 228993 2761590 59161.51 9589.48
2 73560 317617 2326 26234 85324 252120 3504.68 180.38
3 435248 489666 6506 79194 824241 2043899 5817.55 760.9
4 29165 971640 1559 46160 354722 452931 622.48 244.75
5 216148 158130 845 90278 12256 552673 49570.82 20.7
6 514881 508735 103257 69604 396716 1751591 34115.58 1234.52
7 15676 172947 822 7373 287183 537567 1119.32 143.02
8 155799 269617 5451 83400 71509 1534505 10163.75 1868.82
9 13707 163397 5759 86775 135464 4829312 13520.68 1024.48
10 666679 242971 2319 5148 16992 2949072 21773.84 22.1
11 106682 408506 2439 173299 20643 1808353 2434.86 1193.46
12 190455 174657 9402 110027 69802 510656 2594.17 531.59
13 337298 293580 12340 148121 24997 768622 1946.46 94.83
14 133062 131262 15723 68920 150625 422274 422.05 461.59
15 152552 189936 11778 41074 420668 729915 2269.94 376.75
16 245412 106089 3651 12176 118734 448984 1200.53 102.69
17 392104 646367 6241 30690 375109 2144785 10428.37 295.05
18 27880 196292 2034 6021 6122 28007 365.28 144.75
19 204028 502730 3511 38927 1100502 1977217 8529.12 731.69
20 52156 71458 12850 14869 15344 277254 2761.24 162.163
Table 3
Inputs of bank branches.
DMUs
1
I I2 I3
1 12963.87 37.75 134529
2 1483.69 22.74 10244
3 11756.02 25.5 42668
4 866.86 20.94 44128
5 4545.92 14.43 13043
6 9139.03 18.86 87981
7 308.67 25.66 97763
8 3185.7 26.27 7629
9 832.02 21.91 430513
10 11589.09 16.75 7859
11 2886.74 21.2 1192
12 3880.46 23.67 53209
13 6269.71 21.85 27506
14 2616.9 21.56 17988
15 2600.23 37.5 50229
16 4257 24.5 32618
17 6179.39 25.72 41817
18 528.92 16.28 22262
Table 4
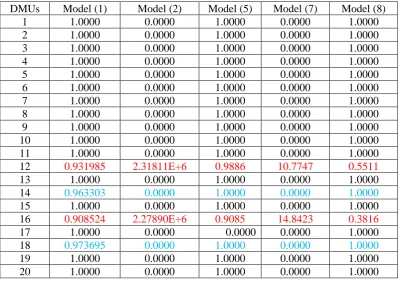
Efficiency score for commercial bank branches
DMUs Model (1) Model (2) Model (5) Model (7) Model (8)
1 1.0000 0.0000 1.0000 0.0000 1.0000
2 1.0000 0.0000 1.0000 0.0000 1.0000
3 1.0000 0.0000 1.0000 0.0000 1.0000
4 1.0000 0.0000 1.0000 0.0000 1.0000
5 1.0000 0.0000 1.0000 0.0000 1.0000
6 1.0000 0.0000 1.0000 0.0000 1.0000
7 1.0000 0.0000 1.0000 0.0000 1.0000
8 1.0000 0.0000 1.0000 0.0000 1.0000
9 1.0000 0.0000 1.0000 0.0000 1.0000
10 1.0000 0.0000 1.0000 0.0000 1.0000
11 1.0000 0.0000 1.0000 0.0000 1.0000
12 0.931985 2.31811E+6 0.9886 10.7747 0.5511
13 1.0000 0.0000 1.0000 0.0000 1.0000
14 0.963303 0.0000 1.0000 0.0000 1.0000
15 1.0000 0.0000 1.0000 0.0000 1.0000
16 0.908524 2.27890E+6 0.9085 14.8423 0.3816
17 1.0000 0.0000 0.0000 0.0000 1.0000
18 0.973695 0.0000 1.0000 0.0000 1.0000
19 1.0000 0.0000 1.0000 0.0000 1.0000
20 1.0000 0.0000 1.0000 0.0000 1.0000
5 Conclusion
Regarding the fact that basic DEA models, such as the input-oriented envelopment form, the additive model, etc., play a fundamental role in many DEA contexts, using these models in the DEA-R-I form can be very important for comparing the efficiency –projection of DMUs and for their ranking. Further concentration on DEA-R-I models maintains the value of basic DEA models. It can also help to develop and extend different contexts in performance evaluation of DMUs. Ranking of DMUs and finding a suitable benchmark by using the proposed models can be considered for further studies.
References
[1] Banker ,R.D. , Charnes A. and Cooper W.W.( 1984). Some models estimating technical and and scale inefficiencies in Data Envelopment Analysis. Management Science 30,1078-1092.
[2] Charnes, A., Cooper, W.W., Rhodes, E. (1978). Measuring the efficiency of decision making units. European Journal of Operational Research 2, 429-444.
[3] Ching-Kuo Wei , Liang-Chih Chen , Rong-Kwei Li, Chih-Hung Tsai.( 2011). Using the
DEA-R model in the hospital industry to study the pseudo-inefficiency problem. Expert Systems with Applications, 38, 2172–2176.
[5] Ching-Kuo Wei , Liang-Chih Chen , Rong-Kwei Li, Chih-Hung Tsai. (2011). A study of developing an input- oriented ratio-based comparative efficiency model. Expert Systems with Applications, 38, 2473–2477.
[6] Cooper, W., Seiford, L., Tone, K., (2002). Data envelopment analysis a comprehensive text with Models applications references , DEA solved software. Third Printing. By Kluwer academic publishers.
[7] Despic, O., Despic, M., & Paradi, J. C. (2007). DEA-R: Ratio-based comparative efficiency model, its mathematical relation to DEA and its use in applications. Journal of Productivity Analysis, 28(1), 33–44.
[8] Koopmans, T.C.(1951). An analysis of production as an efficient combination of activities. In: Koopmans, T.C. (Ed.), Activity Analysis of production and Allocation. Wiley ,New York.
[9] Lozano S, Villa G. (2004). Centralized resource allocation using data envelopment analysis. Journal of Productivity Analysis, 22(1-2), 143–161.
[9] R. R. RUSSELL, 1985. Measures of technical efficiency, J. Econ. Theory 35, 109-126.
[10] Tone, K., 1997. A slack based measure of efficiency in data envelopment analysis. Research report, Institute for Policy Science, Saitama University, August.