R E S E A R C H
Open Access
Metabolic shift in density-dependent stem
cell differentiation
Simar J. Singh
1, William Turner
2, Drew E. Glaser
2, Kara E. McCloskey
2and Fabian V. Filipp
1*Abstract
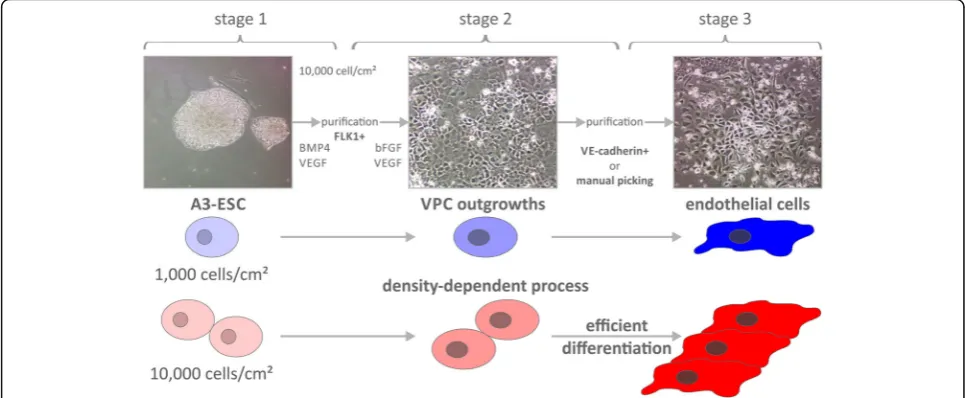
Background:Vascular progenitor cells (VPCs) derived from embryonic stem cells (ESCs) are a valuable source for cell- and tissue-based therapeutic strategies. During the optimization of endothelial cell (EC) inductions from mouse ESCs using our staged and chemically-defined induction methods, we found that cell seeding density but not VEGF treatment between 10 ng/mL and 40 ng/mL was a significant variable directing ESCs into FLK1+VPCs during stage 1 induction. Here, we examine potential contributions from cell-to-cell signaling or cellular metabolism in the production of VPCs from ESCs seeded at different cell densities.
Methods:Using 1D 1H-NMR spectroscopy, transcriptomic arrays, and flow cytometry, we observed that the density-dependent differentiation of ESCs into FLK1+ VPCs positively correlated with a shift in metabolism and cellular growth.
Results: Specifically, cell differentiation correlated with an earlier plateauing of exhaustive glycolysis, decreased lactate production, lower metabolite consumption, decreased cellular proliferation and an increase in cell size. In contrast, cells seeded at a lower density of 1,000 cells/cm2exhibited increased rates of glycolysis, lactate secretion, metabolite utilization, and proliferation over the same induction period. Gene expression analysis indicated that high cell seeding density correlated with up-regulation of several genes including cell adhesion molecules of the notch family (NOTCH1 and NOTCH4) and cadherin family (CDH5) related to vascular development.
Conclusions:These results confirm that a distinct metabolic phenotype correlates with cell differentiation of VPCs.
Keywords:Stem cells, Differentiation, Vascular fate, Cell seeding density, Systems biology, Metabolism, NMR, Metabolomics, Fluorescence-activated cell sorting, Flow cytometry, Cell adhesion, Cell contact, Cell communication, Microenvironment, Cancer stem cells, Embryonic stem cells, Vascular progenitor cells, Endothelial cells
Background
Vascular progenitor cells (VPCs) and endothelial cells (ECs) are desirable cell sources for cellular therapeutic and tissue engineering strategies including: peripheral vascular disease [1, 2], severe ischemic heart disease [3, 4] and lining the lumens of small diameter vascular grafts in order to minimize thrombosis or arteriosclerosis [5, 6]. In cancer, the vascular niche promotes cancer stem cells (CSCs) and is enriched with CSC-derived ECs, which promote tumor invasion and metastasis [7]. VPCs are important for maintenance of the stemness of normal
adult stem cells, including self-renewal, undifferenti-ated status, and dormancy. However, it is sometimes difficult to obtain sufficient numbers of proliferating VPCs and ECs, especially from aged adults and diseased patients [6]. Alternatively, embryonic stem cells (ESCs) and induced pluripotent stem cells (iPSCs) with their unlimited capacity for self-renewal, are considered excellent cell sources in a variety of cell-based therapies. In addition to their growing therapeutic applications, these cell sources in combination with derived VPCs and ECs can also serve as representa-tive in vitro models of vascular development.
During early stages of vascular development, sig-naling from vascular endothelial growth factor (VEGF = VEGFA, vascular endothelial growth factor * Correspondence:[email protected]
1Systems Biology and Cancer Metabolism, Program for Quantitative Systems
Biology, University of California Merced, 2500 North Lake Road, Merced, CA 95343, USA
Full list of author information is available at the end of the article
A, GeneBank: 7422) and the VEGF receptor, FLK1 (FLK1 = VEGFR = KDR, kinase insert domain recep-tor, GeneBank: 3791) promotes ventral mesoderm and hematopoietic fate [8–10] leading to activation of the mitogen activated protein kinase pathway [11]. Endothelial, hematopoietic, and smooth muscle cells have been derived from outgrowths of FLK1+ VPCs, making this VEGF receptor a hallmark for identifica-tion of VPCs [12]. However, despite our growing un-derstanding of the critical biochemical factors in development, the precise timing and quantitative levels of EC induction/activation for directing vascular fate from ESCs in vitro have remained confounding. This is complicated by the inherent variability in kinetic and autocrine signaling from ESC line-to-ESC line [13]. For example, the optimal time to induce the mouse D3-ESC line into FLK1+ VPCs has been reported to occur at day 4 (FLK1+ = FLK1 positive = VEGFR expressing cells) [14–16], while the optimal time for the corresponding mouse R1-ESC line has been reported at day 2 [17]. Add-itionally, while VEGF is the most published growth factor associated with directing EC differentiation, published treatment levels vary between 20 ng/mL and 50 ng/mL [12, 15, 18]. Matrix signaling is also an important signal in stem cell fate, but studies on this topic have also been con-flicting. For example, it has been reported that collagen type-IV directs a higher percentage of ECs [12, 15, 18]. However, more recent studies show fibronectin pro-motes increased cell adhesion and/or proliferation, gener-ating greater numbers of VPCs and ECs compared with collagen-type IV [1, 17]. Moreover, increasing evidence
supports a role for modified cellular metabolism in the regulation of stem cell self-renewal, specification, and plasticity in cancer and development [19–21]. Despite this growing understanding of cellular metabolism as a regulator of cell function, the role of cell seeding den-sity in metabolic alterations supporting vascular fate is not defined.
Therefore, using our established staged differentiation methodology and chemically-defined media formulations (Fig. 1a), we examined a number of combinatorial variables (induction time, VEGF treatment, matrix signaling, and cell seeding density) for directing the generation of VPCs (stage 1). The results indicated that cell seeding density was a significant factor in the first stages of induction of ESCs into VPCs, especially in the A3-ESC cell line [22] generated by our own laboratory. Therefore, we set out to further examine the underlying mechanisms related to density-dependent differentiation in this ESC line.
Methods
Embryonic stem cell culture
Mouse A3-ESCs were extracted, generated, and cultured at 3,000/cm2on inactivated mouse embryonic fibroblasts (MEFs; 20,000/cm2) [22]. Prior to induction, the A3-ESCs are purified from MEFs by gravity separation followed by MEF adhesion to tissue culture dishes for 1–2 hours and passaged onto 0.5% gelatin-coated plates in ESC culture media containing: Knockout Dulbecco’s Modified Eagle Medium (KO-DMEM; Invitrogen), 15% Knockout Serum Replacer (KSR; Invitrogen), 1Χ penicillin-streptomycin
Fig. 1Higher seeding density yields higher expression of differentiation marker FLK1 (FLK1 = VEGFR = KDR, VEGF receptor, kinase insert domain receptor). Schematic of staged differentiation of embryonic stem cells (ESCs) into vascular progenitor cells (VPCs) and endothelial cells (ECs) with representative micrographs from A3-ESCs seeded at 10,000 cells/cm2. Stage 1 involves the culturing of ESCs on fibronectin in the presence of
(Invitrogen), 1Χ non-essential amino acids (Invitrogen), 2 mM L-glutamine (Invitrogen), 0.1 mM 2-mercaptoethanol (Calbiochem), 2000 units/mL of leukemia inhibitory factor (LIF-ESGRO; Chemicon), and 10 ng/mL of bone morphogenetic protein 4 (BMP4, GeneBank: 652) (R&D Systems). Full media changes occurred every other day and cells were passaged every 4–5 days.
Induction of FLK1+VPCs
A3-ESCs were harvested and plated at either 1,000, 5,000 or 10,000 cells/cm2in 12-well cell culture dishes, coated with 50 ng/mL fibronectin (BD Biosciences), and fed our induction media: alpha-minimal essential medium (MEM; Corning), 20% KSR (Invitrogen), 1Χ penicillin-streptomycin (Invitrogen), 1Χ nonessential amino acids (Invitrogen), 2 mM L-glutamine (Invitrogen), 0.05 mM 2-mercaptoethanol (Calbiochem), and 5 ng/mL BMP4 (R&D Systems), and 0 to 30 ng/mL of VEGF (R&D Systems) without media change for 4 days. Experi-ments were conducted in triplicate (N= 3) allowing for analysis of variance. The assessment of stage 1 VPCs, which are not contact-inhibited, was quantified by the percentage of FLK1+ cells over time, previously shown to correlate with down-regulation of the pluripotent stem cell marker POU class 5 homeobox 1 (POU5F1 = OCT3/4, GeneBank: 5460) over the same time period [22].
Characterization of VPCs
Adherent cells were harvested using Cell Dissociation Buffer (Invitrogen), fixed in 4% paraformaldehyde (Tousimis), rinsed 2Χ with phosphate buffered saline (PBS), blocked using 0.5% donkey serum (Fitzgerald) and 1% bovine-serum albumin (Sigma) for 1 h at room temperature, and stained with Alexa Fluor 647®-conju-gated anti-FLK1 antibody (Biolegend) at 1:100 and allowed to incubate overnight at 4 °C. Cells were rinsed 2Χ with PBS before being analyzed on an LSR II flow cytometer (BD Biosciences) and FloJo Software (TreeStar) at 1, 2, and 3 days post induction of differentiation. Samples were analyzed in triplicate (N= 3) for each data point.
Exometabolome analysis
Triplicate samples of conditioned induction media (N= 3) were harvested at 1, 2 and 3 days post-induction and stored at −80 °C. Prior to 1D 1H-NMR spectroscopy metabolomics analysis, supernatants were extracted using 1:1 cold methanol (BDH 67-56-1) and chloroform (Amresco 0757) mixture [7]. The extracts were cleared by centrifugation at 14,000 g and the aqueous phase was collected. Freeze-dried metabolite samples were resus-pended in 200 μL of H20 with 5% D2O spiked with 0.75% 3-(trimethylsilyl)propanoic-2,2,3,3-d4 acid (TSP) (Sigma 293040) to a final concentration of 2.409 mM into 3 mm NMR tubes (Norrell C-S-3-HT-7). Spectra
were recorded using 1D 1H excitation sculpting at 512 scans, d1 = 1 s, 1H pulse 11.0 μs, power level of shaped pulse 25.55db and an experimental time of 10 min at 300 K at an Avance II 600-MHz spectrometer fitted with a cryogenic probe operating with TOPSPIN 2.0 (Bruker BioSpin GmbH). All spectra were automati-cally phased, baseline corrected and referenced to TSP (δ 0.00 ppm) using Chenomx NMR spectroscopy suite 8.1 (Chenomx Inc). Metabolite concentrations were quantified on the basis of matching chemical shifts and multiplicities to the Chenomx reference compound library. Exometabolome analysis by NMR spectroscopy provides direct comparison of absolute metabolite con-centrations of analytes. Not surprisingly, the amount of metabolites excreted or taken up scales with the initial seeding density. Therefore, by normalizing each time point to the first time point post-induction, dynamic infor-mation of the system can be obtained. The total cell count prior seeding was obtained in triplicate (N= 3) by analy-zing cells accurately using multifocal plane analysis in the TC20 automated cell counter (Biorad).
Cell size and proliferation
Cell diameter and proliferation rates were measured over the 3 days of VPC induction using an automated image-based cytometer. Cells were harvested using 0.25% trypsin-EDTA (Corning) from fibronectin coated cultures dishes at 1, 2 and 3 days post induc-tion of differentiainduc-tion, stained with trypan blue, and pipetted into disposable counting chambers for count-ing and image analysis. Cell diameter measurements of live differentiating ESCs were obtained in the TC20 automated cell counter (Biorad). Multi-planar bright-field digital images were automatically collected, quantified, and assessed for cell number and diameter. Cell proliferation rates were calculated and densities validated from the live cells per dish (N= 6) over the 3 days of VPC induction.
Differential gene expression
housekeeping genes (HKG), ACTB, actin beta, GeneBank: 60, B2M, beta-2-microglobulin, GeneBank: 567, GAPDH, glyceraldehyde-3-phosphate dehydrogenase, GeneBank: 2597, GUSB, glucuronidase beta GeneBank: 2990, and HSP90AB1, heat shock protein 90 kDa alpha family class B member 1, GeneBank: 3326. The difference threshold cycle value (ΔCT) of any gene of interest (GOI) to the average housekeeping value was calculated using the formula ΔCT(GOI) = CT(GOI)— AVERAGE(CT(HKG)) for ESCs, differentiating cells at seeding density of 1,000 cells/cm2 and 10,000 cells/cm2. In addition, change in gene expres-sions of any gene of interest was monitored by calculating
ΔΔCT(GOI) =ΔCT(GOI-10 K) — ΔCT(GOI-1 K).
RT2 gene array profiles were normalized, separated according to differential expression between the two seeding densities in univariate T-tests with a random variance model using a p-value cut-off below 0.05, and ranked with LOG2 fold-change of specimen seeded at 10,000 cells/cm2in comparison to 1,000 cells/cm2 consi-dered significant.
Differential protein expression analysis
Induced VPCs originally seeded as ESCs at 1,000 cells/cm2 or 10,000 cells/cm2were harvested 3 days post induction. Cells were fixed, washed, and blocked in PBS supple-mented with 2% fetal bovine serum (FBS; Corning 35-010-CV). Cells were incubated light-protected at 4 °C for 1 h with the following antibodies and staining reagents: FLK1 PerCP (Biolegend 121915), CDH2 rabbit polyclonal (Abcam ab12221), CDH5 (CD144) brilliant violet 421 (Bio-legend 138013), and Fixable Viability Dye eFluor780 (eBioscience 65-0865-14). After washing, cells were incu-bated light protected at 4 °C for 1 h with FITC conjugated Donkey Anti-Rabbit IgG pre-adsorbed (Abcam ab7079). Samples were rinsed twice with PBS supplemented with 2% FBS before being analyzed on an LSR II flow cyt-ometer (BD Biosciences) at a flow rate at least 500 events per second. 100,000 events per sample were re-corded and samples were analyzed in triplicate (N= 3) for each data point. FloJo Software (TreeStar) was used for data analysis. Dead cells were gated out from analysis based on Viability Dye eFlour780 reactivity. FLK1+ cells were then analyzed for FITC (CDH2) and Brilliant Violet 421 (CDH5) fluorescence and the percent-age of Flk1+/CDH2+CDH5+ cells were compared between low density and high density groups.
Results
Characterization of differentiated FLK1+VPCs
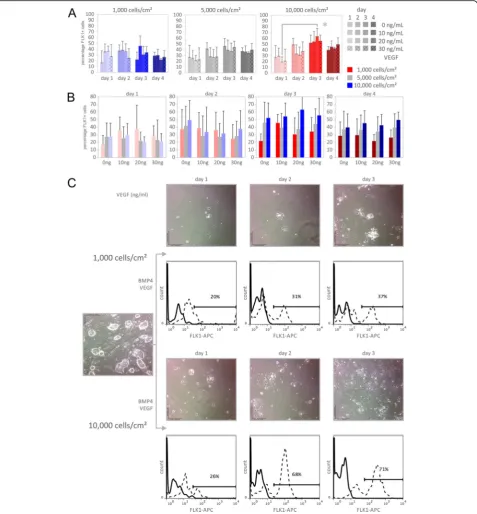
Induction of mouse A3-ESCs [22] into VPCs was exam-ined over a range of seeding densities, VEGF treatment levels, and time (Fig. 2a). The greatest number of FLK1+ cells was generated on day 3, with a reduction at day 4. Although the VEGF treatment levels led to variable
results, the greatest number of FLK1+VPCs was consist-ently and statistically significant in cultures seeded at the highest seeding density (Fig. 2a-b) while cells initially seeded at 1,000 cells/cm2 generated significantly fewer FLK1+ cells. Bright field microscopy revealed that after three days, the 10,000 cells/cm2seeding density remained subconfluent (Fig. 2c).
Metabolic shift during density-dependent differentiation To identify density-dependent changes in cellular metabol-ism during differentiation, we measured metabolite abun-dance within conditioned media using 1D 1H-NMR spectroscopy. This exometabolome analysis provides in-sights into metabolite utilization and secretion. A reduction in metabolite abundance is consistent with cellular uptake from our chemically defined induction media, whereas an increase in abundance correlates with active production and extracellular secretion. Of the metabolites in the differ-entiation media profiled, only lactate exhibited an increase in abundance. Cells seeded at a density of 10,000 cells/cm2 displayed a rapid increase in lactate production between days 1 and 2, which then slowed between days 2 and 3 (Fig. 3a-b). Conversely, cells grown at a density of 1,000 cells/cm2produce, on a per cell basis, comparatively more lactate, and exhibit a significant increase in lactate abun-dance between days 1 and 3 (9.0 vs 3.8; p-value < 0.001) (Fig. 3a-b). The same trend is seen in metabolite utilization. Cells grown at a density of 10,000 cells/cm2exhibit higher rates of metabolite utilization between day 1 and day 2, and much lower utilization between days 2 and 3 (Fig. 3c-d). In contrast, cells seeded at lower density increase their metab-olite uptake over time, exhibiting their highest levels of utilization between days 2 and 3 (Fig. 3c-d).
Differentiation correlates with increased cell size and reduced proliferation
Fig. 3Density-dependent shift of metabolic rate. 1D1H-NMR spectroscopic exometabolome analysis of conditioned media from induced
embry-onic stem cells (ESCs) initially seeded at 1,000 cells/cm2(
blue) and 10,000 cells/cm2(
red).aBy day 3, cells seeded at higher density reduce produc-tion of lactate whereas cells initially seeded at low density continue to increase lactate producproduc-tion and exhibit a significantly higher fold increase in lactate abundance between days 1 and 3 (9.0 vs 3.8; ***p-value < 0.001).bFold change of lactate production relative to day 1.cAmino acid uptake of valine, isoleucine, phenylalanine, and glutamine/glutamate (glx) significantly increases in the low density group after two days of induction (***p-value < 0.001).dAmino acid uptake plateaus between 2 and 3 days post induction in the higher density group. Fold change of amino acid up-take relative to day 1
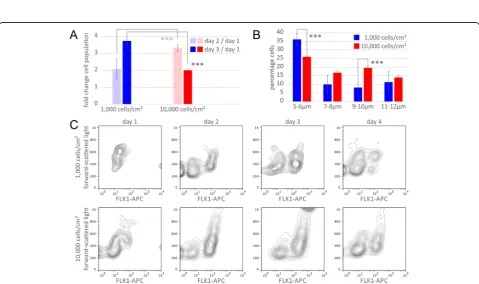
Fig. 4Density-dependent shift of proliferation and cell diameter.aProliferation rate significantly slows at day 3 in cells seeded at 10,000 cells/cm2 (red) but increases in cells seeded at 1,000 cells/cm2(
blue; fold increase of 2.1 vs 3.7; ***p-value < 0.001).bHigher density cells have a greater percentage of cells with large diameter (9–10μm, 19.6% vs 8.2%; ***p-value < 0.001) and fewer small diameter cells (5–6μm, 26.1% vs 36.2%; ***p-value < 0.001).cFlow cytometric cell scanning contour plot indicating 10,000 cells/cm2seeding density results in a greater proportion of cells
diameter were found in cultures seeded at a density of 10,000 cells/cm2compared with lower density (9–10μm, 20% vs 8%; p-value < 0.001) (Fig. 4b). The forward scatter measurements from fluorescence-activated cell sorting in flow cytometry, another indication of cell size, show that the early A3-ESCs are smaller compared with the larger differentiated FLK1+VPCs (Fig. 4c).
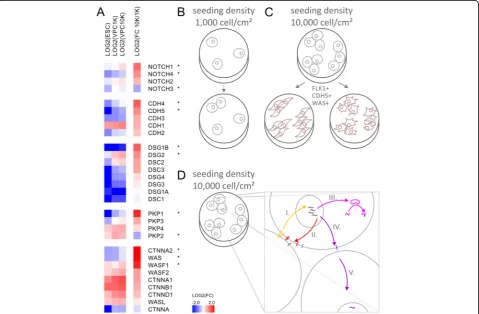
Differential gene expression of cell-to-cell signaling molecules during density-dependent differentiation In order to further investigate the density-dependent signaling directing FLK1+VPCs, a number of cell-to-cell signaling molecules were examined using a targeted PCR array. The expression pattern of cells seeded at densities of 10,000 cells/cm2 or 1,000 cell/cm2 revealed significant differential expression with p-values below 0.05 and a fold change of 2.0 or higher (Fig. 5a). Gene expression
pattern included significant up-regulation of NOTCH1 (GeneBank: 4851), NOTCH4 (GeneBank: 4855), CDH4, cadherin 4, retinal, R-cadherin (GeneBank: 1002), CDH5, cadherin 5, vascular endothelium, VE-cadherin (GeneBank: 1003), DSG1B, desmoglein 1 (GeneBank: 1828), DSG2, desmoglein 2 (GeneBank: 1829), PKP1, plakophilin 1 (GeneBank: 5317), CTNNA2, catenin cadherin-associated protein alpha 2 (GeneBank: 1496), WAS, Wiskott-Aldrich syndrome (GeneBank: 7454), and WASF1, WAS protein family, member 1 (GeneBank: 8936) as well as significant down-regulation of NOTCH3 (GeneBank: 4854), and PKP2, plakophilin 2 (GeneBank: 5318).
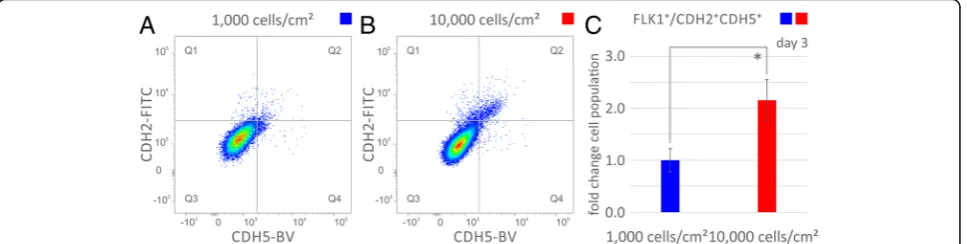
Differential protein expression of cell-to-cell signaling molecules during density-dependent differentiation Protein level differences in cell-to-cell signaling molecule expression were quantified by flow cytometry (Fig. 6).
Fig. 5Differential gene expression analysis of density-dependent differentiation identifies molecules related to cellular adhesion and vascular genesis. aGene expression analysis of embryonic stem cells (ESCs) as well as vascular progenitor cells (VPCs) seeded at density of 1,000 vs 10,000 cells/cm2.
The logarithmic fold change of cells seeded at 10,000 cells/cm2in comparison to 1,000 cells/cm2(LOG2(FC 10 K/1 K)) identifies density-depended
processes. Gene symbols labeled with an asterisk * indicate significant differential expression withp-values below 0.05. Schematic model compares: bPoor differentiation efficiency of embryonic stem cells seeded at low density of 1,000 cells/cm2, where isolated cells eventually die off.cSeeding of
embryonic stem cells at high density of 10,000 cells/cm2results in expression of differentiation markers of vascular progenitor cells, which are a potent
Induced VPCs originally seeded at 1,000 cell/cm2 or 10,000 cells/cm2 were stained and analyzed for FLK1, CDH2 (cadherin 2, neuronal, N-cadherin, GeneBank: 1000) and CDH5 expression. Importantly, the cell adhesion molecule CDH5, VE-cadherin, is indicative of vascular endothelial differentiation. The percentage of cells staining positive for FLK1, CDH2, and CDH5, FLK+/CDH2+CDH5+, quadrant 2, (Fig. 6a-b) was higher for cells originally seeded at 10,000 cells/cm2 than those seeded at 1,000 cells/cm2 (1.51% vs 0.70%,p< 0.01) (Fig. 6c).
Discussion
The generation of FLK1+ VPCs from ESCs peaks on day 3, followed by a reduction in FLK1+ numbers (Fig. 2ab) within the range of reported days (2–5) during mesoderm induction from ESCs [15, 17, 22–25]. The other significant variable in the efficient induction of VPCs was a high cell seeding density (Fig. 2a-b), while VEGF treatment level was not significant. The higher density and robustly differ-entiating VPC cultures also correlated with reduced prolif-eration rates and greater cell diameters, both indicative of differentiation (Fig. 4). Although these cells are not con-tact inhibited nor were they confluent cultures, hypoxia is known to drive mesoderm commitment [26, 27] and endothelial fate [19] from ESCs. To determine whether hypoxia could drive ESC differentiation, we calculated the molar fraction of oxygen at the cell surface of our high density cell dishes cultures. Using our experimental cell proliferation rates, estimated oxygen solubility in saline solution, and oxygen consumption rates reported for both ESCs = 27.5x10⁻¹⁸ [28] and ECs = 50x10−18 mol/cell/s [20], it was determined that, although oxygen would be reduced at higher cell seeding densities, none of the con-ditions would generate a hypoxic environment (defined as 1-3% oxygen).
Interestingly, VEGF treatment was not a determining or statistically significant variable in directing VPC fate. A large body of data implicates VEGF signaling in mesoderm and endothelial cell fate and that the FLK1/VEGF receptor is one of the key markers defining the angioblast cell [12, 14, 29, 30]. However, since BMP4 signaling can also activate the VEGF/VEGFR signaling [31, 32], it is sufficient in the inductions shown. Moreover, the two distinct VEGF binding domains in the fibronectin matrix [33] may stabilize and protect autocrine VEGF production from degradation [33], as well as, aid in cell presentation. The presumptive requirement of VEGF treatment in chemically-defined media for EC fate has been most rigorously exam-ined using single cells cultured in collagen-type IV coated 96-well plates [12, 30, 34]. Without fibronectin matrix to sequester and protect the VEGF generated by the cells, one might expect that VEGF treatment would be required in these cultures. However, our results suggest that the utilization of fibronectin matrix mitigates the need for VEGF supplementation in VPC induction cultures.
Differential gene expression array analysis identified a number of cell-to-cell signaling molecules that were up-regulated in the higher density cultures containing more VPCs. Differential expression of cell surface receptors, desmosome, catenins, and cytoskeleton regulators could be required for, or facilitate, the density-dependent differentiation of ESCs (Fig. 5b-d). Vascular cells take advantage of many different cell adhesion contacts demonstrated by the global up-regulation of cadherins, desmosomal and desmoglein components. Since cell sur-face molecules have the ability to communicate extracel-lular changes into the cytosol, such as contact formation with neighboring cells, the gene expression data suggests a positive feedback reinforcing cellular contacts (Fig. 5d). Initial cell-cell contacts mediate signals into the nucleus,
where transcriptional changes create positive feedback promoting and strengthening cell surface contacts and stimulating regulators of adherens junctions and desmo-somes. Positive feedback circuits have the ability to cre-ate threshold densities for successful differentiation. Once established and supported by the cell type specific cell surface contacts molecules, signals of differentiation can lead to lineage committed cell fates and organized tissue formation.
Amongst genes exhibiting the strongest change in the context of seeding density-dependent differenti-ation of VPCs were the cytoskeleton regulators WAS and CTNNA2. The expression pattern for both genes is unaffected in the lower density cohort but was con-sistently up-regulated in the higher density cohort. Wiskott-Aldrich syndrome protein (WASP) is a key regulator of endothelial cell-cell junctions and cyto-skeleton dynamics and helps form and maintain the integrity and function of EC monolayers [35]. More-over, WASP organizes actin and vascular epithelium-cadherins at EC junctions, and hence is vital for the assembly of vascular structures [35–37]. Importantly, along with FLK1 expression, WAS and CDH5 are also indicators of vascular differentiation [8]. Other studies have identified members of the E-twenty six (ETS) transcription factor family associating with FLK1 and CDH5 promoters in vascular epithelia to regulate vascular specification from primitive mesoderm [8–10, 38]. In murine and amphibian model organisms, plakophilins have been found localized to the nucleus of ESCs and form complexes with members of the ETS family of transcription factors to direct development related gene transcription events [39].
Similar to PKP1, CTNNA1, catenin cadherin-associated protein, alpha 1 (GeneBank: 1495) and AJAP1, adherens junctions associated protein 1 (GeneBank: 55966) expres-sion levels are correlated with advancing tumor stage and inversely related to cell proliferation [32, 40, 41]. While CTNNA2 has been found as hub for extracellular matrix organization, loss of CTNNA1 is exhibited by multiple cancer types, and restoration of CTNNA1 expression in acute myeloid leukemia cells led to lower proliferation [27, 40]. Additionally CTNNA1 regulates differentiation events in the developing nervous system by maintaining beta-catenin signaling [42]. It is possible that the higher levels of PKP1 and CTNNA1 seen in the 10,000 cells/cm2
density group causes these cells to slow their prolife-ration in favor of differentiation and growth. The regulation of desmosomal assembly by DSG1B, DSG2, and PKP1 not only enforces cell surface adhesion contacts between ECs but also regulates the cell signaling events in the cytoplasm and nucleus. DSG2 regulates actin assembly in ECs and affects prolifera-tion via modulaprolifera-tion of EGFR signaling [43, 44]. PKP1
associates with eukaryotic translation initiation factor 4A1 to stimulate protein translation [45] and loss of PKP1 is linked to prostate cancer proliferation [46]. Nuclear PKP1 complexes with catenin and is found bound to single stranded DNA [47]. PKP2, which is more abundant in the lower density group, binds to catenin and complexes with the RNA polymerase III holoenzyme [48].
The cadherin family uniformly responds to density-dependent differentiation [36, 37]. All cadherins assayed show up-regulation in the higher density co-hort. CDH4 shows the highest density-dependent fold-change of the cadherin family. In addition to significant density-dependent up-regulation, vascular endothelial CDH5 is also significantly different be-tween undifferentiated and induced ESCs. Of the desmosomal, desmocollin, and desmoglein compo-nents, DSG1B, DSG2, and PKP1 stand out as positive responders to density-dependent differentiation sup-porting formation of cell surface adhesion contacts in endothelial formation. For the majority of cell surface, cell junction and desmosomal components, a global increase in gene expression in response to density-dependent seeding is observed.
Among the differentiation and density-dependent effects on gene expression, perhaps the most pro-found is differential expression of the NOTCH recep-tor family. NOTCH signaling is a highly conserved intercellular signaling mechanism essential for proper cell fate choices during development [49]. Both NOTCH1 and NOTCH4 have both been implicated in vascular morphogenesis [50]. Moreover, NOTCH1 is found expressed in both endothelial and hematopoietic progenitor cells [51], while NOTCH4 is expressed in ECs, but not in hematopoietic progenitor cells [50]. NOTCH3 signaling is highest in late stage smooth muscle cell differentiation [52] and neural differentiation [53]. In the high cell density cultures, NOTCH1 and NOTCH4 were significantly up-regulated, while NOTCH3 is significantly down-regulated at induction conditions of 10,000 cells/cm2 compared with the lower density cultures.
regulating glutamate metabolism, including glutaminase and several glutamate transporters [55]. Tight regulation of glutaminase activity and glutamate metabolism are vital features of both stem cell function and tumor sur-vival [11, 30, 44]. Interestingly, glutamine metabolism also regulates chromatin structure and pluripotency related transcription factors, such as OCT4, and therefore may play a pivotal role in vascular development [20]. Additional studies examining the role of cell-cell signaling components, particularly NOTCH, in the regulation of glutaminergic and other metabolic pathways could help optimize strategies for ESC differentiation and understand NOTCH-mediated cancer progression.
An increase in cell size correlating with stem cell differentiation is intimately coupled to loss of “ stem-ness”. Moreover, larger cells proliferate more slowly compared to smaller cells [56]. While in cancer cells, a positive feedback is used to rapidly ramp up a distinct metabolic program [57], cellular differenti-ation is accompanied by a switch in metabolism from an exponential proliferative mode into a differentiated phenotype. During the time course of differentiation, ESCs start out as small, rapidly dividing cells, but rapidly shift away from exhaustive glycolysis and high metabolite consumption to a reduced metabolic de-mand per cell. This observed switch in metabolism also supports the changing demands of larger, more differentiated VPCs. Our data shows that the gene expression program of these differentiating ESCs also dynamically responds to the culture conditions at higher cellular density, and actively reinforces cell surface signaling components leading to up-regulation of genes associated with VPC fate. This strengthening of cellular communication may help regulate the concurrent switch of metabolism from an exponential, proliferative mode to a differentiated, growth permis-sive phenotype.
Conclusions
In summary, we have identified a density-dependent metabolic shift correlating with increased differenti-ation of VPCs from ESCs. This density-dependent differentiation model is associated with reduced cellu-lar metabolism, highlighted by a decrease in exhaust-ive glycolysis, by a decrease in proliferation, and by an increase in cell size. Concomitant is enhanced expression of cell-cell signaling components, including those known to regulate the differentiation and me-tabolism of stem cells via density-sensing positive feedback circuits. In the future, efficient tissue engineering approaches may take advantage of such density-dependent switches and control crosstalk between cell-cell signaling and cell-cellular metabolism.
Abbreviations
CSCs:Cancer stem cells; CT: Threshold cycle; ECs: Endothelial cells; ESCs: Embryonic stem cells; ETS: E-twenty six; FBS: Fetal bovine serum; GOI: Gene of interest; HKG: Housekeeping genes; iPSCs: Induced pluripotent stem cells; KO-DMEM: Knockout Dulbecco’s Modified Eagle Medium; KSR: Knockout serum replacer; LIF: Leukemia inhibitory factor; MEFs: Mouse embryonic fibroblasts; MEM: Minimal essential medium; PBS: Phosphate buffered saline; QPCR: Quantitative polymerase chain reaction; RT: Real-time; TSP: (trimethylsilyl)propanoic-2,2,3,3-d4 acid; VPCs: Vascular progenitor cells; WASP: Wiskott-Aldrich syndrome protein;ΔCT: Difference threshold cycle value
Used gene symbols
ACTB:actin beta, GeneBank: 60; AJAP1: adherens junctions associated protein 1, GeneBank: 55966; B2M: beta-2-microglobulin, GeneBank: 567; BMP4: bone morphogenetic protein 4, GeneBank: 652; CDH2: cadherin 2, type 1, neuronal, N-cadherin, GeneBank: 1000; CDH4: cadherin 4, type 1, retinal, R-cadherin, GeneBank: 1002; CDH5: cadherin 5, type 2, vascular endothelium, VE-cadherin, GeneBank: 1003; CTNNA1: catenin (cadherin-associated protein), alpha 1, GeneBank: 1495; CTNNA2: catenin (cadherin-associated protein), alpha 2, GeneBank: 1496; DSG1B = DSG1: desmoglein 1, GeneBank: 1828; DSG2: desmoglein 2, GeneBank: 1829; FLK1 = VEGFR = KDR: kinase insert domain receptor, GeneBank: 3791; GAPDH: glyceraldehyde-3-phosphate dehydrogenase, GeneBank: 2597; GUSB: glucuronidase beta, GeneBank: 2990; HSP90AB1: heat shock protein 90kDa alpha class B member 1, GeneBank: 3326; NOTCH1: notch1, GeneBank: 4851; NOTCH3: notch3, GeneBank: 4854; NOTCH4: notch4, GeneBank: 4855; PKP1: plakophilin 1, GeneBank: 5317; PKP2: plakophilin 2, GeneBank: 5318; POU5F1: OCT3/4, POU class 5 homeobox 1, GeneBank: 5460; VEGFA = VEGF: vascular endothelial growth factor A, GeneBank: 7422; WAS: Wiskott-Aldrich syndrome, GeneBank: 7454; WASF1: WAS protein family, member 1, GeneBank: 8936.
Funding
F.V.F. is grateful for the support of grant CA154887 from the National Institutes of Health, National Cancer Institute. The cell differentiation studies were funded through an NSF Integrative Graduate Education and Research Traineeship Award, an National Science Foundation Science and Technology Center for the Emergent Behavior of Integrated Biological Systems Award, and California Institute for Regenerative Medicine Award. This collaborative endeavor was supported by grants from the University of California Cancer Research Coordinating Committee CRCC CRN-17-427258, University of California Academic Senate Graduate and Research Council and the Health Sciences Research Institute.
Availability data and materials
Not applicable to this article as all data generated is included in this this study.
Authors’contributions
SJS, WT, FVF carried out cell density experiments, FVF conducted metabolomics experiments, SJS quantified metabolite levels and cell proliferation rates, DEG, SJS, FVF carried out flow cytometry analysis and image processing. FVF, KEM conceived and designed the study. FVF, SJS wrote the manuscript. All authors read and approved the final manuscript.
Competing interests
The authors declare that they have no competing interests.
Ethics approval and consent to participate Not applicable.
All experimental protocols were approved by the Institutional Review Board at the University of California Merced. The study was carried out as part of IRB UCM13-0025 of the University of California Merced as part of dbGap ID 5094.
Publisher’s Note
Springer Nature remains neutral with regard to jurisdictional claims in published maps and institutional affiliations.
Author details
1Systems Biology and Cancer Metabolism, Program for Quantitative Systems
95343, USA.2Program for Biological Engineering and Small-scale
Technologies, School of Engineering, University of California Merced, 5200 North Lake Road, Merced, CA 95343, USA.
Received: 26 October 2016 Accepted: 2 May 2017
References
1. Kalka C, Masuda H, Takahashi T, Kalka-Moll WM, Silver M, Kearney M, Li T, Isner JM, Asahara T. Transplantation of ex vivo expanded endothelial progenitor cells for therapeutic neovascularization. Proc Natl Acad Sci U S A. 2000;97:3422–7.
2. Soker S, Machado M, Atala A. Systems for therapeutic angiogenesis in tissue engineering. World J Urol. 2000;18:10–8.
3. Kawamoto A, Gwon HC, Iwaguro H, Yamaguchi JI, Uchida S, Masuda H, Silver M, Ma H, Kearney M, Isner JM, Asahara T. Therapeutic potential of ex vivo expanded endothelial progenitor cells for myocardial ischemia. Circulation. 2001;103:634–7.
4. Kocher AA, Schuster MD, Szabolcs MJ, Takuma S, Burkhoff D, Wang J, Homma S, Edwards NM, Itescu S. Neovascularization of ischemic myocardium by human bone-marrow-derived angioblasts prevents cardiomyocyte apoptosis, reduces remodeling and improves cardiac function. Nat Med. 2001;7:430–6.
5. Kaushal S, Amiel GE, Guleserian KJ, Shapira OM, Perry T, Sutherland FW, Rabkin E, Moran AM, Schoen FJ, Atala A, et al. Functional small-diameter neovessels created using endothelial progenitor cells expanded ex vivo. Nat Med. 2001;7:1035–40.
6. Griese DP, Ehsan A, Melo LG, Kong D, Zhang L, Mann MJ, Pratt RE, Mulligan RC, Dzau VJ. Isolation and transplantation of autologous circulating endothelial cells into denuded vessels and prosthetic grafts: implications for cell-based vascular therapy. Circulation. 2003;108:2710–5.
7. Ping YF, Zhang X, Bian XW. Cancer stem cells and their vascular niche: Do they benefit from each other? Cancer Lett. 2016;380:561–7. 8. Kohler EE, Wary KK, Li F, Chatterjee I, Urao N, Toth PT, Ushio-Fukai M,
Rehman J, Park C, Malik AB. Flk1+ and VE-cadherin + endothelial cells derived from iPSCs recapitulates vascular development during
differentiation and display similar angiogenic potential as ESC-derived cells. PLoS ONE. 2013;8:e85549.
9. Lee D, Park C, Lee H, Lugus JJ, Kim SH, Arentson E, Chung YS, Gomez G, Kyba M, Lin S, et al. ER71 acts downstream of BMP, Notch, and Wnt signaling in blood and vessel progenitor specification. Cell Stem Cell. 2008;2:497–507.
10. Kataoka H, Hayashi M, Nakagawa R, Tanaka Y, Izumi N, Nishikawa S, Jakt ML, Tarui H. Etv2/ER71 induces vascular mesoderm from Flk1 + PDGFRalpha + primitive mesoderm. Blood. 2011;118:6975–86.
11. Teng L, Lei HM, Sun F, An SM, Tang YB, Meng S, Wang CH, Shen Y, Chen HZ, Zhu L. Autocrine glutamatergic transmission for the regulation of embryonal carcinoma stem cells. Oncotarget. 2016;7:49552–64.
12. Yamashita J, Itoh H, Hirashima M, Ogawa M, Nishikawa S, Yurugi T, Naito M, Nakao K. Flk1-positive cells derived from embryonic stem cells serve as vascular progenitors. Nature. 2000;408:92–6.
13. Kattman SJ, Witty AD, Gagliardi M, Dubois NC, Niapour M, Hotta A, Ellis J, Keller G. Stage-specific optimization of activin/nodal and BMP signaling promotes cardiac differentiation of mouse and human pluripotent stem cell lines. Cell Stem Cell. 2011;8:228–40.
14. Glaser DE, Gower RM, Lauer NE, Tam K, Blancas AA, Shih AJ, Simon SI, McCloskey KE. Functional Characterization of Embryonic Stem Cell-Derived Endothelial Cells. J Vasc Res. 2011;48:415–28.
15. McCloskey KE, Lyons I, Rao RR, Stice SL, Nerem RM. Purified and proliferating endothelial cells derived and expanded in vitro from embryonic stem cells. Endothelium. 2003;10:329–36.
16. McCloskey KE, Smith DA, Jo H, Nerem RM. Embryonic Stem Cell-Derived Endothelial Cells May Lack Complete Functional Maturation in vitro. J Vasc Res. 2006;43:411–21.
17. Blancas A, Shih, AJ, Lauer, NE, McCloskey KE. Endothelial Cells from Embryonic Stem Cells in a Chemically Defined Medium. Stem Cells Dev. 2011;20:2153–61.
18. Nishikawa SI, Nishikawa S, Hirashima M, Matsuyoshi N, Kodama H. Progressive lineage analysis by cell sorting and culture identifies FLK1 + VE-cadherin + cells at a diverging point of endothelial and hemopoietic lineages. Development. 1998;125:1747–57.
19. Sasaki M, Knobbe CB, Munger JC, Lind EF, Brenner D, Brustle A, Harris IS, Holmes R, Wakeham A, Haight J, et al. IDH1(R132H) mutation increases murine haematopoietic progenitors and alters epigenetics. Nature. 2012;488:656–9.
20. Marsboom G, Zhang GF, Pohl-Avila N, Zhang Y, Yuan Y, Kang H, Hao B, Brunengraber H, Malik AB, Rehman J. Glutamine Metabolism Regulates the Pluripotency Transcription Factor OCT4. Cell Rep. 2016;16:323–32. 21. Harjes U, Verfaillie C, Carmeliet P. Endothelial Barrier and Metabolism:
New Kids on the Block Regulating Bone Marrow Vascular Niches. Dev Cell. 2016;37:210–2.
22. Glaser DE, Burns AB, Hatano R, Medrzycki M, Fan Y, McCloskey KE. Specialized mouse embryonic stem cells for studying vascular development. Stem Cells Cloning. 2014;7:79–88.
23. Wu Z, Wei D, Gao W, Xu Y, Hu Z, Ma Z, Gao C, Zhu X, Li Q. TPO-Induced Metabolic Reprogramming Drives Liver Metastasis of Colorectal Cancer CD110+ Tumor-Initiating Cells. Cell Stem Cell. 2015;17:47–59. 24. Blancas AA, Lauer NE, McCloskey KE. Endothelial differentiation of
embryonic stem cells. Curr Protoc Stem Cell Biol. 2008;Chapter 1:Unit 1F 5. 25. McCloskey KE, Stice SL, Nerem RM. In vitro derivation and expansion of
endothelial cells from embryonic stem cells. Methods Mol Biol. 2006;330: 287–301.
26. Hamilton LK, Dufresne M, Joppe SE, Petryszyn S, Aumont A, Calon F, Barnabe-Heider F, Furtos A, Parent M, Chaurand P, Fernandes KJ. Aberrant Lipid Metabolism in the Forebrain Niche Suppresses Adult Neural Stem Cell Proliferation in an Animal Model of Alzheimer’s Disease. Cell Stem Cell. 2015;17:397–411.
27. Zhang J, Ratanasirintrawoot S, Chandrasekaran S, Wu Z, Ficarro SB, Yu C, Ross CA, Cacchiarelli D, Xia Q, Seligson M, et al. LIN28 Regulates Stem Cell Metabolism and Conversion to Primed Pluripotency. Cell Stem Cell. 2016;19:66–80.
28. Drehmer DL, de Aguiar AM, Brandt AP, Petiz L, Cadena SM, Rebelatto CK, Brofman PR, Filipak Neto F, Dallagiovanna B, Abud AP. Metabolic switches during the first steps of adipogenic stem cells differentiation. Stem Cell Res. 2016;17:413–21.
29. Marcelo KL, Goldie LC, Hirschi KK. Regulation of endothelial cell differentiation and specification. Circ Res. 2013;112:1272–87.
30. Rosenberg SA, Niglio SA, Salehomoum N, Chan JL, Jeong BS, Wen Y, Li J, Fukui J, Chen S, Shin SS, Goydos JS. Targeting Glutamatergic Signaling and the PI3 Kinase Pathway to Halt Melanoma Progression. Transl Oncol. 2015;8:1–9. 31. Suzuki Y, Montagne K, Nishihara A, Watabe T, Miyazono K. BMPs promote
proliferation and migration of endothelial cells via stimulation of VEGF-A/VEGFR2 and angiopoietin-1/Tie2 signalling. J Biochem. 2008;143:199–206. 32. Ezaka K, Kanda M, Sugimoto H, Shimizu D, Oya H, Nomoto S, Sueoka S,
Tanaka Y, Takami H, Hashimoto R, et al. Reduced Expression of Adherens Junctions Associated Protein 1 Predicts Recurrence of Hepatocellular Carcinoma After Curative Hepatectomy. Ann Surg Oncol. 2015;22 Suppl 3: 1499–507.
33. Wijelath ES, Murray J, Rahman S, Patel Y, Ishida A, Strand K, Aziz S, Cardona C, Hammond WP, Savidge GF, et al. Novel vascular endothelial growth factor binding domains of fibronectin enhance vascular endothelial growth factor biological activity. Circ Res. 2002;91:25–31.
34. Hojfeldt JW, Helin K. Regional tumour glutamine supply affects chromatin and cell identity. Nat Cell Biol. 2016;18:1027–9.
35. Mooren OL, Kim J, Li J, Cooper JA. Role of N-WASP in Endothelial Monolayer Formation and Integrity. J Biol Chem. 2015;290:18796–805. 36. Vittet D, Buchou T, Schweitzer A, Dejana E, Huber P. Targeted null-mutation in
the vascular endothelial-cadherin gene impairs the organization of vascular-like structures in embryoid bodies. Proc Natl Acad Sci U S A. 1997;94:6273–8. 37. Lenard A, Ellertsdottir E, Herwig L, Krudewig A, Sauteur L, Belting HG,
Affolter M. In vivo analysis reveals a highly stereotypic morphogenetic pathway of vascular anastomosis. Dev Cell. 2013;25:492–506.
38. Rasmussen TL, Kweon J, Diekmann MA, Belema-Bedada F, Song Q, Bowlin K, Shi X, Ferdous A, Li T, Kyba M, et al. ER71 directs mesodermal fate decisions during embryogenesis. Development. 2011;138:4801–12.
39. Munoz WA, Lee M, Miller RK, Ahmed Z, Ji H, Link TM, Lee GR, Kloc M, Ladbury JE, McCrea PD. Plakophilin-3 catenin associates with the ETV1/ER81 transcription factor to positively modulate gene activity. PLoS ONE. 2014;9:e86784. 40. Liu TX, Becker MW, Jelinek J, Wu WS, Deng M, Mikhalkevich N, Hsu K,
41. Han L, Zhang KL, Zhang JX, Zeng L, Di CH, Fee BE, Rivas M, Bao ZS, Jiang T, Bigner D, et al. AJAP1 is dysregulated at an early stage of gliomagenesis and suppresses invasion through cytoskeleton reorganization. CNS Neurosci Ther. 2014;20:429–37.
42. Stocker AM, Chenn A. Focal reduction of alphaE-catenin causes premature differentiation and reduction of beta-catenin signaling during cortical development. Dev Biol. 2009;328:66–77.
43. Giusti B, Margheri F, Rossi L, Lapini I, Magi A, Serrati S, Chilla A, Laurenzana A, Magnelli L, Calorini L, et al. Desmoglein-2-integrin Beta-8 interaction regulates actin assembly in endothelial cells: deregulation in systemic sclerosis. PLoS ONE. 2013;8:e68117.
44. Ryu JM, Lee SH, Seong JK, Han HJ. Glutamine contributes to maintenance of mouse embryonic stem cell self-renewal through PKC-dependent downregulation of HDAC1 and DNMT1/3a. Cell Cycle. 2015;14:3292–305. 45. Wolf A, Krause-Gruszczynska M, Birkenmeier O, Ostareck-Lederer A,
Huttelmaier S, Hatzfeld M. Plakophilin 1 stimulates translation by promoting eIF4A1 activity. J Cell Biol. 2010;188:463–71.
46. Yang C, Fischer-Keso R, Schlechter T, Strobel P, Marx A, Hofmann I. Plakophilin 1-deficient cells upregulate SPOCK1: implications for prostate cancer progression. Tumour Biol. 2015;36:9567–77.
47. Sobolik-Delmaire T, Reddy R, Pashaj A, Roberts BJ, Wahl 3rd JK. Plakophilin-1 localizes to the nucleus and interacts with single-stranded DNA. J Invest Dermatol. 2010;130:2638–46.
48. Mertens C, Hofmann I, Wang Z, Teichmann M, Sepehri Chong S, Schnolzer M, Franke WW. Nuclear particles containing RNA polymerase III complexes associated with the junctional plaque protein plakophilin 2. Proc Natl Acad Sci U S A. 2001;98:7795–800.
49. Artavanis-Tsakonas S, Rand MD, Lake RJ. Notch signaling: cell fate control and signal integration in development. Science. 1999;284:770–6.
50. Krebs LT, Xue Y, Norton CR, Shutter JR, Maguire M, Sundberg JP, Gallahan D, Closson V, Kitajewski J, Callahan R, et al. Notch signaling is essential for vascular morphogenesis in mice. Genes Dev. 2000;14:1343–52.
51. Lardelli M, Lendahl U. Motch A and motch B–two mouse Notch homologues coexpressed in a wide variety of tissues. Exp Cell Res. 1993;204:364–72. 52. Granata A, Bernard WG, Zhao N, McCafferty J, Lilly B, Sinha S. Temporal and
embryonic lineage-dependent regulation of human vascular SMC development by NOTCH3. Stem Cells Dev. 2015;24:846–56.
53. Rusanescu G, Mao J. Notch3 is necessary for neuronal differentiation and maturation in the adult spinal cord. J Cell Mol Med. 2014;18:2103–16. 54. Angulo-Rojo C, Manning-Cela R, Aguirre A, Ortega A, Lopez-Bayghen E.
Involvement of the Notch pathway in terminal astrocytic differentiation: role of PKA. ASN Neuro. 2013;5:e00130.
55. Kahlert UD, Cheng M, Koch K, Marchionni L, Fan X, Raabe EH, Maciaczyk J, Glunde K, Eberhart CG. Alterations in cellular metabolome after pharmacological inhibition of Notch in glioblastoma cells. Int J Cancer. 2016;138:1246–55.
56. Dolfi SC, Chan LL, Qiu J, Tedeschi PM, Bertino JR, Hirshfield KM, Oltvai ZN, Vazquez A. The metabolic demands of cancer cells are coupled to their size and protein synthesis rates. Cancer Metab. 2013;1:20.
57. Wang Y, Huang Y, Zhao L, Li Y, Zheng J. Glutaminase 1 is essential for the differentiation, proliferation, and survival of human neural progenitor cells. Stem Cells Dev. 2014;23:2782–90.
• We accept pre-submission inquiries
• Our selector tool helps you to find the most relevant journal
• We provide round the clock customer support
• Convenient online submission
• Thorough peer review
• Inclusion in PubMed and all major indexing services
• Maximum visibility for your research
Submit your manuscript at www.biomedcentral.com/submit