S O F T W A R E
Open Access
IVSPlat 1.0: an integrated virtual screening
platform with a molecular graphical interface
Yin Xue Sun
1,2, Yan Xin Huang
1*, Feng Li Li
1,2, Hong Yan Wang
1, Cong Fan
1, Yong Li Bao
1, Lu Guo Sun
1,
Zhi Qiang Ma
2, Jun Kong
2*and Yu Xin Li
1*Abstract
Background:The virtual screening (VS) of lead compounds using molecular docking and pharmacophore detection is now an important tool in drug discovery. VS tasks typically require a combination of several software tools and a molecular graphics system. Thus, the integration of all the requisite tools in a single operating environment could reduce the complexity of running VS experiments. However, only a few freely available integrated software platforms have been developed.
Results:A free open-source platform, IVSPlat 1.0, was developed in this study for the management and
automation of VS tasks. We integrated several VS-related programs into a molecular graphics system to provide a comprehensive platform for the solution of VS tasks based on molecular docking, pharmacophore detection, and a combination of both methods. This tool can be used to visualize intermediate and final results of the VS execution, while also providing a clustering tool for the analysis of VS results. A case study was conducted to demonstrate the applicability of this platform.
Conclusions:IVSPlat 1.0 provides a plug-in-based solution for the management, automation, and visualization of VS tasks. IVSPlat 1.0 is an open framework that allows the integration of extra software to extend its functionality and modified versions can be freely distributed. The open source code and documentation are available at http:// kyc.nenu.edu.cn/IVSPlat/.
Background
The successful application of virtual screening in drug dis-covery means that medicinal chemists and pharmacolo-gists are increasingly using this tool in drug discovery research [1]. Two general strategies are employed in vir-tual screening: (1) structure-based virvir-tual screening (SBVS) methods for screening compound libraries where the three-dimensional (3D) structures of targets are avail-able; and (2) ligand-based virtual screening (LBVS) meth-ods for identifying potential hits in compound libraries, typically where 3D target structures are unknown [2]. SBVS is dependent on knowledge of the 3D structure of the target. The docking of a compound collection is tested with the target structure and a quantified interaction score
is used to identify candidate lead compounds. Thus, SBVS is not dependent on the existence of known active com-pounds, which increases the prospects for identifying new active lead compounds [3]. Several docking programs have been developed for virtual screening since the initial devel-opment of UCSF Dock [4,5], such as AutoDock [6], GOLD [7], and GLIDE [8,9]. There have been reports of the successful identification of lead compounds using docking-based VS methods [10]. LBVS assumes that struc-turally similar compounds are likely to exhibit similar bio-logical activities. LBVS makes use of the physicochemical, structural, and energetic properties of known active com-pounds when searching large compound libraries for related or novel chemical compounds [11]. The pharma-cophore-based database searching technique is a widely used VS strategy [12], which relies on knowledge of the biological activity of multiple hits when identifying key fea-tures during a search. A pharmacophore is a spatial arrangement of features that allows a compound to inter-act with a target receptor at a specific binding mode. * Correspondence: [email protected]; [email protected];
National Engineering Laboratory for Druggable Gene and Protein Screening, Northeast Normal University, Changchun 130024, P.R. China
2
School of Computer Science and Information Technology, Northeast Normal University, Changchun 130117, P.R. China
Full list of author information is available at the end of the article
Thus, a pharmacophore can serve as a powerful model with versatile applications in rational drug design, such as virtual screening, de novo design, lead optimization, and ADME/Tox studies. Several algorithms and software tools have been developed for pharmacophore detection [13-19]. In practice, SBVS and LBVS can be used in com-bination or separately, depending on the specific aim. However, very few open-source platforms have integrated both approaches for virtual screening [20].
In this study, we developed an integrated virtual screening platform, IVSPlat 1.0, which is an easily oper-ated PyMOL [21] plug-in that performs many practical virtual screening tasks derived from UCSF Dock 6.5 [22] and PharmaGist [18], while also providing the facility to analyze results. Molecular visualization can be used to highlight connectivity and important structural features in interacting molecules, which is crucial for drug design.
IVSPlat 1.0 was developed to exploit PyMOL’s
excep-tional molecular viewing capabilities, which are seam-lessly integrated with other programs. Thus, IVSPlat 1.0 facilitates molecular docking and pharmacophore studies, which can be visualized in a PyMOL window. Further-more, IVSPlat 1.0 is an open source framework, thereby allowing developers to add other new open source com-putational applications using a uniform graphical user interface (GUI). IVSPlat 1.0 was written in Python and its installation instructions and video demonstrations can be found on the IVSPlat website.
Implementation Related technologies
IVSPlat 1.0 integrates the programs detailed in the fol-lowing sections and it also provides a uniform interface for accessing these programs, which facilitates transpar-ency for the user. Auxiliary software can also be incorpo-rate provided that they are preinstalled, such as Openbabel [23], DMS [24], Sphgen [6], and MPICH2 [25].
PyMol
PyMol is one of the most popular molecular visualization programs. The core of the program is a full-featured Python [26] interpreter, which is extended by an OpenGL 3D display, a Tcl/Tk based GUI, and a PyMol API that facilitates plug-in creation. Several popular plug-in exten-sions have been developed in the field of molecular inter-actions. The APBS plug-in [27] provides an interface for the popular adaptive Poisson-Boltzmann solver (APBS) program, thereby giving easy access to electrostatics calcu-lations, and visualization of potential energy surfaces and charge densities on protein surfaces. PyDeT [28] is a PyMOL plug-in for visualizing tessellations derived from the protein structure and the source protein. PyETV [29]
is a PyMOL plug-in used for viewing, analyzing, and manipulating the prediction of evolutionarily important residues and sites in protein structures and their com-plexes. The Autodock/Vina plug-in [30] provides an inter-face between PyMOL and two popular docking programs, Autodock and Autodock Vina [31], thereby facilitating molecular docking, virtual screening, and binding site ana-lysis via PyMOL.
UCSF Dock 6.5
UCSF Dock is one of the most frequently used molecu-lar docking applications in VS studies [2]. The latest version of UCSF Dock is version 6.5 (UCSF Dock 6.5). The following new features have been added to UCSF Dock 6.5: 1) an anchor can be selected by specifying an atom in a fragment and the number of anchors used can be limited during multi-anchor docking; 2) the new scoring function (descriptor score) has been introduced, which includes a hydrogen bond term and footprint similarity scoring; and 3) PB/SA score has been general-ized to some extent and efficiency improvements have been included that make docking, rather than rescoring, more tractable for nontrivial systems [22]. However, no GUI tool is currently available for automating VS tasks using UCSF Docks.
PharmaGist
IVSPlat 1.0 uses the freely available program Pharma-Gist [18] for LBVS. PharmaPharma-Gist is a virtual screening method that is based on pharmacophore detection. Its workflow is as follows: 1) specify a set of active com-pounds; 2) generate candidate pharmacophores that are solved using an algorithm via multiple flexible alignment of the active compounds; and 3) perform pharmaco-phore-based virtual screening. PharmaGist is highly effi-cient and a typical run of up to 32 active compounds takes from seconds to a few minutes using a standard PC [18].
PaDEL-Descriptor
Hcluster
Hcluster [34] is a hierarchical clustering library devel-oped in the Python language with the Scipy package [35]. This library provides Python functions for agglom-erative clustering, including the generation of hierarchi-cal clusters from distance matrices, computation of distance matrices from observation vectors, calculation of cluster statistics, linkage cutting to generate flat clus-ters, and cluster visualization with dendrograms. Hclus-ter also provides algorithms for clusHclus-tering, including, linkage, single, complete, average, median, and Ward’s method. Ward’s method is the most adaptive for mole-cular clustering [36], so it was used as the default in our platform. However, users can still select their own pre-ferred method. Hcluster outputs a dendrogram to illus-trate the cluster results.
Architecture of IVSPlat 1.0
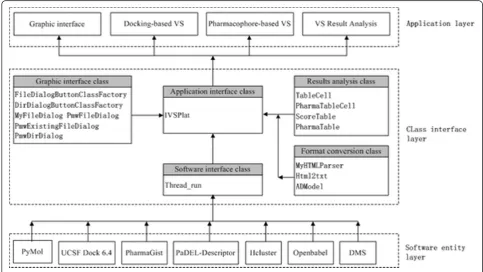
Figure 1 shows that the architecture of the platform consists of three layers: application layer, class interface layer, and software entity layer. The class interface layer includes a class library written in Python that constitu-tes the core of the platform. Several software programs are integrated with the molecular graphics system in the software entity layer, while various virtual screening ser-vices are provided in the application layer. Python is an interactive, object-oriented, extensible programming lan-guage with strong support for integration with other
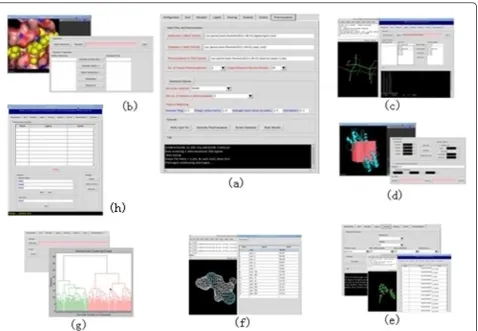
languages, so it was selected as the main programming tool to produce a uniform software environment for the simultaneous application of various scientific programs. The class library in the class interface layer has four components: GUI class, software interface class, results analysis class, and format reading class. The software interface class is the core, which consists of the Threa-d_run and IVSPlat classes. IVSPlat class is the main class for calling other classes in all the methods used in the application layer, including the thread distribution, conversion of file formats between the integrated pro-grams, database operation, and the analysis of the VS results. The application layer is composed of a GUI and three functional modules. The GUI provides functions for visualizing the binding geometries and interactions between ligands (compounds) and receptors using PyMOL, while the three functional modules allow dock-ing-based VS, pharmacophore-based VS, and VS results analysis. The platform is launched by running PyMOL and it allows the user to specify the runtime parameters. The main platform screen is shown in Figure 2(a), which includes nine functional items: configuration, grid, receptor, ligand, docking, analysis, pharmacophore, cluster, and database management.
Molecular docking-based virtual screening
A molecular docking-based virtual screening task can be conducted starting with a target protein and a large,
diverse compound library. The main steps are described in the following sections.
Running environment configuration
This module defines the location and the environment variables required for the execution of each program. To facilitate system maintenance and reconfiguration, all the correctly configured options can be saved to a text file, which can be manually modified as required.
Receptor and ligand preparation
Receptor preparation in UCSF Dock 6.5 includes a series of tasks, including, adding hydrogen atoms and charges, protonating amines, deleting solvent molecules [37], and localizing the receptor binding sites. These tasks are fre-quently accomplished by manual operation and inspec-tion. In particular, the localization of binding site(s) is composed of three related operations: 1) generating the molecular surface of the receptor using the DMS pro-gram; 2) generating spheres surrounding the receptor
using the Sphgen program; and 3) selecting a subset of spheres to represent the binding site(s) using the Spher-e_selector program. In IVSPlat 1.0, the receptor func-tional module provides a workbench with an interactive GUI that automates the process of binding site prepara-tion. Users are not required to consider the inputs and outputs of all the intermediate processes. The resulting binding site(s) can also be visualized and analyzed in a PyMOL window (Figure 2(b)).
During the preparation of ligands (compounds), UCSF Dock 6.5 and PharmaGist have to add charges and hydrogen atoms to ligands in a MOL2 format. It is recommended that all ligand structures used in VS experiments are obtained from the ZINC database [38]. ZINC is the most popular free database for virtual screening and it contains compounds that are commer-cially available. Moreover, the charges and hydrogen atoms have already been added to each compound in the ZINC compound database. Therefore, our platform does not require a functionality for adding charges and
hydrogen atoms. All compounds can be inspected and selected via the PyMOL window in the ligand functional module, before a compound database for virtual screen-ing is set up (Figure 2(c)). This module also converts other formats to MOL2 during ligand preparation by calling the Openbabel program.
Grid generation
UCSF Dock 6.5 requires a rectangular box to generate a grid file and the grid functional module provides a gra-phical environment for defining the centre of the box, adjusting the box size and position, and generating the final box file. PyMOL defined the box centre by selecting explicit coordinates or by specifying a PyMOL selection (e.g., a reference ligand) to calculate the mean coordi-nates of the atoms. The docking box can be displayed in the PyMOL window while the size and the exact position
of the box can be adjusted depending on the user’s
requirements (Figure 2(d)).
Docking
Depending on a user’s computer configuration, UCSF
Dock 6.5 can be installed in several different running modes, including, GNU, GNU parallel, and GNU parallel pbsa [22]. UCSF Dock 6.5 also has a wealth of parameters for tailoring a particular VS service, including a choice of multiple scoring functions. UCSF Dock 6.5 typically runs from the command line in a standard Unix shell and it reads an input parameter file containing all the field/value options. We created a standard input file known as dock. in and a control panel is provided so users can conveni-ently adjust the running parameters in a file (Figure 2(e)). During docking experiments, the grid box size must be set high enough to allow all poses of the ligands to lie within the box, although excessively large grid boxes will waste computational resources. Thus, we placed an option in the control panel to facilitate trial and error, i.e., max_orienta-tions. The primary score parameter option in the control panel helps users to select an appropriate scoring function. Furthermore, the parallel version of UCSF Dock 6.5 with a PB/SA scoring function can be employed if users install the OpenEye Toolkits [39], which are freely available to most academic and government institutions.
Analysis of results
A series of output files are created after the docking task is complete, including an anchor_and_grow_ranked.mol2 file containing the top scored ligands sorted using a score function value. Users can list all the data in the anchor_-and_grow_ranked.mol2 file as a table in the analysis functional module, followed by loading the data in a Pymol window to visualize and inspect ligand poses. In general, the number of hits in a virtual screening task far exceeds the number of compounds that can be
biologically tested, so a molecular clustering procedure is required to reduce the number of hits to a subset of com-pounds that best represents the overall result set. In IVS-Plat 1.0, the Hcluster Python library and the PaDEL-Descriptor program are used to produce a molecular clustering module. The PaDEL-Descriptor program is used to calculate the molecular descriptors and finger-prints, while the Hcluster library is used to perform clus-tering tasks based on the descriptors and fingerprints. The clustering results are displayed in a hierarchical den-drogram (Figure 2(g)), which can be saved as a text file.
Pharmacophore-based virtual screening
IVSPlat 1.0 provides a pharmacophore-based virtual screening module via PharmaGist. The module is simple and easy to use, and users are only required to upload a ligand file and a compound database file as input, before setting an optional running parameter, such as the scor-ing weight of each feature. The module has two main components: generating pharmacophores and screening the compound database with the resulting pharmaco-phore. The method is similar to that used in molecular docking-based virtual screening. The pharmacophores can be loaded and analyzed in a PyMOL window before selecting the appropriate public pharmacophore (Figure 2(f)). An output such as *mol2_dbres.html (* means any string) is created after the VS task is complete, which
contains each output compound’s score and structure
information. The screening results can be summarized as a table in score order and these data can be visualized in a PyMOL window (Figure 2(f)).
Combined virtual screening
Different VS approaches are characterized by their screening strategies, i.e., SBVS or LBVS, which can be used independently or in combination. Combined virtual screening is regarded as a novel VS protocol that effi-ciently increases hit rates during virtual screening, while reducing the computational costs [40-42]. IVSPlat 1.0 provides an environment for combined virtual screening using pharmacophore-based VS and molecular docking-based VS. Pharmacophore-docking-based VS can be used as pre-filter during the virtual screening of a huge database, before performing molecular docking-based VS only with the top results obtained during the first step [40]. Pharmacophore-based VS and molecular docking-based VS can also be used in parallel to improve the enrich-ment factor (EF). An example is presented in the next section to demonstrate the applicability of this platform.
Database management
methods were developed to overcome compatibility issues in input/output files of the integrated software tools. A Python interface to SQLite (a lightweight SQL database) was developed, which is mainly used by IVS-Plat 1.0 for the data management of VS output results (Figure 2(h)). This provides a base for further extension.
Application of the platform - a case study Experimental dataset
The experimental dataset was taken from the DUD data-base [43,44], which was designed for testing docking algorithms by providing challenging decoys. DUD con-tains 2950 active compounds with 40 targets. We used thrombin (PDB id: 1H8D, H chain) as the target protein in our experiments. Thrombin is a trypsin-like serine protease with a central role in thrombosis and haemosta-sis and its inhibitors are potentially pharmacologically important antithrombotics [45]. The X-ray crystal struc-tures of thrombin are known and strucstruc-tures of many small molecule inhibitors complexed with thrombin have been identified [43-45]. We also used 72 compounds that are active against thrombin and we randomly selected 1000 compounds as decoys. We tested the applicability of the platform by conducting virtual screening of throm-bin inhibitors using several screening strategies.
Screening for thrombin inhibitors using molecular docking-based VS
The target protein (thrombin, PDB id: 1H8D) was pre-pared using UCSF Chimera [38] by the following two steps: 1) remove L chain, I chain (inhibitor), and water molecules from the crystal structure of thrombin; and 2) add all hydrogen atoms and all the Gasteiger atom charges. The residues within 10.0 Å of the bound ligand were defined as the active site. To reduce the collision probability, the parameter min_anchor_size was set to 5. The pruning_conformer_score_cutoff was set at 100, the max_orientations was set at 1000, the maximum num-ber of orientations to be scored was set at 1000, and the grid box size was set at 10. We treated all compounds
as flexible using DOCK’s anchor-and-grow algorithm
while the grid energy scoring method was used to evalu-ate compounds. UCSF Dock 6.5 in parallel mode was used for the screening task (using a Dell precision T7400 workstation with two processors: Intel Xeon E5430 quad core). The total running time was c. 2 h. The results were analyzed in terms of EF. EF is a com-mon metric used for comparing virtual screening results, which is defined as follows:
EF=
HITSsampled Nsampled HITStotal
Ntotal
(1)
whereNtotalis the number of compounds in the
data-base,HITStotalis the total number of known active
com-pounds, Nsampled is the number of top compounds to be
sampled, andHITSsampledis the number of known active
compounds found in theNsampledcompounds.
Molecular docking-based VS provided good perfor-mance in the experiments. Figure 3 shows that the max-imum EF was 14 with the top 1% of the database (Figure 3(a)), while the frequency of thrombin-active compounds in the top 1% of the total library was c. 15% (Figure 3(b)). The frequency of active compounds that were screened gradually increased as we increased the percentage of the database that was sampled. In con-trast, the EFs gradually decreased and c. 90% of the active compounds was successfully screened from the top 50% of the database (Figure 3(b)).
Screening thrombin inhibitors using pharmacophore-based VS
and number of the compounds selected were key factors in the pharmacophore-based VS.
Combination of the two VS protocols
Pharmacophore-based VS is suitable when a set of known active compounds is available. The strength of the pharmacophore-based VS is its high speed.
However, docking-based VS is more appropriate when the structure of a protein target is known. Compared with pharmacophore-based VS, docking-based VS is more suitable for searching for active compounds with novel scaffolds, although its running speed is generally slow. A combination of both VS protocols may provide a superior alternative to the single VS protocol when
Figure 3EF of docking-based VS and the corresponding percentage of active compounds. EF of docking-based VS. (b) The corresponding percentage of active compounds.
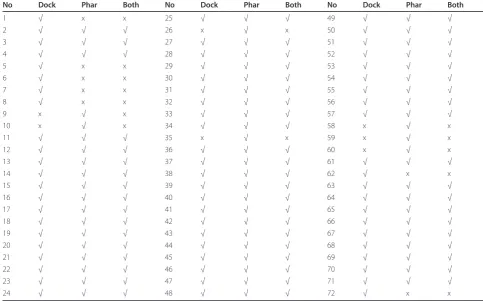
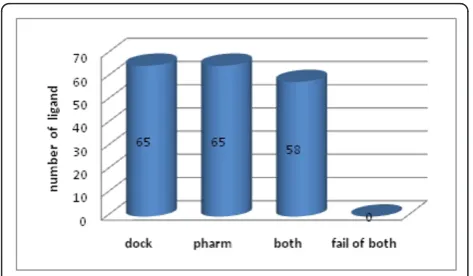
the structure of the target protein and a set of known active compounds are available. Table 1 shows the results obtained with a combination of both protocols with the fourth dataset. Figure 5 shows that 65 active compounds were successfully screened using pharmaco-phore- and docking- based VS. We found that 58 com-pounds were screened with combination of both, whereas 14 of the 72 active compounds were screened when using only one of the two protocols. Screening results for the remaining seven datasets are shown in Supplementary Tables S1-S7 and Figures S2-S8 (see Additional file 1). In summary, pharmacophore- and docking- based VS identified some common active com-pounds, but they also identified different individual active compounds, indicating the complementary effects of each method. Thus, a combination of both VS proto-cols is feasible.
Pharmacophore-based methods can be used as a pre-filter during the screening of large databases to reduce data input with docking-based VS. Alternatively, the two methods can be used in parallel to improve the hit rate with VS.
Conclusions
IVSPlat 1.0 is a plug-in based software platform for the management of VS tasks and the analysis of VS results, which integrates pharmacophore-based VS, docking-based VS, a molecular graphics system, and the analy-sis of results in a single, user-friendly workbench. IVS-Plat 1.0 is an open framework which provides the potential for further development. Work is ongoing to improve the platform and allows researchers to per-form QSAR model-based VS, ADMET-based virtual screening, and knowledge-based virtual screening. Researchers can also use more auxiliary programs for workbench construction and results analysis. Another major feature of this project will be the development of online updates. The platform will be updated on the IVSPlat web page.
Availability and requirements Project name:IVSPlat 1.0
Project home page:http://kyc.nenu.edu.cn/IVSPlat/ Operating system(s):Linux (Fedora 14)
Programming language:Python
Table 1 Screening results with the fourth dataset for the top 50% of the database using dock- and pharmacophore-based VS, and a combination of both
No Dock Phar Both No Dock Phar Both No Dock Phar Both
1 √ x x 25 √ √ √ 49 √ √ √
2 √ √ √ 26 x √ x 50 √ √ √
3 √ √ √ 27 √ √ √ 51 √ √ √
4 √ √ √ 28 √ √ √ 52 √ √ √
5 √ x x 29 √ √ √ 53 √ √ √
6 √ x x 30 √ √ √ 54 √ √ √
7 √ x x 31 √ √ √ 55 √ √ √
8 √ x x 32 √ √ √ 56 √ √ √
9 x √ x 33 √ √ √ 57 √ √ √
10 x √ x 34 √ √ √ 58 x √ x
11 √ √ √ 35 x √ x 59 x √ x
12 √ √ √ 36 √ √ √ 60 x √ x
13 √ √ √ 37 √ √ √ 61 √ √ √
14 √ √ √ 38 √ √ √ 62 √ x x
15 √ √ √ 39 √ √ √ 63 √ √ √
16 √ √ √ 40 √ √ √ 64 √ √ √
17 √ √ √ 41 √ √ √ 65 √ √ √
18 √ √ √ 42 √ √ √ 66 √ √ √
19 √ √ √ 43 √ √ √ 67 √ √ √
20 √ √ √ 44 √ √ √ 68 √ √ √
21 √ √ √ 45 √ √ √ 69 √ √ √
22 √ √ √ 46 √ √ √ 70 √ √ √
23 √ √ √ 47 √ √ √ 71 √ √ √
24 √ √ √ 48 √ √ √ 72 √ x x
Other requirements: PyMOL (v 1.4.1), Dock 6.5, Pharmagist, PaDEL-Descriptor, Hcluster (v 0.2.0), NumPy (v 1.6), DMS, MPICH2 and Openbabel (v 2.3)
License:GNU GPL
Any restrictions to use by non-academics:Contact authors
Additional material
Additional file 1: Supplementary experimental results. The file contains Supplementary Tables S1 to S7 and Supplementary Figures S1 to S8.
Acknowledgements
This work was supported by the National Natural Science Foundation of China (No. 61172183), National Key New Drug Creation and Manufacturing Program of Ministry of Science and Technology(No. 2011ZX09401-305-03), the Fundamental Research Funds for the Central Universities, the Natural Science Foundation of Jilin Province (No. 20101503), the Grant of Jilin Province Science & Technology Committee, China(Nos. 20102203, 20110938 and 20110711) and the Scientific and Technical Project of Administration of Traditional Chinese Medicine of Jilin Province (Nos. 2010pt067 and 2011-zd16).
Author details
1
National Engineering Laboratory for Druggable Gene and Protein Screening, Northeast Normal University, Changchun 130024, P.R. China.2School of Computer Science and Information Technology, Northeast Normal University, Changchun 130117, P.R. China.
Authors’contributions
YXS and YXH conceived and designed the research. YXS, HYW, FLL and CF performed the research including data collection, test and analysis. LGS and ZQM carefully proofread the manuscript. YLB and JK suggested extension and modifications to the research. YXL supervised the whole research and revised the manuscript critically. All authors have read and approved the final manuscript.
Competing interests
The authors declare that they have no competing interests.
Received: 21 October 2011 Accepted: 5 January 2012 Published: 5 January 2012
References
1. Shoichet BK:Virtual screening of chemical libraries.Nature2004, 432:862-865.
2. Lengauer T, Lemmen C, Rarey M, Zimmermann M:Novel technologies for virtual screening.Drug Discov Today2004,9:27-34.
3. Kitchen DB, Decornez H, Furr JR, Bajorath J:Docking and scoring in virtual screening for drug discovery: methods and applications.Nat Rev Drug Discov2004,3:935-949.
4. Tuccinardi T:Docking-based virtual screening: recent developments.
Comb Chem High Throughput Screen2009,12:303-314.
5. Kuntz ID, Blaney JM, Oatley SJ, Langridge R, Ferrin TE:A geometric approach to macromolecule-ligand interactions.J Mol Biol1982, 161:269-288.
6. Morris GM, Goodsell DS, Halliday DS, Huey R, Hart WE, Belew R, Olson AJ: Automated docking using a Lamarckian genetic algorithm and and empirical binding free energy function.J Comp Chem1998,19:1639-1662. 7. Jones G, Willett P, Glen RC, Leach AR, Taylor R:Development and
validation of a genetic algorithm for flexible docking.J Mol Bio1997, 267:727-748.
8. Friesner RA, Banks JL, Murphy RB, Halgren TA, Klicic JJ, Mainz DT, Repasky MP, Knoll EH, Shelley M, Perry JK, Shaw DE, Francis P, Shenkin PS: Glide: a new approach for rapid, accurate docking and scoring. 1. Method and assessment of docking accuracy.J Med Chem2004, 47:1739-1749.
9. Halgren TA, Murphy RB, Friesner RA, Beard HS, Frye LL, Pollard WT, Banks JL: Glide: a new approach for rapid, accurate docking and scoring. 2. Enrichment factors in database screening.J Med Chem2004, 47:1750-1759.
10. Sousa SF, Cerqueira NM, Fernandes PA, Ramos MJ:Virtual screening in drug design and development.Comb Chem High Throughput Screen2010, 13:442-453.
11. Stahura FL, Bajorath J:New Methodologies for Ligand-Based Virtual Screening.Curr Pharm Des2005,11:1189-1202.
12. Khedkar SA, Malde AK, Coutinho EC, Srivastava S:Pharmacophore modeling in drug discovery and development: an overview.Med Chem
2007,3:187-197.
13. Chen X, Rusinko A, Tropsha A, Young SS:Automated pharmacophore identification for large chemical data sets.J Chem Inf Comput Sci1999, 39:887-896.
14. Feng J, Sanil A, Young SS:PharmID: pharmacophore identification using Gibbs sampling.J Chem Inf Model2006,46:1352-1359.
15. Richmond NJ, Abrams CA, Wolohan PR, Abrahamian E, Willett P, Clark RD: GALAHAD: 1. pharmacophore identification by hypermolecular alignment of ligands in 3D.J Comput Aided Mol Des2006,20:567-587. 16. Zhu F, Agrafiotis DK:Recursive distance partitioning algorithm for
common pharmacophore identification.J Chem Inf Model2007, 47:1619-1625.
17. Schneidman-Duhovny D, Dror O, Inbar Y, Nussinov R, Wolfson HJ: Deterministic pharmacophore detection via multiple flexible alignment of drug-like molecules.J Comput Biol2008,15:737-754.
18. Schneidman-Duhovny D, Dror O, Inbar Y, Nussinov R, Wolfson HJ: PharmaGist: a webserver for ligand-based pharmacophore detection.
Nucleic Acids Res2008,36:W223-228.
19. Podolyan Y, Karypis G:Common pharmacophore identification using frequent clique detection algorithm.J Chem Inf Model2009,49:13-21. 20. Cabrera AC, Gil-Redondo R, Perona A, Gago F, Morreale A:VSDMIP 1.5: an
automated structure- and ligand-based virtual screening platform with a PyMOL graphical user interface.J Comput Aided Mol Des2011,25:813-824. 21. The PyMOL molecular graphics system., Available online: [http://www.
pymol.org] (accessed on 12 October 2011).
22. DOCK 6.5 Users Manual., Available online: [http://dock.compbio.ucsf.edu/ DOCK_6/dock6_manual.htm] (accessed on 12 October 2011).
23. The Openbabel programs., Available online: [http://openbabel.org] (accessed on 12 October 2011).
24. Baker N, Sept D, Joseph S, Holst M, McCammon J:Electrostatics of nanosystems: application to microtubules and the ribosome.Proc Natl Acad Sci USA2001,98:10037-10041.
25. The Mpich2 programs., Available online: [http://www.mcs.anl.gov/ research/projects/mpich2/] (accessed on 12 October 2011).
26. Sanner M:Python: a programming language for software integration and development.J Mol Graphics Mod1999,17:57-61.
27. Apbs plugin for pymol., Available online: [http://sourceforge.net/projects/ pymolapbsplugin/] (accessed on 12 October 2011).
28. Ordog R:PyDeT, a PyMOL plug-in for visualizing geometric concepts around proteins.Bioinformation2008,2:346-347.
29. Lua RC, Lichtarge O:PyETV: a PyMOL evolutionary trace viewer to analyze functional site predictions in protein complexes.Bioinformatics
2010,26:2981-2982.
30. Seeliger D, de Groot BL:Ligand docking and binding site analysis with PyMOL and Autodock/Vina.J Comput Aided Mol Des2010,24:417-422. 31. Trott O, Olson A:AutoDock/Vina: improving the speed and accuracy of
docking with a new scoring function, efficient optimization, and multithreading.J Comput Chem2010,31:455-461.
32. Yap CW:PaDEL-descriptor: an open source software to calculate molecular descriptors and fingerprints.J Comput Chem2011, 32:1466-1474.
33. The Chemistry Development Kit (CDK)., Available online: [http:// sourceforge.net/apps/mediawiki/cdk/index.php?title=Main_Page] (accessed on 12 October 2011).
34. Hcluster package of Scipy., Available online: [http://code.google.com/p/ scipy-cluster/] (accessed on 12 October 2011).
35. The Scipy package., Available online: [http://www.scipy.org] (accessed on 12 October 2011).
36. Bocker A, Schneider G, Teckentrup A:NIPALSTREE: a new hierarchical clustering approach for large compound libraries and its application to virtual screening.J Chem Inf Model2006,46:2220-2229.
37. Pettersen EF, Goddard TD, Huang CC, Couch GS, Greenblatt DM, Meng EC, Ferrin TE:UCSF Chimera–a visualization system for exploratory research and analysis.J Comput Chem2004,25:1605-1612.
38. Irwin JJ, Shoichet BK:ZINC - a free database of commercially available compounds for virtual screening.J Chem Inf Model2005,45:177-182. 39. OpenEye Toolkits., Available online: [http://www.eyesopen.com/] (accessed
on 12 October 2011).
40. Liu X, Xie H, Luo C, Tong L, Wang Y, Peng T, Ding J, Jiang H, Li H: Discovery and SAR of thiazolidine-2,4-dione analogues as insulin-like growth factor-1 receptor (IGF-1R) inhibitors via hierarchical virtual screening.J Med Chem2010,53:2661-2665.
41. Ren JX, Li LL, Zheng RL, Xie HZ, Cao ZX, Feng S, Pan YL, Chen X, Wei YQ, Yang SY:Discovery of novel Pim-1 kinase inhibitors by a hierarchical multistage virtual screening approach based on SVM model, pharmacophore, and molecular docking.J Chem Inf Model2011, 51:1364-1375.
42. Vidovic D, Busby SA, Griffin PR, Schürer SC:A combined ligand- and structure-based virtual screening protocol identifies submicromolar PPARγpartial agonists.Chem Med Chem2011,6:94-103.
43. Huang N, Shoichet BK, Irwin JJ:Benchmarking sets for molecular docking.
J Med Chem2006,49:6789-6801.
44. The DUD database., Available online: [http://dud.docking.org/] (accessed on 12 October 2011).
45. Bovio JA, Smith SM, Gums JG:Dabigatran etexilate: a novel oral thrombin inhibitor for thromboembolic disease.Ann Pharmacother2011, 45:603-614.
doi:10.1186/1752-153X-6-2
Cite this article as:Sunet al.:IVSPlat 1.0: an integrated virtual screening platform with a molecular graphical interface.Chemistry Central Journal
20126:2.
Open access provides opportunities to our colleagues in other parts of the globe, by allowing
anyone to view the content free of charge.
Publish with
Chemistry
Central and every
scientist can read your work free of charge
W. Jeffery Hurst, The Hershey Company.
available free of charge to the entire scientific community peer reviewed and published immediately upon acceptance cited in PubMed and archived on PubMed Central yours you keep the copyright
Submit your manuscript here: