Relationship between Farmers’ Participation in Technology
Development and Dissemination Processes; and Acceptability
of Improved Sugarcane Varieties in Kakamega County
1
Caroline M. Thuo*,
2Justus M. Ombati,
3Agnes O. Nkurumwa
1Kenya Agricultural and Livestock Research Organization, Department of Technology Transfer, PO Box 388-00217,
Limuru, Kenya
2,3Department of Agricultural Education and Extension, Egerton University, PO Box 536-20115, Egerton, Kenya
Improved sugarcane varieties have been developed and promoted in Kenya, to enhance sugarcane productivity. However, their acceptance by farmers is low. This paper investigates this phenomenon in attempt to underpin contributing factors to low acceptance. It examines the relationship between farmers’ participation in technology development and dissemination processes; and acceptability of improved sugarcane varieties in Kakamega County. This study used cross-sectional survey research design. Target population was 137,355 small-scale sugarcane farmers from Kakamega County, from which a sample of 384 farmers was randomly selected. Questionnaires were used to collect data, which was analyzed using descriptive and inferential statistics. The study established limited participation of sugarcane farmers in the development and dissemination of improved sugarcane varieties. Significant relationships were established between farmers’ participation in the development and dissemination of improved sugarcane varieties with their acceptability by farmers. The number of year’s farmers had produced these varieties was found to be a strong indicator of their acceptability by farmers. Research findings indicate need to avail necessary information about the improved varieties to farmers by the extension service providers. Utilization of farmer Participatory Technology Development and Dissemination approaches need to be enhanced in the development and dissemination of improved sugarcane technologies.
Key words: Improved sugarcane varieties, Technology development,Dissemination,Acceptability,Farmers’ participation
INTRODUCTION
Sugarcane is an industrial crop used globally for sugar and bio energy (Zhao and Li, 2015). The large demand for sugar is the primary driver of sugarcane production, which accounts for 80 percent of sugar produced worldwide (Murphy, 2017). Its’ production supports approximately 7.5 percent of the world rural population (Mnisi and Dlamini, 2012). The sugar industry contributes significantly to the Kenya economy. According to Food and Agriculture Organization (2019), the Country produced 4,751,609 tonnes of sugarcane under 67,708 hectares in 2017. The annual sugar production is approximately 600,000 metric tonnes (AFFA, 2016). Sugarcane production is the main economic activity in Western, Nyanza parts of Rift Valley and the Coastal region (AFFA, 2016). Approximately 300,000 farmers are involved in its production and supply over 92 percent of sugarcane processed by the Kenya sugar mills (Lihasi, Onyango and Ochola, 2016).
Despite the benefits associated with the sugar industry in Kenya, the sector is faced with various challenges, which includes high cost of sugar production. Compared to other parts of the world, Kenya has the highest sugar production cost among the sugar producing member countries of the Common Market of Eastern and South Africa (COMESA) trading block. The high cost of production has made the Country’s sugar sector to be globally uncompetitive (Kamau and Snipes, 2013). Low sugarcane productivity at the farm level is another great challenge. Sugarcane yields
*Corresponding author: Caroline M. Thuo, Kenya
Agricultural and Livestock Research Organization, Department of Technology Transfer, PO Box 388-00217, Limuru, Kenya. Email: [email protected] Tel: +254721233167; Co-Authors Email: 2[email protected] Tel: +254722692765
3[email protected] Tel: +254721220363
Research Article
have declined in the past decade with average tonnes cane per hectare (tch) dropping from 74 tch in 2004 to 61 tch in 2014 (Mwanga, Ong’ala and Orwa, 2017). This is against the expected yields of approximately 100 tch (KSB, 2014). These low yields have been attributed to widespread use of older, low quality sugar cane varieties (Abura, Gikunda and Nato, 2013). This is demonstrated by their dominance. According to KSB (2014), the CO 421, CO 945 and CO 617 varieties occupying 39 percent, 23 percent and 17 percent of the total area under sugarcane production in Kenya, respectively. The CO 421, CO 617 and CO 945 varieties has been under production since 1960, 1969 and 1990 respectively (KALRO, 2019). In addition to the above-mentioned limitations, these varieties are prone to diseases particularly smut and ratoon stunting disease; late maturing taking between 20-24 months to mature; and have low sucrose content. Consequently, farmers get low returns from sugarcane production and are not able to sustain their livelihood effectively. In addition, there is insufficient sugar production, which has forced Kenya to import approximately 240,000 metric tonnes of sugar annually to bridge the gap in order to meet domestic consumption of 840,000 metric tonnes (AFFA, 2016). Continued deficit in cane yields is likely to have further negative effect on the operations of sugar mills, and may even lead to closure of a number of them due to insufficiency in supply of the raw material.
According to Barua (2016), one of the key reasons for lower agricultural productivity is lack of usage of yield-enhancing technologies such as improved varieties. This calls for the Kenyan sugar sector to embrace better production technologies available, to overcome these challenges it is experiencing. A total of 21 improved sugarcane varieties have been developed and released for commercial production by the Sugar Research Institute (SRI) through its variety improvement programme since 2002 (KESREF, 2014). These varieties have superior qualities which includes high yielding both in sucrose and tonnage; early maturing and disease resistant e.g smut. Sugarcane farmers are expected to produce these varieties because they have potential to enhance sugarcane productivity, resulting to increased farmers income and Kenyan sugar sector becoming globally competitive (KSB, 2014; Agrochart, 2014). However, their acceptance by farmers is low, accounting for approximately 8 percent of the total distribution of sugarcane varieties under production in Kenya (KSB, 2014). Ndemo (March 28, 2018) has identified low adoption of high yielding sugar cane varieties as one of key factors that have contributed to the low sugarcane productivity in Kenya. There was need therefore, to investigate the underlying factors that hinder acceptance of these improved varieties by farmers in Kenya.
According to Smith and Ulu (2012), low acceptance of new technologies has been a great challenge worldwide. Many improved agricultural technologies have been availed to
farmers but majority of them have failed to accept them. A report by Conroy and Sutherland (2014), indicates that one of the main reasons why resource-poor farmers are slow or unable to take up improved technologies is because of their inappropriateness. Abukhzam and Lee (2010), also adds that farmers may reject technologies because they are not compatible with their values, beliefs, perceived needs and their past experiences. This creates the concern whether low acceptance of the improved sugarcane varieties in Kenya, is due to their inappropriateness or lack of compatibility with the farmers’ needs. Production of improved technologies that are appropriate and compatible with the farmers’ needs is therefore very critical for enhanced technology acceptance. This makes it necessary to evaluate the processes used to produce and disseminate these improved technologies.
Various approaches are used in agricultural technology development and dissemination. Conventional approach is one of the commonly used approaches. It involves researchers and technical specialist to identify constraints, possible solutions, and transfer the findings to farmers through extension staffs. Standardized package of practices developed by scientists are the end product of this approach (Pedzisa et al., 2010). Participatory technology development (PTD) is another approach that involves farmers in all stages of technology production and dissemination. The goal is to develop appropriate technologies to meet farmers’ needs through continuous interaction between scientists and farmers. The starting point is on what farmers are successfully doing on their farms, which is then improved using scientifically proven technologies. Improved technologies are developed in the path of the old ones, which is key to the success of an innovation due to its compatibility (Deligiannaki et al., 2011). This enables farmers to participate in the development of technologies that meet their perceived needs, values, beliefs, and past experiences thus enhancing its acceptance (Abukhzam et al., 2010). It also provides farmers with adequate knowledge of technology use and detailed technical information, which enhances technology acceptance (Cavane, 2009; Rogers, 2003; Morris et al., 1999).
their appropriateness to farmers. Without knowledge on this, it will continue to be difficult to improve sugarcane production in the country. The study findings may help researchers and extension service providers in the development and dissemination of improved technologies using efficient and effective processes that make them more acceptable by farmers. The findings may also benefit farmers by helping them realize roles they need to play in technology development and dissemination. Addition of value to the existing literature on PTD & D in relation to the acceptance of improved technologies by farmers will also be achieved.
MATERIALS AND METHODS
A cross-sectional survey research design was used. The study was conducted in Kakamega County, Kenya. The County occupies an area of 3,033.8 Km2 and islocated 30
Km North of the equator, within an altitude of 250-2000m above sea level. It borders Bungoma County to the North and North West, Uasin Gishu to the North East and East, Nandi to the South East, Vihiga to the South, Siaya to the South West and Busia to the West.
The study population comprised of 137,355 small scale sugarcane farmers from three sugar zones of Mumias, West Kenya and Butali in Kakamega County. A list of registered farmers from the three zones was used as a sampling frame. A sample size of 384 sugarcane farmers was selected using the table for determining sample size from the Research Advisors (2006). The table consist of population sizes with corresponding sample sizes, with confidence intervals of 95 percent and 99 percent ; margin of error of 5 percent to 1 percent . It is recommended that if the exact population size of the study is not listed, the next highest value of population size may be used from the table. Therefore, since the exact population size of 137,355 was not represented in the table, a population size of 250,000 was used as the next highest value. With a specific margin of error of 5 percent and 95 percent confidence interval, a sample size of 384 farmers was used. Proportional sampling was used to determine the number of farmers to be selected from each sugar zone. Then for each zone, random sampling was done using a table of random numbers to select number of farmers to the sample.
Valid and reliable farmers’ questionnaire was used to collect data from small-scale sugarcane farmers’ and had four sections. Section (i) was designed to collect data on the farmer characteristics. Data collected included age, gender, level of education, income sources and size of land. Information about the sugarcane varieties under production by farmers was collected in section (ii). Among the data collected in this section included types of sugarcane varieties under production in Kakamega County, size of land under the varieties and number of years’ farmer had produced these varieties. Section (iii)
collected information on farmers’ participation in the development of the improved sugarcane varieties. Data on the research activities farmers were involved in and the roles played during the development of improved sugarcane varieties was collected. Section (iv) collected information on technology dissemination. Data on availability of extension services among farmers; various extension approaches farmers have participated in and their roles during the promotion of improved sugarcane varieties was collected.
The researcher obtained a research permit from the National Commission for Science, Technology and Innovation (NACOSTI) to authorize the study. This was followed by recruitment of two enumerators, to assist the researcher in data collection. The farmers’ questionnaire was researcher administered questionnaire, written in English but was administered to farmers’ orally in Kiswahili (local national language) as the researcher recorded the responses in English. Therefore, the two enumerators were trained by the researcher to understand the items in the questionnaire properly as a guide for proper oral translation into Kiswahili language during data collection. This was done in order to control the quality of data collected. A preliminary survey was carried out to identify the sugar stakeholders whom to work out logistics for a comprehensive data collection in the targeted area. Field supervisors from Mumias, West Kenya and Butali Sugar Companies assisted in locating the sugarcane farmers to be included in the study sample. Then the researcher embarked on data collection with assistance from the two trained enumerators.
acceptance); 2.1-3.0 acres (acceptance); 3.1-4.0 acres (high acceptance); and Over 4.1 acres (very high acceptance) were used. For the acceptability levels based on the number of years the varieties were under production, rating scales of 0.1-2.0 years (very low acceptance); 2.1-4.0 years (low acceptance); 4.1-6.0 years (acceptance); 6.1-8.0 years (high acceptance); and Over 8.1 years (very high acceptance) were used. Cross tabulations were done to establish the relationship between the variables. For the hypotheses seeking relationships, Spearman rank-order correlation coefficient (r) was calculated to show the strength and direction of the linear relationship between the independent and the dependant variables. Hypothesis testing was done using chi-square at 5% level of significance.
Outlined below are descriptions of terms used in the study.
Acceptability: refers to the extent to which sugarcane farmers had engaged in production of improved sugarcane varieties in their farms. It was expressed in terms of size of land under improved sugarcane varieties and number of years a farmer has produced improved sugarcane varieties.
Improved technologies: refers to technological
advancement that improves, even if very slightly, whatever process it applies to. For this study, it referred to the improved sugarcane varieties.
Improved sugarcane varieties: refers to the sugarcane types developed and released for production by the Sugar Research Institute (SRI) since 2002 to 2014 (KESREF, 2014). They include six sugarcane varieties released in 2002 (KEN 82-808, KEN 82-216, KEN 82-219, KEN 83-737, KEN 82- 401, KEN 82-247); four varieties released in 2007 (KEN 82-472, KEN 82-62, D84-84, EAK 73-335); three varieties released in 2011 (KEN 82-601, KEN82-121, KEN82-493 and eight varieties released in 2014 (KEN 98-530, KEN 98-533, KEN 98-551, KEN 00-13, KEN00-3811, KEN00-3548, KEN 98-367 and KEN00-5873).
Participatory technology development process: refers
to efficient farmer driven technology production methodology with high level of decentralization and continuous interaction between scientists and farmers (Pedzisa et al., 2010). In this study, it referred to the research approaches used in the production of improved sugarcane varieties, whereby sugarcane farmers were involved in the development processes.
Participatory technology dissemination processes:
refer to the approaches which involve active participation of farmers in the technology dissemination processes (Pedzisa et al., 2010) which included use of farmer research groups; field demonstrations; and farmer field days.
Small-scale farmers: refer to farmers with small parcel of agricultural land. For this study, it referred to sugarcane farmers with less than 10 acres of land.
RESULTS AND DISCUSSIONS
Characteristics of Sugarcane Farmers in Kakamega County
Research findings indicate that, Kakamega County consists of 88 percent male and 12 percent female small-scale sugarcane farmers. Male farmers greatly outnumbered female farmers because according to the Luhya community growing of sugarcane is associated with men. Figure 1 shows ages of these farmers.
Figure 1. Age of sugarcane farmers in Kakamega County
Source: Research data, 2018
The findings indicate that majority of farmers belonged to the age group of 41-50 years, followed by 51-60 years. The youngest age group was 21-30 years while the oldest was 71-80 years. According to Aldosari et al. (2017), age plays an important role in the dissemination, adoption and diffusion of innovations and are believed to be positively correlated with age. Figure 2 shows the education levels of sugarcane farmers in Kakamega County.
Figure 2. Education levels of sugarcane farmers in Kakamega County
Source: Research data, 2018
main source of income. Only 15 percent had formal employment while 3.9 percent had businesses. Results revealed that majority of sugarcane farmers are small land holders with 35 percent having 0.1 - 2.0 acres; 25 percent had 2.1- 4.0 acres; 17 percent had 4.1-6.0 and 8 percent had 6.1-8.0 acres. Only 15 percent of farmers owned between 8.1 to 10.0 acres. According to Aldosari et al., (2017), size of land holding plays an important role in the adoption of modern agricultural practices among the farming community. More land holdings mean more potential to increase productivity and efficiency to adopt modern technologies.
Figure 3 shows how many years the sugarcane farmers have engaged in their production. Results show that 16 percent of farmers had produced cane for 1 to 5 years; 35 percent 6 to 10 years; 15 percent for 11 to 15 years; 4 percent for 16 to 20 years; 5 percent for 21 to 25 years; 4 percent for 26 to 30 years while 21 percent for over 31 years. According to these results, most farmers have cultivated cane for many years, giving them considerable experience in sugarcane production.
Figure 3. Number of years of sugarcane production among farmers in Kakamega County
Source: Research data, 2018
Participation of Farmers in Technology Development Processes
Participation of farmers in on-farm experimentation and seedcane production were considered in the study as research processes in production of improved sugarcane varieties. Low involvement of farmers in the development of the improved varieties was observed. Findings depict that only 19 percent of the respondents had participated in these research activities. Among these farmers, 10 percent had been involved in seed cane production while 9 percent were involved in on-farm experimentation. According to Pedzisa et al. (2010), low interaction between scientists and farmers in the development of improved technologies, denies farmers an opportunity to identify and seek solutions to the problems they face. As a result, technologies that are not appropriate and not compatible with the farmers needs are produced. Young (2015), Conroy et al. (2014) and Dillon and Morris (1996) add that total involvement of the farmer as the intended user in technology development enables greater acceptance of technologies generated.
Table 1 presents the roles played by farmers in the research activities involving production of the improved varieties.
Table 1: Farmers’ Role in Research Activities
Involving Production of Improved Sugarcane Varieties
Farmers role in research Number Percent (%)
None 311 81.0
Group leader 3 0.8 Farmer Research Group member 18 4.7 Research plot owner 13 3.4 Production of seedcane 39 10.1
Total 384 100.0
Source: Research data, 2018
These roles included farmers being research plot owners; group leaders; farmer research group members; and production of seedcane. Research plot owners were farmers who donated land for use in research work for experimentation, establishment of on-farm demonstrations or for seed cane production. The leaders were in charge of farmer groups. Farmer Research Groups were used for research work and for production of certified seedcane, which was sold to other farmers (KESREF, 2012).
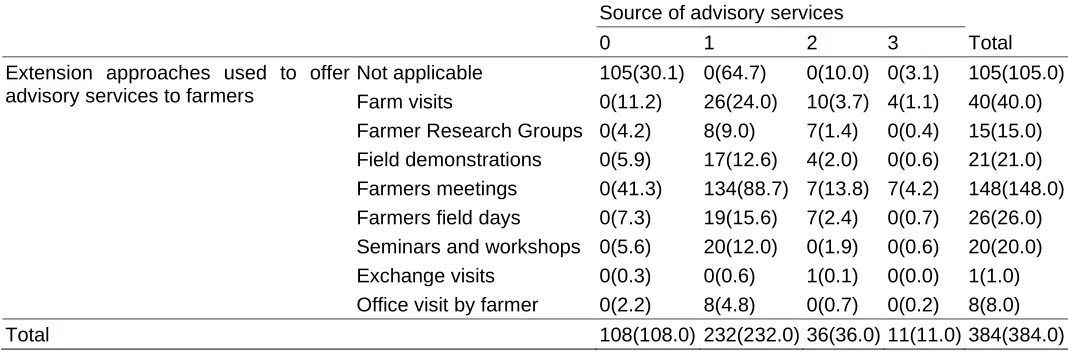
Participation of Farmers in Technology Dissemination Processes
Table 2: Extension Methods used to Advice Farmers and Source of Advisory Services
Source of advisory services
Total
0 1 2 3
Extension approaches used to offer advisory services to farmers
Not applicable 105(30.1) 0(64.7) 0(10.0) 0(3.1) 105(105.0) Farm visits 0(11.2) 26(24.0) 10(3.7) 4(1.1) 40(40.0) Farmer Research Groups 0(4.2) 8(9.0) 7(1.4) 0(0.4) 15(15.0) Field demonstrations 0(5.9) 17(12.6) 4(2.0) 0(0.6) 21(21.0) Farmers meetings 0(41.3) 134(88.7) 7(13.8) 7(4.2) 148(148.0) Farmers field days 0(7.3) 19(15.6) 7(2.4) 0(0.7) 26(26.0) Seminars and workshops 0(5.6) 20(12.0) 0(1.9) 0(0.6) 20(20.0) Exchange visits 0(0.3) 0(0.6) 1(0.1) 0(0.0) 1(1.0) Office visit by farmer 0(2.2) 8(4.8) 0(0.7) 0(0.2) 8(8.0) Total 108(108.0) 232(232.0) 36(36.0) 11(11.0) 384(384.0)
Key 0- None; 1- Sugar Company; 2- Sugar Research Institute; 3-Farmers’ Cooperative Societies
Source: Research data, 2018
Field days, and field demonstrations are farmer participatory approaches and their use was an indicator of farmers’ participation in technology dissemination processes across Kakamega County. These approaches fasten the process of information exchange and adoption (Kaihura, 2001). Through observation, farmers are able to see the performance of an improved technology in the field thus overcoming the problem of uncertainity in technology performance, which enhances acceptance by farmers. Couros et al. (2003), Rogers (2003) and Morris et al.
(1999) indicate that uncertainty about an innovation performance due to its unfamiliarity and newness is a major obstacle in acceptance of improved technology. Uncertainty often results in postponement of the farmers’ decision to adopt a technology until further evidence is gathered.
Roles Played by Farmers in the Promotion of Improved Sugarcane varieties in Kakamega County
The study revealed that 20 percent of the respondents participated in dissemination processes within Kakamega County, which indicated low involvement of farmers in this process. These farmers played various roles as shown in Table 3.
Table 3: Roles Played by Farmers in the Dissemination of Improved Sugarcane Varieties
Farmers roles
Number
Percent (%)
None 308 80.4
Training of other farmers 9 2.3 Hosting of field day 33 8.6 Formation of other farmer research
groups (FRGs) 2 0.4
Establishment of demonstration plots 15 3.9 Selling of improved seedcane 17 4.4
Total 384 100.0
Source: Research data, 2018
Training of other farmers in sugarcane production was done by expert farmers, who had gained expertise in sugarcane production after being trained by other extension agents. In addition, expert farmers had gained a lot of knowledge and experience in the production of improved sugarcane varieties through their participation in the establishment of variety demonstration plots. Hosting of field days was done by sugarcane farmers or farmer research group members, who had established either improved sugarcane variety demonstration plots or seedcane bulking plots for these varieties. Formation of other FRGs was done by expert farmers through guidance of extension personnel to expand existing FRG membership to other farmers. Each FRG was expected to establish improved variety demonstration plots for use in training other farmers and to be used as field day sites. These FRGs were also expected to multiply seedcane from their demonstration farms for sale. In addition, researchers in collaboration with sugar companies and other sugarcane farmers established seedcane multiplication sites to supplement availability of certified seedcane closer to farmers.
Relationship between Farmers’ Participation in
Technology Development Processes and
Acceptability of Improved Sugarcane Varieties
Table 4: Farmers’ Role in the Development of Improved Sugarcane Varieties and Variety Acceptability based on Years of Production Cross Tabulation
Farmers role in the development of improved sugarcane varieties
Total
None 1 2 3 4
Variety acceptability based on years of production
Very low acceptance 28 (16.5) 0 (1.2) 0 (2.1) 0 (1.1) 1 (8.1) 29(29.0) Low acceptance 39(34.1) 2(2.6) 4(4.3) 1(2.3) 15(16.8) 60(60.0) Acceptance 36(36.4) 4(2.7) 2(4.5) 1(2.4) 21(17.9) 64(64.0) High acceptance 15(30.1) 3(2.3) 10(3.8) 5(2.0) 20(14.8) 53(53.0) Very high acceptance 2(2.8) 0(0.2) 0(0.4) 1(0.2) 2(1.4) 5(5.0) Total 120(120.0) 9(9.0) 15(15.0) 8(8.0) 59(59.0) 211(211.0) Chi-square = 39.075; Critical value =26.296; Df = 16;α = 0.05; r=0.323
Key: Figures in the brackets are the expected cell counts
1-Group leader; 2-Farmer research group member; 3-Research plot owners; 4-Seed cane production
Source: Research data, 2018
At 0.05 level of significance and 16 degrees of freedom, the critical value determined from the chi-square table was 26.296 and the calculated chi was 39.075. Since the calculated Chi of 39.075 was more than the critical chi of 26.296, it was concluded that there was a significant relationship between farmers’ role in the development of the improved sugarcane varieties and variety acceptability based on years of production. The null hypothesis was therefore rejected. This meant that farmers’ participation in the development of improved sugarcane varieties is associated with the acceptance of these varieties based on number of years farmers have produced them. Farmers’, who participated in seed cane production portrayed very high acceptance levels, followed by
members of farmer research groups and research plot owners. Gained experience and understanding about these varieties, may have given these farmers confidence to produce them. Majority of farmers who did not play any role in the development of these varieties displayed very low and low acceptance levels.
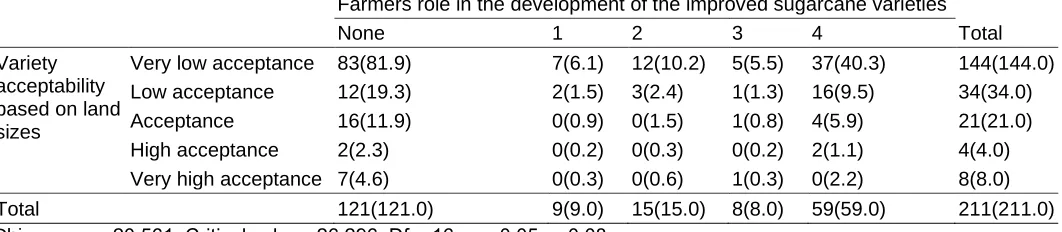
When farmers’ participation in the development of the improved sugarcane varieties and variety acceptability based on land sizes were correlated, a Spearman’s correlation coefficient of 0.08 was obtained. This indicated a very weak linear relationship existed between the two variables. Table 5 shows a crosstabulation between the two variables.
Table 5: A Crosstabulation between Farmers’ Role in the Development of Improved Sugarcane Varieties and Variety Acceptability based on Land under Production
Farmers role in the development of the improved sugarcane varieties Total
None 1 2 3 4
Variety acceptability based on land sizes
Very low acceptance 83(81.9) 7(6.1) 12(10.2) 5(5.5) 37(40.3) 144(144.0) Low acceptance 12(19.3) 2(1.5) 3(2.4) 1(1.3) 16(9.5) 34(34.0) Acceptance 16(11.9) 0(0.9) 0(1.5) 1(0.8) 4(5.9) 21(21.0) High acceptance 2(2.3) 0(0.2) 0(0.3) 0(0.2) 2(1.1) 4(4.0) Very high acceptance 7(4.6) 0(0.3) 0(0.6) 1(0.3) 0(2.2) 8(8.0) Total 121(121.0) 9(9.0) 15(15.0) 8(8.0) 59(59.0) 211(211.0) Chi-square = 20.561; Critical value =26.296; Df = 16; α = 0.05; r=0.08
Key: Figures in the brackets are the expected cell counts
1-Group leader; 2-Farmer research group member; 3-Research plot owners; 4-Production of seed cane.
Source: Research data, 2018
At 0.05 level of significance and 16 degrees of freedom, the critical value determined from the chi-square table was 26.296 and the calculated chi was 20.561. Since the calculated chi of 20.561 was less than the critical chi of 26.296, it was concluded that there was no significant relationship between farmers’ role in the development of improved sugarcane varieties and variety acceptability based on land sizes under their production. The null hypothesis was therefore accepted. Lack of association between the two variables meant that the size of land
Relationship between Farmers’ Participation in
Technology Dissemination Processes and
Acceptability of Improved Sugarcane Varieties
A Spearman correlation coefficient between farmers’ participation in the dissemination of the improved
sugarcane varieties and variety acceptability based on years of production shows a Spearman’s correlation of 0.370. This indicates that a positive and moderate linear relationship exist between the two variables. Table 6 shows a crosstabulation between these variables.
Table 6: A Crosstabulation between Farmers’ Roles in the Dissemination of Improved Sugarcane Varieties and their Acceptability based on Years of Production
Farmers roles in the dissemination of improved sugarcane varieties Total
None 1 2 3 4 5
Variety acceptability based on years of production
Very low acceptance 24(17.6) 3(0.8) 2(4.9) 0(0.3) 0(1.8) 0(3.6) 29(29.0) Low acceptance 39(36.4) 0 (1.7) 16(10.2) 0(6) 2(3.7) 3(7.4) 60(60.0) Acceptance 47(38.8) 2(1.8) 5(10.9) 0(0.6) 3(3.9) 7(7.9) 64(64.0) High Acceptance 16(32.2) 1(1.5) 12(9.0) 2(0.5) 8(3.3) 14(6.5) 53(53.0) Very high acceptance 2(3.0) 0(0.1) 1(0.9) 0(0.0) 0(0.3) 2(0.6) 5(5.0) Total 128(128.0) 6(6.0) 36(36.0) 2(2.0) 13(13) 26(26.0) 211(211.0) Chi-square = 61.251; Critical value =31.410; Df = 20; α = 0.05; r=0.370
Key: Figures in the brackets are expected cell counts
1-Training of other farmers; 2-Hosting of field day; 3- Formation of farmer research groups; 4-Establishment of demonstration plots; 5-Selling of seedcane.
Source: Research data, 2018
At 0.05 level of significance and 20 degrees of freedom, the critical value determined from the chi-square table was 31.410 and the calculated chi was 61.251. Since the calculated chi of 61.251 was more than the critical chi of 31.410, it was concluded that there was a significant relationship between farmers’ roles in the dissemination of improved sugarcane varieties and the acceptability of the improved sugarcane varieties based on years of production. The null hypothesis was therefore rejected. Majority of farmers who participated in the dissemination of improved varieties portrayed high acceptance of these
varieties as noted among farmers, who participated in selling of seedcane, hosting of field days and establishment of demonstration plots.
When farmers’ roles in the dissemination of the improved sugarcane varieties and variety acceptability based on land sizes were correlated, a Spearman’s correlation coefficient of 0.037 was obtained. This indicated that a positive and very weak relationship existed between the two variables. Table 7 shows a crosstabulation between the two variables.
Table 7: A Crosstabulation between Farmers’ Roles in the Dissemination of Improved Sugarcane Varieties and Variety Acceptability based on Land Sizes under their Production
Farmers roles in the dissemination of improved sugarcane varieties
None 1 2 3 4 5 Total
Variety acceptability based on land sizes
Very low acceptance 92.0(87.4) 2 (4.1) 23(24.6) 1(1.4) 9(8.9) 17(17.7) 144(144.0) Low acceptance 10(20.6) 3(1.0) 10(5.8) 1(0.3) 4(2.1) 6(4.2) 34(34.0) Acceptance 17(12.7) 1(0.6) 2(3.6) 0(0.2) 0(1.3) 1(2.6) 21(21.0) High acceptance 2(2.4) 0(0.1) 1(0.7) 0(0.0) 0(0.2) 1(0.5) 4(4.0) Very high acceptance 7(4.9) 0(0.2) 0(1.4) 0(0.1) 0(0.5) 1(1.0) 8(8.0) Total 128(128.0) 6(6.0) 36(36.0) 2(2.0) 13(13.0) 26(26.0) 211(211.0) Chi-square = 27.396; Critical value =31.410; Df = 20; α = 0.05
Key: Figures in the brackets are the expected cell counts
1-Training of other farmers; 2-Hosting of field day;3- Formation of farmer research groups; 4-Participation in the establishment of demonstration plots; 5-Selling of seedcane.
Source: Research data, 2018
At 0.05 level of significance and 20 degrees of freedom, the critical value determined from the chi-square table was 31.410 and the calculated chi was 28.455. Since the calculated Chi of 28.455 was less than the critical chi of 31.410, it was concluded that there was no significant relationship between farmers’ role in the dissemination of
CONCLUSION
Small-scale sugarcane farmers in Kakamega County participated in the development and dissemination of the improved sugarcane varieties, although at a limited level. In the development process, only 19 percent of farmers were involved in seed cane production and on-farm experimentation. In the dissemination processes, 20 percent of farmers were involved in training of other farmers, hosting of field days, formation of other FRGs, establishment of demonstration farms and selling of improved seedcane. The study established that majority of sugarcane farmers lacked necessary technical information and experience related to the production of improved sugarcane varieties, which has been a hindrance to their acceptability by most farmers. The study established significant relationships between farmers’ participation in the development and dissemination of improved sugarcane varieties, with the acceptability of improved sugarcane varieties based on the number of years’ farmers have produced them. The number of year’s farmers have produced these varieties was a strong indicator of variety acceptability by farmers in Kakamega County.
Implication to Agricultural Extension
i. Provision of adequate technical information on the production of improved sugarcane varieties to farmers by the extension service providers is required.
ii. Utilization of participatory technology development and dissemination approaches need to be enhanced in the development of improved sugarcane technologies for enhanced acceptance by farmers.
.
ACKNOWLEDGEMENT
The authors are grateful to National Commission for Science, Technology and Innovation (NACOSTI) for granting permission to undertake this research study. Our gratitude is extended to Kenya Agricultural and Livestock Research Organisation (KALRO) and Egerton University for their support. Special thanks go to all who assisted during data collection and the respondents who gave valuable data without which the study would not have happened.
REFERENCES
Abukhzam M, Lee A (2010). Workforce attitude on technology adoption and Diffusion.The Built & Human Environment Review. [email protected] and [email protected]
Abura GO, Gikunda RM and Nato NG(2013).Technical knowledge and information gaps among smallholder farmers in production of sugarcane in Kakamega County, Kenya. IJASRT in EESs, 3(4), 199-207. Agriculture Fisheries and Food Authority (2016). Sugar
Directorate.
Agrocharts (2014). Kenya sugar annual. www.agrochart.com
Barua P (2016). Factors Affecting Technology Adoption among Smallholder Maize Farmers in Tanzania. Research Gate. Sustainable International Development. https://www.researchgate.net
Cavane E (2009). Farmers’attitudes and adoption of improved maize varieties and chemical fertilizers in Mozambique. African Crop Science Conference Proceedings, 9, 163-167.
Conroy C and Sutherland A (2014). Participatory technology development with resource poor farmers: Maximising impact through use of recommendations domains. Agricultural Research & Extension Network. Network paper No.133. UK.
Deligiannaki A and Ali M (2011). Cross-cultural influence on diffusion and adoption of innovation: An exploratory case study to investigate social-cultural barriers. European, Mediterranean and Middle Eastern Conference on Information Systems 2011, Athens, Greece.
Dillon A and Morris M (1996). User acceptance of information technology: Theories and models. In M. Williams (ed). Annual Review of Information Science and Technology, 31, 2-32.
Food and Agriculture Organization (2019). [email protected] Jackson SL (2009). Research Methods and Statistics: A Critical Thinking Approach 3rd
edition. Belmont, CA: Wadsworth
Kaihura FB (2001). Participatory Technology Development and Dissemination: A methodology for PLEC-Tanzania. PLEC Tanzania Progress Reports.
Kamau CN and Snipes K (2013). Kenya sugar annual report Kenya Agricultural and Livestock Research Organization (2019). Kenya Agricultural and Livestock Research Organization. Sugar Research Institute. E-Repository. www.kalro.org/sugar
Kenya Sugar Board (2014). Cane Census 2013/14- 14/15 Report.
Kenya Sugar Research Foundation (2012). Kenya Sugar Research Foundation. A framework for the production, certification and distribution of seed cane in the Kenya sugar industry. Kisumu, Kenya.
Kenya Sugar Research Foundation (2014, June). Newly released varieties, KESREF digest 7 (4).
Lihasi LK, Onyango C and Ochola W (2016). Analysis of Smallholder Sugarcane Farmers’ Livelihood Assets in Relation to Food Security in Mumias Sub-County Kenya. Journal of Economics and Sustainable Development.Vol.7, No.20 www.iiste.org Mnisi MS and Dlamini C S (2012). The concept of
sustainable sugarcane production: Global, African and South African perceptions. African Journal of Agricultural Research, 7 (31), 4337-4343. http://www.academicjournals.org
Murphy R (2017). Sugarcane: Production Systems, Uses and Economic Importance. Nova Science Publishers, Inc.
Mwanga D, Ong’ala J, Orwa G(2017). Modeling Sugarcane Yields in the Kenya Sugar Industry: A SARIMA Model Forecasting Approach. International Journal of Statistics and Applications, 7(6): 280-288. DOI: 10.5923/j.statistics.20170706.02
Ndemo B (Wednesday, March 28, 2018). Sour facts that blight local sugar industry. Bussiness Daily
Pedzisa T, Minde I and Twomlow S (2010). Use of participatory processes in wide-scale dissemination of micro dosing and conservation agriculture in Zimbabwe. Conference paper presented at the Joint 3rd African Association of Agricultural Economists (AAAE) and 48th Agricultural Economists Association of South Africa (AEASA), Cape Town, South Africa, September 19-23, 2010.
Rogers EM (2003). Diffusion of Innovations, Fifth Edition, Free Press, New York.
Smith E S and Ulu C 2012. Technology Adoption with Uncertain Future Costs and Quality. Operation research, 60 (2), 262-274.http://dx.doi.org/10.1287/opre.1110.1035
Sugar industry task force (2014, March). County Government of Kakamega sugar industry task force report.
The Research Advisors (2006). http://research-advisors.com/
Word Net 3.0 (2003-2012). Farlex clipart collection. Princeton University, Farlex Inc.
Yang P, Tao Y and Wu Y (2008). Use of unified theory of acceptance and use of technology to confer the behavioral model of 3G mobile telecommunication users. Journal of Statistics & Management Systems 11(5919–949
Zhao D and Li Y(2015). Climate change and sugarcane production: Potential impact and mitigation strategies. International Journal of Agronomy,10. http://dx.doi.org/10.1155/2015/547386
Accepted 19 July 2018
Citation: Thuo CM, Ombati JM, Nkurumwa AO (2019). Relationship between Farmers’ Participation in Technology Development and Dissemination Processes; and Acceptability of Improved Sugarcane Varieties in Kakamega County. International Journal of Agricultural Education and Extension, 5(2): 250-259.