Vol.9 (2019) No. 4
ISSN: 2088-5334
The Study of the Distribution and Deformation of Burden Layer in 250
Ton/Day Mini Blast Furnace Using Discrete Element Method
Sungging Pintowantoro
#1, Mas Irfan P. Hidayat
#2, Fakhreza Abdul
#3, Mohammad Rizki Febrianto
#4,
Hamzah Syaifullah
#5Department of Materials Engineering, Industrial Faculty of Technology, Institut Teknologi Sepuluh Nopember, 60177, Surabaya, Indonesia E-mail: #[email protected]; #[email protected]; #[email protected]; #[email protected];
#5
Abstract—Based on the abundant nickel ore resources in Indonesia, it is necessary to develop nickel ore processing technology. One of
the commercially proven nickel processing technology is Mini Blast Furnace (MBF). The feeding process in MBF using charging system. So, the burden material distribution in MBF can be controlled. The burden material controlling is important process in MBF. The distribution of burden material will affect the gas flow in MBF. This research focuses to study the effect of large bell diameter size to burden materials distribution in MBF using Discrete Element Method. After analysis, the differences of large bell diameter size will affect the burden materials distribution. If the diameter of large bell is greater, the impact point during charging process will be closer to the wall area. Then, the impact area on the surface of the layer will be on top of the layer. The distribution of burden materials in MBF is influenced by large bell size, kinetic energy at impact, particle mass, and particle size and layer stability. For particles distribution, the particles with small density (coal and dolomite) tend to be concentrated in the center zone. On the other hand, the particles with large density (ore) tend to be concentrated in the intermediate and peripheral zone. For the MBF start-up process, the best gas flow can be achieved by using large bell and MBF inner diameter ratio of 7: 10.
Keywords— mini blast furnace; bell-type charging system; discrete element method; burden materials distribution.
I. INTRODUCTION
Nickel laterite ore is classified into two types of ore, i.e.
limonite and saprolite. The limonite ore is a low grade nickel
ore which has Ni content of 1.1 until 1.8 wt%. In the other hand, the saprolite ore has nickel content of 2 wt% [1]. The
limonitic ore can be processed using hydrometallurgy route,
such as HPAL [2]. In the other hand, the saprolitic nickel ore can be processed using pyrometalurgy route, such as RKEF, Blast Furnace and Krupp-Renn [3]. In Indonesia, the RKEF and Blast Furnace process were implemented to process nickel ore.
According to the Indonesian Legislation of Minerals and Coals No. 4 of 2009 and as an effort to realize the independence of the Nation, Institut Teknologi Sepuluh Nopember (ITS) has been designing a Mini Blast Furnace (MBF) with capacity of 250 ton per day as a technology for lateritic nickel ore processing to produce ferronickel. MBF is a counter-current reactor that use pyro-metallurgical process [4]. MBF has a working principle similar to blast furnace but has a smaller scale.
MBF that developed by ITS has a capacity of 250 tons/day with a double-bell type charging system consisting
conducted to get representative information for the real application.
MBF development can be done by using MBF reactor either by trial error. But, trial error will affect the effectiveness of the study. The modeling method can get a mathematical approach so that variable selection parameters in trial and error can be narrowed. This method can be used to analyze the phenomenon of burden material distribution event when charging MBF by discrete element method. Discrete element method is a calculation based on Newton's second law to simulate particulate behavior. This method can describe forces on a single particle, knowing the particle stream and explaining the behavior of particulate motion [7]. Thus, this method is suitable for explaining the behavior of burden material movements within the MBF and is widely used in metallurgy. So this simulation process can be used to design charging system, with solid and gas flow.
II. MATERIAL AND METHODS
A. Numerical Simulation
Discrete Element Method is numerical analysis to calculate the interaction between solid particles in large quantities through translational motion and rotation due to outer force that use to simulate flow and interaction in solid particles. The interaction between the particles has been described in Newton's Law. The contact force represented by a spring and damping force is represented by a dashpot that can be associated with elasticity or particle plasticity. The magnitude of the tangential force is limited by the frictional force [7]. The translational acceleration and particle rotation are calculated by summing up all the forces and torques which are work on particles/body. A particle i, in which contact with the particle K (j = 1.2 ... K) for the force equation can be expressed by the following equation
[ ]
mig ij Fdt ij Fct ij Fdn Kj Fcnij L
V d
mi + + + +
=
= , , , )
1( ,
1 (1)
[ ]
( , , ) 1 ij T ij Tt dt i d i K j rI =
+=
ω (2)
Where Vi, Ii, ωi and mi represent translational velocity, moment of inertia, angular velocity and particle mass i. The translations of particles are affected by the normal force ( cn, ) and tangential force ( ct, ) particles i and j, damping force i and j and gravity ( ). As for the rotation of particles affected by tangential force ( t,) and rolling friction ( r,). The values of torque and force are described by model contact [8].
B. Material Properties
This research contained of five materials (ore, coal, dolomite, steel and refractory). In the process, conditioned ore, coal and dolomite classification as burden materials that charge through double-bell system. Steel is used as raw material of charging system. While refractory is the raw material of MBF wall. Material properties act as input of simulation process and influence the accuracy of simulation result. Material properties of Discrete Element Method
include of density, poison’s ratio, modulus young, restitution coefficient, static friction coefficient and rolling friction coefficient. Table 1 shows the material properties of five materials. The value of density is found by experiment. The other material properties got from some references [8], [9].
C. Geometries
TABLEI
MATERIALS PROPERTIES OF BURDEN
Mini Blast Furnace volume used in this research has 61 m3 working volume capacity. Cause of the symmetrical geometry, it simulated half of the total geometry. Therefore, the computational load decrease and the simulation run faster. Because the burden distribution of material over large bell has been uniform, the role of small bell is negligible. Large bell moves vertically with 1 m/s velocity. In this
Material Parameter Value Conditioned
ore
Density 1966 kg/m3
Poisson’s ratio 0.25 The
restitution coefficient
Conditioned ore 0.48
Coal 0.1
Dolomite 0.3
Steel 0.39
Refractory 0.4 The static
friction coefficient
Conditioned ore 0.49
Coal 0.43
Dolomite 0.4
Steel 0.5
Refractory 0.45 The rolling
friction coefficient
Conditioned ore 0.21
Coal 0.35
Dolomite 0.29
Steel 0.25
Refractory 0.3
Coal Density 1427 kg/m3
Poisson’s ratio 0.24 The
restitution coefficient
Coal 0.64
Dolomite 0.45
Steel 0.63
Refractory 0.5 The static
friction coefficient
Coal 0.69
Dolomite 0.6
Steel 0.36
Refractory 0.45 The rolling
friction coefficient
Coal 0.14
Dolomite 0.2
Steel 0.24
Refractory 0.25
Dolomite Density 1645 kg/m3
Poisson’s ratio 0.16 The
restitution coefficient
Dolomite 0.32
Steel 0.2
Refractory 0.4 The static
friction coefficient
Dolomite 0.43
Steel 0.5
Refractory 0.55 The rolling
friction coefficient
Dolomite 0.39
Steel 0.22
Refractory 0.34
Steel Density 7870 kg/m3
Poisson’s ratio 0.29 Young’s Modulus (MPa) 77 x 103
Refractory Density 3100 kg/m3
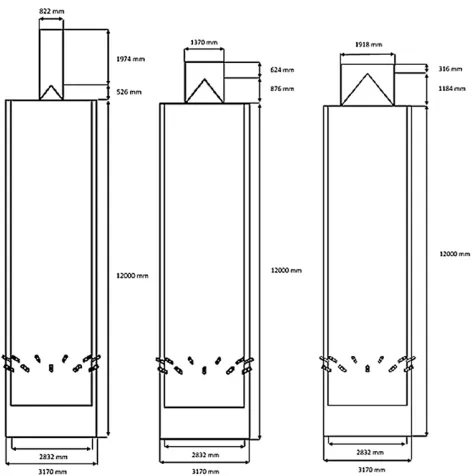
simulation, large bell diameter varied in 3 sizes that is shown by Table 2.
TABLE II RESEARCH VARIABLES
Variables Large Bell
Diameter (mm)
Diameter Ratio of Large Bell and Inner MBF
1 425 3 : 10
2 708 5 : 10
3 991 7 : 10
In the other hand, the MBF geometry was shown in Fig. 1. It can be shown that the height of MBF is 12 m and the inner diameter of MBF is 2.832 m.
Fig. 1. Mini Blast Furnace geometry of Variable 1, 2 and 3, respectively.
D. Particle Shape
In this simulation, burden materials illustrated in 7 shape (a shape for conditioned ore, 3 shapes for coal and 3 shapes for dolomite). The default of DEM is simulated for perfect spherical particles. The burden material particles modeled in the DEM software are attempted to approximate the actual particle shape. The best method for accounting the particle shape is using clumped spheres or multi-sphere method [10]. DEM Particle shape for this research is shown by Fig. 2 which is modeled close to the real particle.
Fig. 2. Shape of Burden Materials : a) Conditioned/Roasted Ore, (b) Coal “A”, (c) Coal “B”, d) Coal “C”, (e) Dolomite “A”, (f) Dolomite “B” and (g)
Dolomite “C”
III.RESULT AND DISCUSSION
A. Layer formation of burden materials
Layer formation in MBF show the difference for the three variables. The burden materials layer formation for each variable is shown by Fig. 3. Variable 3 has the greatest layout altitude of 9,692.5 mm, so the distance between the material falls (bell lip) with the surface of the layer will be smaller.
Fig. 3. Burden materials distribution
Variable 3 has the top layer on the wall area and variable 2 is near the wall. While variable 1 has the top layer in the area between the wall and center (most approaching center). It indicates that the impact point of burden material layer is affected by the ratio between large bell diameter and inner diameter of MBF. The larger bell diameter, the impact point will be close to the wall area. Therefore, each variable has different layer slope levels between the top and bottom layers.
temperature gap between refractory and burden materials. So, the ability of reduction would decrease significantly that influence the productivity levels of MBF. In other variables, variable 2 and 3 dispose to form central working furnace. Where the largest gas flow is in the center area. So, the heatless on the wall area can be minimized [12].
Fig. 4. Surface shape of burden stock
B. Deformation of Burden Materials Layer
Physical phenomena of fall and collisions between burden materials during the charging process becomes important to know, especially for operators and engineers to make the processing run efficiently. The shape, size and type of charging system also have the same effect. The deformation research on the burden materials layer is focused on the top layer in the MBF, which is layer 20 because this layer has a large effect on MBF operation when running continuously. Fig. 5 shows the process of charging conditioned ore. The reduction process causes the amount of burden materials to decrease. Where the reduced burden of materials has been transformed into off-gas, slag and molten Ferro-nickel due to chemical reactions at high temperatures [12].
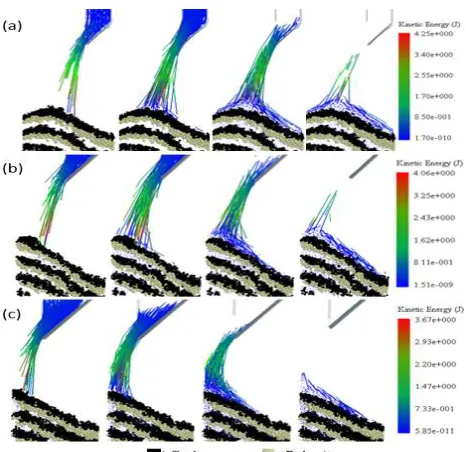
Fig. 5. Charging Process Conditioned Ore, (a) Variable 1, (b) Variable 2 and (c) Variable 3
Conditioned ore is displayed by a stream. The length of stream shows the distance of the particle displacement per unit of time. So, the longer streams indicate the larger the particle displacement. The largest kinetic energy is owned
by variable 1. Fig. 6 show the kinetic energy of three variables used.
Fig. 6. The kinetic energy of three variables used
Variable 1 has the maximum kinetic energy when the particle collide, i.e. 2.47 Joule. While the maximum kinetic energy value for variables 2 and 3 is 2.39 Joule and 2.2 Joule, respectively. Maximum kinetic energy in variable 3 is the lowest because the burden will impact with the wall before the coal particles hit the dolomite layer. The larger kinetic energy will affect the deformation of burden layer. So, the distribution of burden will change. The change of burden distribution will affect the coal and conditioned ore ratio. So, the reduction rate will change too.
When analyzed from the position of the fall of the particles during the charging process, the particles in variable 1 fall closer to the MBF center. This is due to the smaller large bell diameter size compared to other variables. After the collision, the flows of conditioned particles moves toward the center area and the MBF wall (lower area).
Fig. 7. Layer Coal condition after collision
with the pounder particles also gives effect to the deformation of the layer. The kinetic energy in each variable has a small effect on the impacted layer due to the small mass deviation in every particle of burden materials. However, kinetic energy has a role as the initiation of gravity failure of the layer. Variable 1 is the variable with the most stable layer and variable 3 has the most unstable layer due to the slope of the largest layer.
When reviewing the effect of the fraction or thickness of the burden material layer on the gas flow at the start-up process, it is necessary to divide the region within the MBF based on the temperature distribution. The division of the region is based on the temperature distribution because at some temperature the burden material will undergo a phase change which will then have a different effect on the flow of gas when compared to before the phase change.
The area within the MBF closer to the tuner will have a greater temperature, because the tuner has the highest temperature (1900-23000C) [12]. So in the discussion of the effect of gas flow, the area within the MBF is divided into two regions, those are regions with temperatures above 1000
0C and areas with temperatures of less than 10000C. Areas
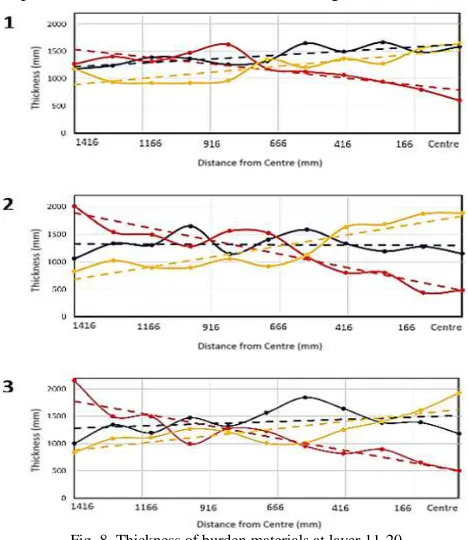
with temperatures above 10000C are in layers 1-10. While regions with temperatures below 10000C are at layers 11-20. This division assumption is based on [10] research where the average temperature of 10000C is at half the working volume of MBF in the wall area. The thickness of the MBF layer at temperatures below 10000C is shown in Fig. 8.
Fig. 8. Thickness of burden materials at layer 11-20
The thickness of burden materials looks different at certain radial positions. In Fig. 8, the trends of the conditioned ore thickness for the three variables decreases as it approaches the center area. While the dolomite thickness trend tends to increase as it approaches the center area. Coal chart trends is more stable or linear. In the wall area, conditioned ore has the largest thickness among other burden materials. While the area between the wall and center
particles are more fluctuate. Then, at the center area MBF is dominated by dolomite particle.
When the process starting, each burden material undergoes reduction in size and even a phase change at a certain temperature. In the temperature below the melting and softening zone (100-1000 0C), burden materials particles will degrade into smaller sizes. In the charging zone area for example, burden materials can be degraded due to impact stress and abrasion between particles [13]. At higher temperatures (above 6000C) when the reduction of hematite to magnetite starts, the conditioned ore particles undergo internal stress which causes increased density and particle size reduction [12]. While at a temperature of 700-9600C decomposed dolomite particles which subsequently led to a reduction in particle size. For coal particles, the particles begin to react with CO2 at temperatures of 9000C to 10000C.
In the granular zone, coal is degraded (the majority of abrasion) due to gasification processes and mechanical forces. However, the rate of coal degradation is not as dolomite and conditioned ore.
Based on the deformation occurring at a temperature of 100 - 10000C for each burden material, the majority of particles are reduced in size to a certain degree. At temperatures before the process of reduction temperature, the flow of gas would be easily flow through the ore conditioned layer due to the largest particle volume. But at reduction temperature, coal has a larger volume of particles.
Based on Fig. 8, the thickness of the layer on variable 1 is dominated by coal particles and conditioned ore which have a large permeability level. While at the center is dominated by dolomite particles which has the least permeability level, so the gas flow will be more difficult to pass through this area. However, when compared with variables 2 and 3, dolomite concentrate in the smaller center area. So in the center area, variable 1 has the best gas flow. The good gas flow in the center is the most desirable for the operation, because this region is the region with the least heat loss and the gas flow distribution will be more evenly distributed. The dominant dolomite thickness is found in variable 2, with radial length starting from center point to 500 mm from center. So this variable is not good for sustainability process. Variable 3 has the highest coal thickness at a distance of 270 mm from the center. While in the center area thickness of burden materials dominated by dolomite. In the area of the wall up to a distance of 270 mm from the center, the thickness is dominated by coal and conditioned ore which has a smaller resistivity level compared with dolomite. So the largest gas flow is in the wall area and a distance of 500 mm from the center. From these three variables, it can be determined that the best variables are evaluated from the gas stream in regions with temperatures below 10000C belonging to variable 3, since this variable has a resistivity region (dolomite dominance) against the smallest gas flow.
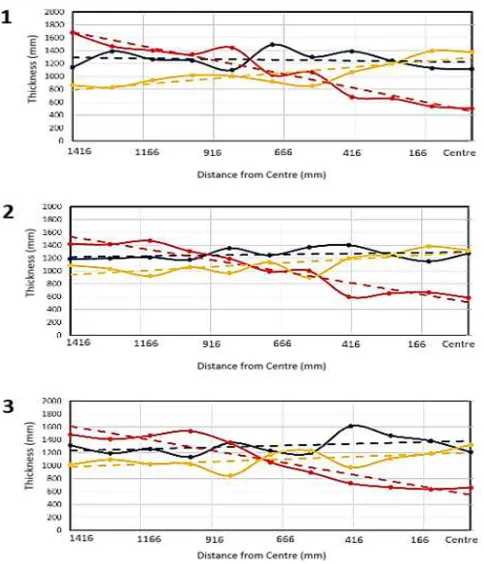
in softening and melting zone, coal is the only solid material that function as gas distributor [12]. Fig. 9 shows the MBF layer thickness of temperature higher than 10000C.
Fig. 9. Thickness of burden materials at layer 1-10
When looking at the trend graph in areas with temperatures above 10000C, the thickness of each burden materials in radial direction show the same conditions with the area below 10000C. In the center area, the thickness of the layer is dominated by dolomite particles. However variable 3 have the dominance of the lowest dolomite thickness. In addition to having the area with the least gas flow resistance, variable 3 has the largest coal thickness in radial area with a distance of 416 mm from the center. So the large gas flow will be concentrated in this area which would be distributed to upper areas. If it is compared with coke in Blast Furnace, the pressure drop increased with decreasing coke layer thickness [14].For layer thickness less than ≤ 1 m, the pressure drop will be greatly influenced by void of packed bed [15]. In this case, variable 3 has the largest void compared to other variables because of the greater portion of coal. Thus, the resistance to the gas flow is lower than that the other variables. This makes the variable 3 is estimated to have a lower pressure drop than the other variables. Therefore, when considering the area at temperatures above and below 10000C, variables are selected (the best) for the start-up process when considered the gas flow is variable 3.
IV.CONCLUSION
After analyzing the result of the simulation process, we get some conclusion. If the diameter of large bell is greater, the impact point during charging process will be closer to the wall area. Then, the impact area on the surface of the layer will be the top of the layer. Where, the most influential
deformation type in the three variables is the gravity failure that is affected by the instability of the layer. The distribution of burden materials in Mini blast furnaces is influenced by large bell size, kinetic energy at impact, particle mass, and particle size and layer stability. MBF with ratio of large bell diameter and MBF inner diameter of 7: 10 (variable 3) has the largest conditioned ore fraction in the wall area and the largest dolomite fraction in the center area. The best variable for start-up process by considering gas flow is variable 3.
ACKNOWLEDGMENT
We would like to thank Ministry of Research and Higher Education of Rep. of Indonesia for funding this research (Insinas Program).
REFERENCES
[1] Chen, G., J., Sun, T., Lu, Q., “Study of the mechanism of the direct reduction roasting of the limonite in Jiangxi”. Journal of Chemical and Pharmaceutical Research, vol. 6(3), pp. 671-678, 2014. [2] Pickles, C.A., Forster, J., Elliot, R., “Thermodynamics analysis of the
carbothermic reduction roasting of nickeliferous limonitic laterite ore” Miner Eng. vol. 65, pp. 33-40, 2014.
[3] M. Rao, G. Li, T. Jiang, J. Luo, Y. Zhang, X. Fan, “Novel process and mechanisms of preparing ferronickel materials from nickeliferous laterite ores”, Journal of The Minerals, Metals & Materials Society, vol. 65, no. 11, pp. 1573-1583, 2013.
[4] Y. Matsui, K. Shibata, and Y. Yoshida, “The principle of blast furnace operational technology and centralized gas flow by center coke charging,” Kobelco Technol. Rev., vol. 26, pp. 12–20, 2005. [5] M. Naito, K. Takeda, Y. Matsui, “Ironmaking technology for the last
100 years: Deployment to advanced technologies from introduction of technological know-how, and evolution to next-generation process”, ISIJ Int., vol. 55, no. 1, pp. 7-35, 2015.
[6] W. Xu, S. Cheng, Q. Niu, G. Zhao, “Effect of the main feeding belt position on burden distribution during charging process of bell-less top blast furnace with two parallel hoppers”, ISIJ Int., vol. 57, no. 7, pp. 1173-1180, 2017.
[7] T. Mitra, H. Saxen, “Investigation of coke collapse in the blast furnace using mathematical modelingand small scale experiments”, ISIJ Int., vol. 56, no. 9, pp. 1570-1579, 2016.
[8] T. Mitra and H. Saxen, “Simulation of burden distribution and charging in an ironmaking blast furnace,” IFAC-PapersOnLine, vol. 28, no. 17, pp. 183–188, 2015.
[9] V. B. Teffo and N. Naudé, “Determination of the coefficients of restitution , static and rolling friction of Eskom-grade coal for discrete element modelling”, The Journal of The Southern African Institute of Mining and Metallurgy, vol. 113, no. 4, pp. 351–356, 2013.
[10] T. Pöschel and T. Schwager, Computational Granular Dynamics: Models and Algorithms, 1st ed., Berlin, Germany: Springer-Verlag, 2005.
[11] A. K. Biswas, Principle of Blast Furnace Ironmaking-Theory and Practice, 1st ed., Calcutta, India: SBA Publications, 1981.
[12] M. Geerdes, R. Chaighneau, I. Kurunov, Modern Blast Furnace Ironmaking, 3rd ed., Amsterdam, Netherland: IOS Press, 2015. [13] M. Ichida, M. Takao, Y. Morizane, T. Nakayama, K. Anan, K.
Kakiuchi, I. Yamada, “Inner Profile and Burden Descent Behavior in the Blast Furnace,” Nippon Steel Tech. Rep. 94, 80–86, 2006. [14] Ichikawa, K., Kashihara, Y., Oyama, N., Hirosawa, T., Ishii, J., Sato,
M., Matsuno, H., “Evaluating effect of coke layer thickness on permeability by pressure drop estimation model”, ISIJ int., vol. 57, no. 2, pp. 254-261, 2017.