High-Frequency Modeling of Coplanar Waveguides
Including Surface Roughness
Gerald Gold1, Konstantin Lomakin1, Klaus Helmreich1, and Uwe Arz2
1Institute of Microwaves and Photonics, Friedrich-Alexander University
Erlangen-Nuremberg (FAU), 91058 Erlangen, Germany
2Physikalisch-Technische Bundesanstalt (PTB), Bundesallee 100, 38116 Braunschweig, Germany
Correspondence:Gerald Gold ([email protected])
Received: 19 December 2018 – Accepted: 7 March 2019 – Published: 19 September 2019
Abstract. An existing analytical transmission line model to describe propagation properties of coplanar waveguides including dispersion and radiation effects was extended to take into account surface roughness of conductor traces. The influence of parasitics is successively included in the simulation and compared to measurements. The device un-der test (DUT) was fabricated on an Al2O3wafer. A metal
and ceramic chuck was utilized during measurements up to 120 GHz. The extended model is then capable of precisely predicting propagation properties in a wide frequency range and can now be used for calibration purposes like the devel-opment of uncertainty budgets.
1 Introduction
Coplanar waveguides (CPWs) are frequently used in all dif-ferent kinds of planar circuits like (printed circuit boards) PCBs and on-wafer applications. Especially the latter – ubiq-uitous nano- and microelectronics – utilize this transmis-sion line type particularly. The exact knowledge of its high-frequency properties thus is essential for modern electronics with increasing data-rates and consequently increasing appli-cation frequencies.
Nowadays numerical full-wave electro-magnetic simula-tors are available that are capable of accounting for parasitic effects like dispersion, radiation and conductor loss effects (Schmückle et al., 2011). Nevertheless analytical transmis-sion line models are required for developing reliable uncer-tainty budgets for calibration purposes (Arz et al., 2017) and moreover have fundamental importance to microwave de-sign.
Such an analytical model was presented in the early nineties (Heinrich, 1993). This quasi-TEM approach de-scribes the electrical behavior of a CPW from DC to a certain frequency – depending on CPW dimensions – from where on radiation and additional dispersion, due to coupling to higher order modes, take place. These effects were added to the CPW model in (Schnieder et al., 2003), so that modeling of CPW properties at high frequencies is possible now. But at high frequencies the skin depth decreases to the order of sur-face roughness, so that the assumption of ideal smooth con-ductor walls does not hold anymore and roughness strongly impacts on transmission properties of any kind of waveguide. This paper shows the application of a roughness model (Gold and Helmreich, 2012) that is capable of accounting for impact on loss and delay of transmission lines to the contemplated CPW model. This new extension finally al-lows for precisely describing properties of CPWs including all known parasitic effects. The model predictions are com-pared to measurements of CPWs on Al2O3with both metal
and ceramic chuck and show a very good agreement in both scenarios.
2 Measurement Assembly
In the following the geometrical parameterswg,w,t,s and
h are utilized as shown in the sketched cross-section of a CPW in Fig. 1. Additionally the material parameters relative permittivityεr of the substrate, dielectric loss tangent tanδ
and conductivityσ of the traces are necessary.
w 50 µm
s 25 µm
wg 270 µm t 6.5 µm
h 500 µm
εr 9.7
tanδ 1.25×10⁻⁴
σDC 36 MS m−1
chuckis used. Depending on its material, metal or ceramic, there is an impact on the measurement and consequently has to be considered during simulation, which is done by assum-ing an infinite substrate in the case of the ceramic chuck. This assumption is justified, since the height of the chuck is very large compared to the substrate, so that the electromag-netic field does not penetrate through it. Additionally, the rel-ative permittivity of the chuck and substrate are assumed to be equal. The metal chuck results in a boundary condition respectively after the specified substrate height. A more de-tailed insight of the impact from different chuck permittivi-ties is given in Phung et al. (2018a, b).
The CPW was fabricated on an Al2O3 substrate, which
was characterized separately with a split cylinder resonator (Janezic, 2003). The relative permittivity in the frequency range from 8 to 22 GHz was measured as 9.7, the loss tangent about 1.25×10⁻⁴ to 1.5×10⁻⁴. The nominal dimensions of the lines arew=50 µm,s=25 µm,wg=270 µm. Due to
the electroplating process the conductive traces are subject to a variation of their thickness across the wafer. A figure of 6.5 µm therefore is used in the following investigations. Likewise the conductivityσDCis affected by the
electroplat-ing process, since it is always lower compared to bulk metal. Because of that we use a conductivity value of 36 MS m−1.
Thus, measurements were performed whereby the com-plex propagation coefficientγ of the CPW is obtained by a multiline calibration method (Marks, 1991). The measured responses are presented as attenuationα=Re(γ )and effec-tive permittivityεr,eff= c0/vp
2
, in whichvpin turn is the
phase velocityvp=ω/Im(γ ).
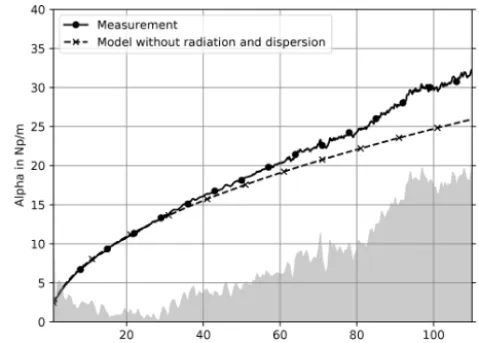
Figure 2.Measured and simulated attenuation on metal chuck. The simulation does neither include radiation and dispersion nor surface roughness.
3 Modeling
In the next sections, the CPW model with and without radia-tion and dispersion effects is compared to the measured prop-agation properties. Then the application of the surface rough-ness model is explained. For this purpose the relationship be-tween independently measured surface profile data, magnetic field and resulting effective, frequency dependent material parameters and necessary adaptions in the CPW model are shown.
3.1 CPW Model without dispersion and radiation
In analytical transmission line models, the electromagnetic properties are described with per unit length (pul) parame-tersL0andC0, the loss mechanisms withR0 andG0 for an infinitesimal short transmission line segmentdz. From those parameters, the complex propagation coefficient can be cal-culated:
γ=p(R0+j ωL0) (G0+j ωC0) (1) It’s worth to note, that both outer and inner inductance contribute to the total pul inductanceL0=L0o+L0i. The in-ner inductance represents the magnetic field penetrating the conductor due to its finite conductivity, i.e. the skin effect.
The quasi-TEM model approach (Heinrich, 1993) includes conductor loss, substrate loss and finite metallization thick-ness. With the geometrical and material properties from sec-tion II, attenuasec-tionαand effective, relative permittivityεr,eff
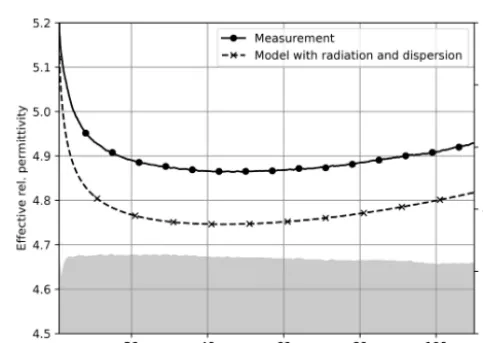
Figure 3. Measured and simulated effective rel. permittivity on metal chuck. The simulation does neither include radiation and dis-persion nor surface roughness.
The simulation is in good agreement with the measured responses at lower frequencies. The deviation of simulated and measured attenuation gets significant above 40 GHz. The effective rel. permittivities in Fig. 3 mainly show an offset, which could be explained by uncertainties inεrof substrate,
metallization thickness t or surface roughness impact. Be-sides this, the shape of the response clearly drift apart above 40 GHz.
3.2 CPW Model with radiation and dispersion
The CPW model (Schnieder et al., 2003) is an extension to the quasi-TEM model (Heinrich, 1993) now considering ra-diation and dispersion effects. As a result, it delivers an atten-uation response (Fig. 4), that adapts the measured response much better.
Particularly, with regard to the bend towards higher attenu-ation that is observed above 60 GHz. This response strongly differs from the one calculated with the quasi-TEM model having only a √f- and f-dependency and the relative er-ror decreases below 10 %. Including dispersion effects in the model also leads to a simulated effective permittivity (Fig. 5) which shows a similar response as the measured one. Es-pecially, the increase of phase delay above 60 GHz is now depicted. The relative error stays below 3 % and indicates a merely constant offset over the entire frequency range. 3.3 Surface Roughness
Generally a model should have an underlying physical no-tion, a minimum number of parameters and of course it must predict measurement results with reasonable accuracy. Espe-cially a model for the interaction of electromagnetic fields with rough surfaces should utilize input parameters for sur-face properties, that are well known and specified in sursur-face
Figure 4.Measured and simulated attenuation on metal chuck. The simulation includes radiation and dispersion.
Figure 5. Measured and simulated effective rel. permittivity on metal chuck. The simulation includes radiation and dispersion.
metrology. For example the RMS1-roughnessRq is an esti-mate for the standard deviation of the surface profile from the mean surface. It is defined in ISO 4287 (1997-04) among other surface texture parameters.
The Gradient Model presented by Gold and Helmreich (2012) fulfills the stated requirements and is capable of pre-dicting roughness impact on both loss and delay. Therefore the rough surface is modeled by a continuous conductivity transition from the dielectric to the bulk conductivityσDC.In
the following the parameterx describes the depth counting positively into the material. For surface profiles that are dis-tributed normally, it only requires one additional parameter, the RMS-roughnessRqto calculate the conductivity profile:
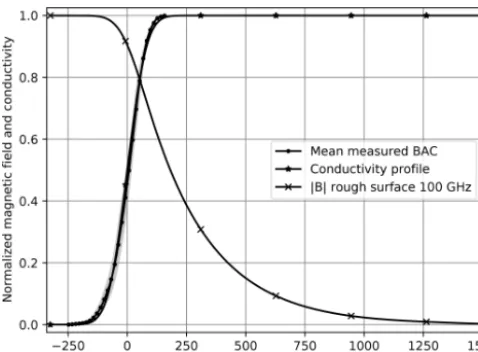
Figure 6.Measured BAC, CDF from Eq. (2) withRq=63.5 nm
and simulated magnetic field at 100 GHz for the rough surface.
σ (x)=CDF(x)·σDC
=σDC·
1 Rq
√ 2π
x Z
−∞
exp − u 2
2R2
q !
du (2)
Many surface profile measurement systems like tactile or optical ones not only deliver statistical parameters, but also the bearing area curve (BAC) or Abott-Firestone curve (Ab-bott and Firestone, 1933), which corresponds to a cumula-tive probability density function. In cases of not very random surface profiles, such as with chatter marks for example, the Gradient Model is also capable of dealing with the measured BAC directly.
3.3.1 Surface Profile Measurements
The mean response from four BAC measurements at the top of the Al2O3 wafer metallization is shown in Fig. 6. The
standard deviation is marked gray in the background. From the mean BAC,Rqwas estimated to beRq=63.5 nm. Then again a CDF can be calculated with Eq. (2), which is also shown in Fig. 6 and multiplied withσDCused as conductivity
profile to calculate the magnetic field in the rough surface. It can be clearly seen, that the magnitude of the magnetic field differs from an exponential function, which is the solution of classical skin effect for ideally smooth surfaces.
3.3.2 Application using effective material parameters
From the magnetic field all other relevant quantities, e.g. loss power density, magnetic field energy, etc. can be calculated. Since most analytical transmission line models assume ide-ally smooth surfaces, the application of the Gradient Model utilizing effective, frequency dependent material parameter
Figure 7.Decreasing effective conductivityσeffand increasing
ef-fective permeabilityµr,effforRq=63.5 nm.
was shown in Gold and Helmreich (2017). The effective con-ductivityσeff represents roughness impact on loss (R0) and
the effective permeabilityµr,eff the impact on inner
induc-tance (L0i). They are determined by comparing loss power density or magnetic field energy of the rough and smooth sur-face respectively. The responses forRq=63.5 nm are shown in Fig. 7. In this case, the effective material values are differ-ent from the ideal case, i.e.σeff=σDCandµr,eff=1 but
rel-atively close to it. That is because even for 100 GHz the skin depth is roughly four times larger thanRq. Or in other words the conductors are very smooth – but not ideally smooth – in the regarded frequency range.
3.4 CPW Model with radiation, dispersion and roughness
The advantage of using effective material parameters to de-pict roughness impact is, that they can be utilized in any model assuming ideally smooth surfaces. This is done by simply replacing material with effective material parameters, one only has to take care of their frequency dependence.
The CPW model distinguishes three frequency sections: The quasi-static case, a transition region and the skin effect region. Since the Gradient Model assumes the skin effect, only skin effect and transition region has to be adapted. In the latter, the conductivity σ is replaced byσeff in the pul
parameterR0:
Rc01= rω
c2µ0
2σeff ·F
(c) L
4F02 (3)
Rg10 = rω
g2µ0
2σeff ·F
(g) L
In the skin effect region the modifications of the pul resis-tancesRc0,Rg0 are as follows:
Rc0= rωµ
0
2σeff ·F
(c) L 4F02
·
1+a4(c)ωc2 ω
2
(6)
Rg0 = rωµ
0
2σeff ·F
(g) L 4F02
·
1+a4(g)ωg2 ω
2
(7)
The pul inductanceL0in the skin effect region becomes:
L0=Le,∞+ rµ
r, effµ0
2ωσDC ·F
(c) L +F
(g) L 4F02 ·
1+a5(c)ωL2 ω
2
(8)
From the original document (Heinrich, 1993) only Eqs. (6), (7), (9) and expressions forR0c1,R0g1andL0z2were modified. The variablesFLandF0are geometry factors and
are also derived in (Heinrich, 1993). All other equations can be left untouched.
4 Results
As a result we obtain a model including most known par-asitics, that can precisely predict propagation properties of CPWs. The additional consideration of surface roughness impact leads to an improvement in the frequency range from 50 to 100 GHz regarding the attenuation in Fig. 8 utiliz-ing a metal chuck. The relative error stays below 5 % up to 100 GHz. Above 100 GHz measurement uncertainties be-come larger due to influences from parasitic modes such as e.g. substrate modes.
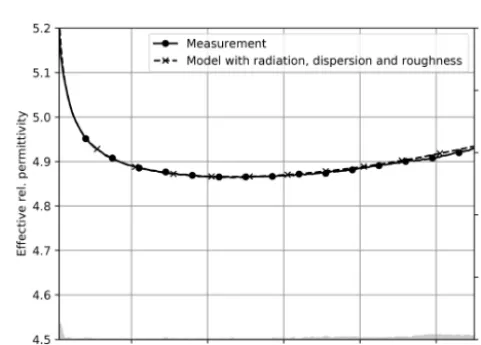
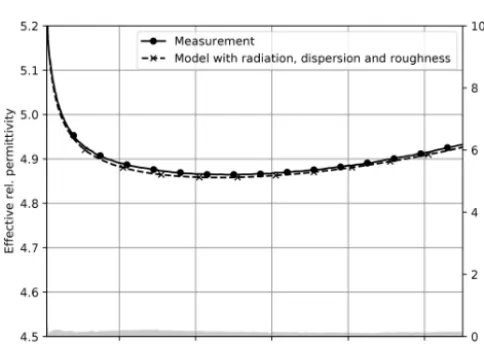
The surface roughness impact on phase delay and effective rel. permittivity respectively is typically nearly constant over the regarded frequency range (Fig. 9), so that the simulated and measured responses only lead to an effective error below 0.5 %.
Measurements of the same wafer on a ceramic chuck lead to slightly different results. Especially, the attenuation does not show a distinctive bend above 60 GHz. Figure 10 shows, that it is much closer to a √f- and f-dependency than the responses obtained from measurements utilizing a metal chuck.
Figure 8.Measured and simulated attenuation on metal chuck. The simulation includes radiation, dispersion and roughness.
Figure 9. Measured and simulated effective rel. permittivity on metal chuck. The simulation includes radiation, dispersion and roughness.
In the simulation the ceramic chuck was considered by as-suming an infinite substrate height, since it consists of a sim-ilar material.
Like in the case with metal chuck, the relative error only raises to noteworthy figures above 100 GHz.
Also the effective relative permittivity in case of a ceramic chuck is predicted very well, as can be seen in Fig. 11 with a similar relative error as for the measurements on a metal chuck.
5 Conclusions
Figure 10.Measured and simulated attenuation on ceramic chuck. The simulation includes radiation, dispersion and roughness.
Figure 11. Measured and simulated effective rel. permittivity on ceramic chuck. The simulation includes radiation, dispersion and roughness.
considers roughness impact on both phase and delay. Its in-put parameter, the RMS-roughnessRq, was estimated from measured bearing area curves. The obtained model now in-cludes parasitics like dispersion, radiation and conductor sur-face roughness.
The DUT was fabricated on an Al2O3substrate and was
measured utilizing a ceramic and a metal chuck. The simula-tions with the extended model precisely predict the measured responses, i.e. attenuation and phase delay in both cases up to 100 GHz. The impact from dispersion and surface roughness on attenuation and effective relative permittivity was shown by successively including those parasitics in simulations.
Precise analytical transmission line models including par-asitics are fundamental for developing reliable uncertainty budgets for calibration purposes and also have their impor-tance in design.
The authors acknowledge support by the European Metrol-ogy Programme for Innovation and Research (EMPIR) Project 14IND02 “Microwave measurements for planar circuits and com-ponents”. The EMPIR program is co-financed by the participating countries and from the European Union’s Horizon 2020 research and innovation program.
Review statement. This paper was edited by Thorsten Schrader and reviewed by two anonymous referees.
References
Abbott, E. and Firestone, F.: Specifying surface quality: a method based on accurate measurement and comparison, Mech. Eng., 55, 569–572, 1933.
Arz, U., Zinal, S., Probst, T., Hechtfischer, G., Schmückle, F. J., and Heinrich, W.: Establishing traceability for on-wafer S-parameter measurements of membrane technology devices up to 110 GHz, in: 2017 90th ARFTG Microwave Measurement Symposium (ARFTG), Boulder, CO, 1–4, https://doi.org/10.1109/ARFTG.2017.8255874, 2017.
Gold, G. and Helmreich, K.: A Physical Model for Skin Effect in Rough Surfaces, in: 2012 7th European Microwave Integrated Circuit Conference, Amsterdam, 631–634, 2012.
Gold, G. and Helmreich, K.: A Physical Surface Roughness Model and Its Applications, IEEE T. Microw. Theory, 65, 3720–3732, https://doi.org/10.1109/TMTT.2017.2695192, 2017.
Heinrich, W.: Quasi-TEM description of MMIC coplanar lines in-cluding conductor-loss effects, IEEE T. Microw. Theory, 41, 45– 52, https://doi.org/10.1109/22.210228, 1993.
ISO 4287: Geometrical product specification (GPS) Surface texture: Profile method; Terms, definitions and surface texture param-eters, ISO, the International Organization for Standardization, 1997.
Janezic, M. D.: Nondestructive Relative Permittivity and Losstan-gent Measurements Using a Split-cylinder Resonator, PhD dis-sertation, University of Colorado, Boulder, 2003.
Marks, R. B.: A multiline method of network analyzer calibration, IEEE T. Microw. Theory, 39, 1205–1215, https://doi.org/10.1109/22.85388, 1991.