R E S E A R C H
Open Access
Fidelity to and comparative results across
behavioral interventions evaluated through
the RE-AIM framework: a systematic review
Samantha M. Harden
1*, Bridget Gaglio
2, Jo Ann Shoup
3,4, Kimberlee A. Kinney
1, Sallie Beth Johnson
1,
Fabiana Brito
1, Kacie C. A. Blackman
1,5, Jamie M. Zoellner
1, Jennie L. Hill
1, Fabio A. Almeida
1,6,
Russell E. Glasgow
7and Paul A. Estabrooks
1,6Abstract
Background:The reach, effectiveness, adoption, implementation, and maintenance (RE-AIM) framework was
developed to determine potential public health impact of interventions (i.e., programs, policy, and practice). The purpose of this systematic review was to determine (1) comparative results across accurately reported RE-AIM indicators, (2) relevant information when there remains under-reporting or misclassification of data across each dimension, (3) the degree to which authors intervened to improve outcomes related to each dimension, and (4) the number of articles reporting RE-AIM dimensions for a given study.
Methods:In April 2013, a systematic search of the RE-AIM framework was completed in PubMed, PSYCHInfo,
EbscoHost, Web of Science, and Scopus. Evidence was analyzed until January 2015.
Results:Eighty-two interventions that included empirical data related to at least one of the RE-AIM dimensions were included in the review. Across these interventions, they reached a median sample size of 320 participants (M= 4894 ± 28,256). Summarizing the effectiveness indicators, we found that: the average participation rate was 45 % (±28 %), 89 % of the interventions reported positive changes in the primary outcome and 11 interventions reported broader outcomes (e.g., quality of life). As for individual-level maintenance, 11 % of studies showed effects ≥6 months post-program. Average setting and staff adoption rates were 75 % (±32 %) and 79 % (±28 %),
respectively. Interventions reported being delivered as intended (82 % (±16 %)) and 22 % intervention reported adaptations to delivery. There were insufficient data to determine average maintenance at the organizational level. Data on costs associated with each dimension were infrequent and disparate: four studies reported costs of recruitment, two reported intervention costs per participant, and two reported adoption costs.
Conclusions:The RE-AIM framework has been employed in a variety of populations and settings for the planning, delivery, and evaluation of behavioral interventions. This review highlights inconsistencies in the degree to which authors reported each dimension in its entirety as well as inaccuracies in reporting indicators within each dimension. Further, there are few interventions that aim to improve outcomes related to reach, adoption, implementation, and maintenance.
Keywords:RE-AIM, Behavior change, Translation
* Correspondence:[email protected]
1
Human Nutrition, Foods and Exercise, Virginia Tech, Blacksburg, VA 24060, USA
Full list of author information is available at the end of the article
© 2015 Harden et al.Open AccessThis article is distributed under the terms of the Creative Commons Attribution 4.0 International License (http://creativecommons.org/licenses/by/4.0/), which permits unrestricted use, distribution, and reproduction in any medium, provided you give appropriate credit to the original author(s) and the source, provide a link to the Creative Commons license, and indicate if changes were made. The Creative Commons Public Domain Dedication waiver (http://creativecommons.org/publicdomain/zero/1.0/) applies to the data made available in this article, unless otherwise stated. Hardenet al. Systematic Reviews (2015) 4:155
Background
The reach, effectiveness, adoption, implementation, and maintenance (RE-AIM) framework was developed to im-prove the balanced reporting of internal and external validities of behavioral interventions [1, 2]. This trans-parent and consistent reporting may lead to a better un-derstanding of the complexity [3] and potential public health impact of behavioral interventions [1, 2]. Reach assesses the number, proportion, and characteristics of participants when compared to the target audience. Ef-fectiveness assesses whether the targeted behavioral out-come was achieved and changes to quality of life (QOL) or other important outcomes. Adoption assesses delivery staff and setting variables (e.g., staff/setting characteristics and intervention adoption rate). Implementation assesses intervention fidelity and resources (i.e., cost and time). The maintenance dimension assesses both individual-level behavior change and organizational/setting-level inter-vention sustainability [1]. Accurate reporting of these dimensions enhances replication and generalizability of interventions [1]. Notably, RE-AIM includes a hy-phen to differentiate the individual-level factors of reach and effectiveness from the organizational-level factors of adoption and implementation [4]. Mainten-ance is captured in both individual and organizational levels. Lastly, the constitutive definition of adoption includes both staff- and setting-level indicators.
The RE-AIM framework has been used to systematic-ally review certain bodies of literature in order to make recommendations that would improve the likelihood of interventions rapidly translating from research to prac-tice [5–8]. RE-AIM has also been used in a variety of settings such as clinics [9–11], schools [12, 13], and communities [14–16]. Furthermore, RE-AIM has been used for the planning, implementation, and evaluation of various health behavior interventions such as diabetes self-management [17, 18], weight loss interventions [19], and smoking cessation programs [20, 21]. Gaglio, Shoup, and Glasgow [22] recently completed a systematic re-view of studies that was based on the RE-AIM frame-work and found that approximately two thirds reported on all five RE-AIM dimensions. They also found that RE-AIM dimensions were not consistently operational-ized and, in some cases, authors incorrectly identified and reported data for a given dimension (e.g., reported reach data as adoption [22]).
Many reviews have been conducted documenting the use of RE-AIM including small, defined bodies of litera-ture [4, 23], broad bodies of literalitera-ture [3, 24], and grant proposals [25]. To date, these reviews have primarily reported on the proportion of studies reporting on the various RE-AIM dimensions. In brief, these studies [5–8, 23] concluded that insufficient reporting of in-formation leads to a dearth of inin-formation related to
for whom, under what conditions, and how behavioral in-terventions are successful. Given that the Gaglio et al. review [22] identified 44 studies that reported on all RE-AIM dimensions, there is now a critical mass of articles that would allow the assessment of typically reported reach, effectiveness, adoption, implementation, and main-tenance across studies.
Therefore, the purpose of this systematic review was to determine comparative results across accurately re-ported RE-AIM indicators, and, ultimately, to propose ways to use these findings to inform behavioral interven-tion work. A secondary purpose was to provide informa-tion on areas where there remains under-reporting or misclassification of data across RE-AIM dimensions. Ex-ploratory aims included determining the degree to which authors intervened to improve outcomes related to each dimension as well as the number of articles reporting RE-AIM dimensions for a given study.
Methods
In April 2013, a systematic literature review was com-pleted in PubMed, PSYCHInfo, EbscoHost, Web of Science, and Scopus. The search terms were AIM, RE-AIM framework, RE-RE-AIM model, and RE-RE-AIM methods. The date ranges were from 1999 (corresponding to the re-lease of the seminal RE-AIM paper [1]) to April 2013. The study is not registered. To be included in the review, arti-cles were published in English and stated the use of any of the five RE-AIM dimensions. A manuscript was excluded if categorized as a: review, commentary, theoretical paper, published abstract, dissertation, book chapter, editorial, or if it did not report on the use of RE-AIM for planning or evaluation of a study, program, or policy. Therefore, only interventions with empirical or evaluative data within the RE-AIM framework were included.
Based on the eligibility criteria (see Additional file 1 for details), three authors conducted title elimination, followed by abstract elimination. All eligible articles were assigned to pairs of investigators to independently code. Pairs of coders met to resolve discrepancies and reach consensus. The research team met for monthly progress updates and to resolve discrepancies. To determine inter-rater reliability, all members of the research team initially coded four articles. Inter-rater reliability is rep-resented as a proportion in this manuscript.
Data extraction
The research team consisted of scientists who previously conducted RE-AIM coding and those who had not. Each novice coder was paired with a veteran coder across all studies. Novice coders attended a training session con-ducted by the experienced RE-AIM investigators to ensure fidelity to the operational definitions of the ex-traction tool. Using an adapted exex-traction tool [22, 23]
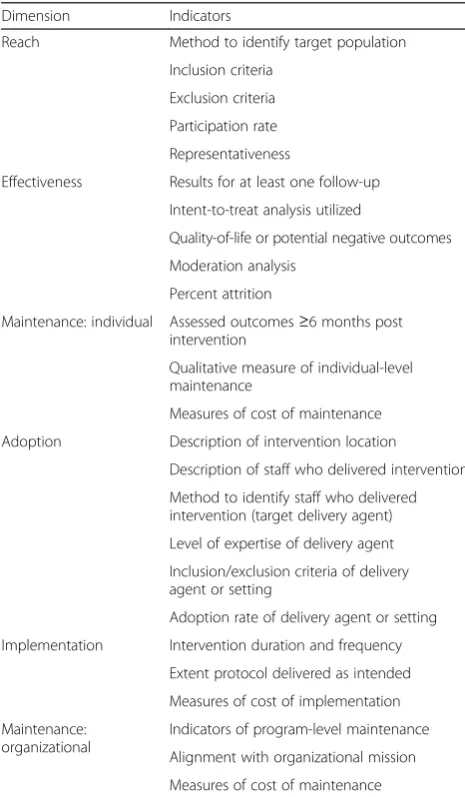
(see Additional file 2), the research team gathered mul-tiple data points based on the indicators listed in Table 1. A RE-AIM abstraction tool was used rather than risk of bias assessments (i.e., those that focus primarily on randomization sequences, allocation concealment, blind-ing, and attrition) to ensure that the study in this manu-script reported balanced information on both internal and external validities.
Data were gathered on the degree to which authors re-ported across indicators for each dimension. For dimen-sions that had reported indicators, outcome data were also captured. All data from articles related to a single study were combined across RE-AIM dimensions. If an indicator was misreported in one study, but appropri-ately addressed in another, the intervention was coded as appropriately addressing that particular indicator (this was rarely the case (n =3 instances)).
Data analysis RE-AIM reporting
The findings are reported primarily as proportions and averages across studies. For reach, participation rate was calculated based on the number of participants divided by the number of members of the target population who were exposed to recruitment activities. Representative-ness was assessed by describing the number of compari-sons made, and differences, between the study sample and the target population or those that were eligible and declined participation. Effectiveness and individual-level maintenance outcomes were summarized based on the results of the reporting as compared to the hypothesized direction. That is, the results were coded as positive if the change to the primary outcome was in the hypothe-sized direction, null if there was no change from base-line, and negative if the intervention had a contrary impact on the targeted behavioral outcome (e.g., de-creased physical activity, and inde-creased rates of partici-pants with high blood pressure).
Adoption rates were determined by dividing the num-ber of staff/settings agreeing to deliver the intervention by the number of staff/settings that were invited to par-ticipate. Representativeness for adoption was analyzed by the number of comparisons made, and differences, between the staff/settings that agreed to participate and the staff/settings that were eligible but declined. The degree to which the intervention was implemented as intended was determined by dividing the number of intervention strategies that were implemented by the total number that were planned. A proportion calcula-tion was to describe the number of intervencalcula-tions that reported making adaptations. Staff/setting-level main-tenance was assessed as the proportion of staff/settings that were able to sustain the intervention over time. Finally, because providing cost and qualitative informa-tion across the RE-AIM dimensions has been en-couraged, we also provide descriptions when these data were reported.
RE-AIM fidelity
For the secondary purpose, the proportion calculations were conducted across each dimension to determine the proportion of articles that reported on a particular indi-cator. If data related to a particular indicator were cap-tured in the extraction tool, descriptive statistics were provided. At least two interventions reporting on a given indicator were required to be included in summary cal-culations. Therefore, if any targeted behavioral outcome (e.g., disease self-management and diet) had less than two interventions reporting on a particular item, the cell would display not applicable (N/A) within the results. Data were collected, analyzed, and synthesized until January 2015.
Table 1RE-AIM indicators by dimension
Dimension Indicators
Reach Method to identify target population
Inclusion criteria
Exclusion criteria
Participation rate
Representativeness
Effectiveness Results for at least one follow-up
Intent-to-treat analysis utilized
Quality-of-life or potential negative outcomes
Moderation analysis
Percent attrition
Maintenance: individual Assessed outcomes≥6 months post intervention
Qualitative measure of individual-level maintenance
Measures of cost of maintenance
Adoption Description of intervention location
Description of staff who delivered intervention
Method to identify staff who delivered intervention (target delivery agent)
Level of expertise of delivery agent
Inclusion/exclusion criteria of delivery agent or setting
Adoption rate of delivery agent or setting
Implementation Intervention duration and frequency
Extent protocol delivered as intended
Measures of cost of implementation
Maintenance: organizational
Indicators of program-level maintenance
Alignment with organizational mission
Measures of cost of maintenance
Results Search
The original search yielded 241 potentially eligible arti-cles. After title and abstract review, 107 articles were fully reviewed for potential inclusion and 37 were ex-cluded. See Fig. 1 for more details. Thirty-one additional articles were referenced in eligible articles and coded as companion documents. These eligible papers (N= 101) represented 82 unique intervention studies for inclusion in this review. Notably, some of the original full articles assessed were based on the same intervention (i.e., com-panions to each other). For the remainder of the manu-script, a compilation of studies is referred to as a“trial.” See Additional file 3 for the PRISMA checklist.
Overall summary
Inter-rater reliability was 76 % across the first four arti-cles coded by all reviewers. The reviewers met to clarify operational definitions of codes. Across the remaining
97 articles (and 163 collected variables for each article), inter-rater reliability was over 80 %. All discrepancies were resolved.
For those trials that were represented across multiple articles (n= 12), there were an average of 2.58 (±1.24) with a range (R) of 2–6 articles. There was a significant difference (p= 0.02) in the average number of reported indicators between multiple-paper interventions (7.9 ± 3.8 indicators) and one-paper interventions (5.78 ± 2.8 indicators).
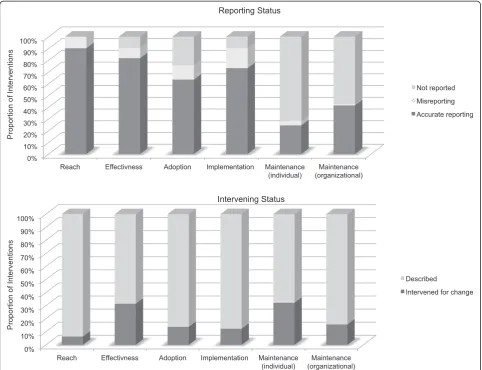
Figure 2 describes (1) whether the dimension was in-cluded in the trial (i.e., reported or not reported) as well as misreported (i.e., misidentification of indicators) and (2) if the dimension was included, did the research de-sign intervene for improved outcomes related to the said dimension or was it described for context. Related to the latter, some trials provided information describing infor-mation on a particular dimension, but the research de-sign did not include methods to improve that particular
Fig. 1Results of literature search. PRISMA representation of search strategy and results
dimension. For example, an author might describe that they approached five eligible schools to deliver an inter-vention (adoption), but there might not be strategies or evaluation regarding the increased uptake of the inter-vention at all five eligible schools. Whereas an interven-tion that aimed to improve the adopinterven-tion rate at the school-level would include data on these efforts (e.g., at-tendance at relevant school meetings, identifying pro-gram champions, and provision of incentives). The most accurately reported dimension was reach (89 %), yet it was the dimension least intervened to improve (3 % of the time). All misreporting related to misidentification of individual-level variables (i.e., those that relate to the end-users) and setting-level variables.
Fifty-three percent of the trials were tested using ran-domized controlled trial design, 17 % were evaluation studies, 9 % were quasi-experimental, 8 % were transla-tional/dissemination studies, 4 % were pre/post design, 3 % were cross-sectional, and 6 % were others (e.g., design
included cross-sectional and observational methods). Sixty-nine percent of the studies used a quantitative methodology, 30 % were mixed methods, and one study used a qualitative approach only. Fifty-seven percent of the studies reported on the individual-level, 26 % were both at the individual- and setting-level, 14 % were at the setting-level, and 2 % accounted for individuals clustered within a setting (i.e., athletes on a team and church mem-bers within a congregation). Twenty-six trials (32 %) tar-geted two or more behavioral outcomes (e.g., dietary improvements and physical activity participation) and were operationalized as “multiple behavioral outcomes.” The remaining studies targeted smoking/substance abuse (15 %), physical activity (10 %), disease self-management (5 %), diet (5 %), weight (2 %), and other (12 %) or had no targeted individual behavioral outcome (19 %). The trials were conducted in the United States (70 %), Australia, (7 %), the Netherlands (7 %), Germany (4 %), Finland 3 %), Canada (4 %), Belgium (3 %), and one trial was
Fig. 2Accuracy of reporting and intervening status by dimension. This illustrates the proportion of interventions that accurately reported, misreported, or did not report on each dimension as well as the proportion of interventions that intervened to improve each dimension
conducted in both the United States and Australia. The text of this manuscript refers to the 82 trials (all articles included in the study (N= 101) which are summarized in Additional file 4).
RE-AIM dimensions
The results section for each dimension describes study reporting across indicators, the outcomes that were re-ported, and any qualitative or cost information that was provided. Table 2 details the constitutive definition of the RE-AIM framework, while the text below provides information on each collected indicator (i.e., full employ-ment of RE-AIM).
Individual-level outcomes Reach
Overall, 17 % of the trials reported on all four indicators of reach (see Table 2). Those that reported a method to identify the target population (n= 50) used existing re-cords (e.g., medical and registry). Sixty-eight percent of the trials reported at least one eligibility criterion, and of those, 25 explicitly stated exclusion criteria. These eligi-bility criteria were typically related to: age (n= 37), membership (n= 33; e.g., church and school), physical or mental condition (n= 14), language (n= 14), tobacco use (n= 11), location (n= 9), activity level (n= 9), access to phone (n= 4), and others (n= 3: gender, lost job, and completed screening). The participation rate was accur-ately reported for 55 % of the trials, 10 % of the trials misreported participation rates, and one trial accurately reported reach in some articles but not others.
The median number of participants was 320 (mean (M) = 4817 (±28,656); R28–234,442). The trials that ac-curately reported on the participation rate were able to reach 45 % (±28) of eligible and invited individuals, with a range from 2 to 100 %. Thirty-seven trials (48 %) re-ported on representativeness. The number of character-istics compared ranged from 1 to 13 with a mean of 3.90 (±3.30). Of those that examined representativeness, 17 (46 %) found at least one significant difference between those that participated and the target population; the most common characteristics were that participants in these behavioral trials were more often of Caucasian race (n= 5), of higher income (n= 3), and of higher education (n= 2). There were also seven studies that found signifi-cant differences in age between participants and non-participants; some were older than the target audience (n= 4) and others were younger than the target audience (n= 3). All other characteristic comparisons were only reported as a significant difference in one trial (e.g., pro-fession, comorbidities, and English language).
Four trials (9 %) included qualitative data to address reach. One telephone interview protocol evaluated the reach of program awareness, in which they found that
35 % of eligible residents responding were aware of the program [26]. In a hospital worksite obesity prevention trial [27, 28], researchers captured open-ended responses for the reasons eligible persons declined participation and found reasons to include lack of interest (56 %), no time (19 %), and personal health or family obligations (2 %) while 22 % gave no reason. For one trial, inter-viewees from ten focus groups described barriers and facilitators of participation in a worksite smoking cessa-tion intervencessa-tion [29, 30]. Respondents provided data re-lated to the recruitment methods to which they were exposed and reported that better marketing, supervisor encouragement, weekly bulletins, and announcements at worksite meetings would increase participation [29, 30]. Four trials also reported on the costs of recruitment. Of those, three reported numerical values (R$10–252.54 per participant [31–40]), while one study reported information that could be used to determine recruitment costs (e.g., the costs associated with interactive voice response system that made 40,185 calls across 3695 individuals [41]).
Effectiveness
One trial [42–45] accurately reported on all five indica-tors within this dimension. Of those that accurately re-ported effectiveness on individual behavior outcomes (n= 55), 89 % had positive findings on the behavioral outcome and 11 % had null findings. These results are presented by targeted outcome in Table 2.
Twenty-five percent of the trials (n= 19) included a moderation analysis to determine robustness across sub-groups. Eleven trials (14 %) reported broader outcomes, QOL, or unintended negative outcomes. Some measures included the Centers for Disease Control and Preven-tion’s Healthy Days measure [46], Patient Health Ques-tionnaire (PHQ) [46, 47], and Problem Areas in Diabetes 2 (PAID-2) scale [47]. Five trials used qualitative mea-sures of effectiveness; three of which used open-ended survey items and two conducted interviews. Twenty-one trials reported attrition rates (M= 22 %). Qualitative data related to effectiveness primarily focused on participant experiences [29, 30, 41, 42, 48, 49] and suggested that program adaptations for specific sub-populations could improve participant perceptions of effectiveness [47]. Only three trials reported any measure of the costs asso-ciated with effectiveness: two reported costs per partici-pant ($4634 and $1295 [33–40]) and the other one reported that costs were considered in the design and analysis [51].
Individual-level maintenance
None of the studies reported on all three indicators of individual-level maintenance. However, nine trials (11 %) reported individual-level behavior change at least 6 months post-treatment. All nine reported positive outcomes when
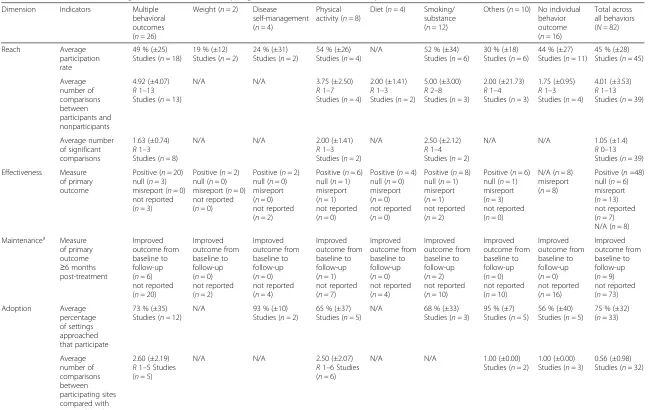
Table 2Individual- and staff/setting-level RE-AIM dimensions by targeted behavioral outcome summary table
Dimension Indicators Multiple
behavioral outcomes (n= 26)
Weight (n= 2) Disease self-management (n= 4)
Physical activity (n= 8)
Diet (n= 4) Smoking/
substance (n= 12)
Others (n= 10) No individual behavior outcome (n= 16)
Total across all behaviors (N =82)
Reach Average
participation rate
49 % (±25) Studies (n= 18)
19 % (±12) Studies (n= 2)
24 % (±31) Studies (n= 2)
54 % (±26) Studies (n= 4)
N/A 52 % (±34)
Studies (n= 6)
30 % (±18) Studies (n= 6)
44 % (±27) Studies (n= 11)
45 % (±28) Studies (n= 45)
Average number of comparisons between participants and nonparticipants 4.92 (±4.07) R1–13 Studies (n =13)
N/A N/A 3.75 (±2.50)
R1–7 Studies (n =4)
2.00 (±1.41) R1–3 Studies (n =2)
5.00 (±3.00) R2–8 Studies (n =3)
2.00 (±21.73) R1–4 Studies (n =3)
1.75 (±0.95) R1–3 Studies (n =4)
4.01 (±3.53) R1–13 Studies (n= 39)
Average number of significant comparisons
1.63 (±0.74) R1–3 Studies (n =8)
N/A N/A 2.00 (±1.41)
R1–3 Studies (n =2)
N/A 2.50 (±2.12)
R1–4 Studies (n =2)
N/A N/A 1.05 (±1.4)
R0–13 Studies (n= 39)
Effectiveness Measure
of primary outcome
Positive (n= 20) null (n= 3) misreport (n= 0) not reported (n= 3)
Positive (n= 2) null (n= 0) misreport (n= 0) not reported (n= 0)
Positive (n= 2) null (n= 0) misreport (n= 0) not reported (n= 2)
Positive (n= 6) null (n= 1) misreport (n= 1) not reported (n= 0)
Positive (n= 4) null (n= 0) misreport (n= 0) not reported (n= 0)
Positive (n= 8) null (n= 1) misreport (n= 1) not reported (n= 2)
Positive (n= 6) null (n= 1) misreport (n= 3) not reported (n= 0)
N/A (n= 8) misreport (n= 8)
Positive (n=48) null (n= 6) misreport (n= 13) not reported (n= 7) N/A (n= 8)
Maintenancea Measure
of primary outcome ≥6 months post-treatment
Improved outcome from baseline to follow-up (n= 6) not reported (n= 20)
Improved outcome from baseline to follow-up (n= 0) not reported (n= 2)
Improved outcome from baseline to follow-up (n= 0) not reported (n= 4)
Improved outcome from baseline to follow-up (n= 1) not reported (n= 7)
Improved outcome from baseline to follow-up (n= 0) not reported (n= 4)
Improved outcome from baseline to follow-up (n= 2) not reported (n= 10)
Improved outcome from baseline to follow-up (n= 0) not reported (n= 10)
Improved outcome from baseline to follow-up (n= 0) not reported (n= 16)
Improved outcome from baseline to follow-up (n= 9) not reported (n= 73)
Adoption Average
percentage of settings approached that participate
73 % (±35) Studies (n =12)
N/A 93 % (±10)
Studies (n =2)
65 % (±37) Studies (n =5)
N/A 68 % (±33)
Studies (n =3)
95 % (±7) Studies (n =5)
56 % (±40) Studies (n =5)
75 % (±32) (n= 33)
Average number of comparisons between participating sites compared with nonparticipating 2.60 (±2.19) R1–5 Studies (n= 5)
N/A N/A 2.50 (±2.07)
R1–6 Studies (n= 6)
N/A N/A 1.00 (±0.00)
Studies (n= 2)
1.00 (±0.00) Studies (n= 3)
0.56 (±0.98) Studies (n= 32)
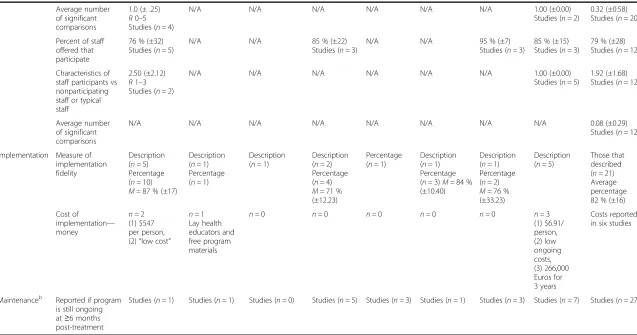
Table 2Individual- and staff/setting-level RE-AIM dimensions by targeted behavioral outcome summary table(Continued)
Average number of significant comparisons
1.0 (± .25) R0–5 Studies (n= 4)
N/A N/A N/A N/A N/A N/A 1.00 (±0.00)
Studies (n= 2)
0.32 (±0.58) Studies (n= 20)
Percent of staff offered that participate
76 % (±32) Studies (n =5)
N/A N/A 85 % (±22)
Studies (n =3)
N/A N/A 95 % (±7)
Studies (n =3)
85 % (±15) Studies (n =3)
79 % (±28) Studies (n= 12)
Characteristics of staff participants vs nonparticipating staff or typical staff
2.50 (±2.12) R1–3 Studies (n= 2)
N/A N/A N/A N/A N/A N/A 1.00 (±0.00)
Studies (n= 5)
1.92 (±1.68) Studies (n= 12)
Average number of significant comparisons
N/A N/A N/A N/A N/A N/A N/A N/A 0.08 (±0.29)
Studies (n= 12)
Implementation Measure of implementation fidelity
Description (n =5) Percentage (n =10) M =87 % (±17)
Description (n =1) Percentage (n =1)
Description (n =1)
Description (n =2) Percentage (n =4) M =71 % (±12.23)
Percentage (n =1)
Description (n =1) Percentage (n =3)M =84 % (±10.40)
Description (n =1) Percentage (n =2) M =76 % (±33.23)
Description (n =5)
Those that described (n =21) Average percentage 82 % (±16)
Cost of
implementation— money
n =2 (1) $547 per person, (2)“low cost”
n =1 Lay health educators and free program materials
n =0 n =0 n =0 n =0 n =0 n =3
(1) $6.91/ person, (2) low ongoing costs, (3) 266,000 Euros for 3 years
Costs reported in six studies
Maintenanceb Reported if program is still ongoing at≥6 months post-treatment
Studies (n =1) Studies (n =1) Studies (n =0) Studies (n =5) Studies (n =3) Studies (n =1) Studies (n =3) Studies (n =7) Studies (n =27)
N/ANot applicable
a
Organizational
b
Individual
Harden
et
al.
Systematic
Reviews
(2015) 4:155
Page
8
of
compared to baseline. One study included qualitative interviews through which participants indicated the need for stronger volunteer and staff support to bol-ster individual-level maintenance [52]. None of the studies reported individual-level maintenance costs.
Setting-level outcomes Adoption
One trial, across two studies [31, 32], reported on all six indicators of adoption. Sixty-three percent of the trials (n= 52) reported on both staff- and setting-level adoption factors. Forty percent of the trials reported setting-level adoption rates, which was, on average, 75 % (±32). Fifteen of the trials (19 %) reported setting-level eligibility criteria; these criteria included size, location, demonstration of need, and being within a particular health insurance net-work. Twenty trials (26 %) compared the characteristics of participating settings to all targeted settings. Five trials found significantly different characteristics, which included: single-physician practices being less likely to participate, governmental sector being more likely to participate, and those who had an increase in the number of patients/re-spondents over time were more likely to participate.
The average staff-level adoption rate was 79 % (±28). Sixteen studies (20 %) reported delivery agent eligibility (i.e., criteria that enables an individual to deliver the inter-vention (e.g., education and role within the system)). These criteria were usually based on expertise (n= 6), af-filiation with targeted setting (n= 4), and other disparate criteria such as not planning on retiring or having enough patients. Ten trials (12 %) compared the characteristics of participating settings to all targeted settings (M= 1.30 comparisons (±0.9); R =1–4). Only one study found sig-nificant comparisons of participating staff to eligible staff. In this case, the delivery staff was more likely to be women and reported more years of experience in physical activity program delivery [26]. All setting and staff indicators can be found in Table 2.
Thirteen studies used qualitative measures for adop-tion and found that adopadop-tion rates were improved through partnerships and increased awareness. For ex-ample, Vick et al. [53] found that the lack of awareness, combined with scheduling conflicts, decreased the likeli-hood of staff attending training; whereas partnering with representatives within the organization led to strategic, feasible, and well-accepted training sessions and inter-vention [54]. Only two studies reported monetary values associated with adoption. One reported a total adoption cost of $21,134 [35–40] while the other indicated $15 per hour to train coaches [55].
Implementation
One study reported all three implementation indicators [21]. Thirty-five trials (44 %) reported on the degree to
which the program was delivered as intended. Across all targeted outcomes, the average percent fidelity was 81 % (±16.49). Seventeen trials (22 %) reported that adapta-tions were made to program delivery. Thirty trials (39 %) provided information on the number and frequency of trial contacts, which represented the resource of“time.” Eighteen of the trials (24 %) used qualitative inquiry for implementation: surveys (n= 7), interviews (n= 6), obser-vations and interviews (n= 2), focus groups (n= 2), and an implementation checklist (n= 1). Qualitative inquiry iden-tified barriers and facilitators of implementation. Example barriers included scheduling and staff turnover [56] as well as a lack of role clarity (i.e., understanding ones re-sponsibilities related to the intervention) [57] while suc-cesses were attributed to increased patient trust of care providers [49] and multilevel commitment (e.g., manage-ment and investmanage-ment of partnerships [57]). Eight percent of the trials (n= 6) reported at least some data around im-plementation monetary costs (e.g., program updates and manuals) but did not include raw data on costs.
Organizational-level maintenance
None of the studies reported on all three indicators within maintenance. Eleven of the trials (13 %) reported align-ment with an organizational mission. Twenty-eight of the trials (34 %) reported on whether or not the program was still in place. Of those that reported on institutionalization of the program, 16 (62 %) were still in place. Eleven trials (13 %) included information on modifications that were made for system-level maintenance. Seven trials reported on organizational attrition (M= 9.82 % (±10.55)). Finally, 15 % reported qualitative measures of maintenance via in-terviews (n= 10) and open-ended surveys (n= 2). These data indicated compatibility with their delivery system and delivery agent skill set as well as a wide array of themes from ongoing staff and management support (support of duration, frequency, and type of trial). No salient barriers were identified via the interviews and open-ended surveys. No data were reported on costs of organizational-level maintenance.
Discussion
The purpose of this review was to move beyond an as-sessment of the adequacy of reporting across the dimen-sions of the RE-AIM framework to include outcome data related to each dimension. A number of conclu-sions are made from this review to provide directions for future research.
First, at the individual-level, participation rates were varied across behavioral target. Regardless of sample size, though, the vast majority of trials had a positive im-pact on effectiveness. Studies testing interventions tar-geting multiple behavioral outcomes appear to attract participants at a higher rate than those that focus on
weight management. For example, there were 234,442 participants in a statewide evaluation of school-aged youth’s physical activity and dietary behaviors [58]. Similarly, a targeted weight management and physical activity trial had 1952 participants [59]. However, the study with only 28 participants [56] was a specific al-cohol referral program. Reasons for these differences in sample sizes are also connected to setting-level fac-tors (e.g., state-, school-, community-, or clinic-wide interventions versus pilot testing) and demonstrate the need to scale interventions to have a broad public health impact.
Second, over half of the studies that report on repre-sentativeness found that their sample was generalizable to the target population. Thirty-nine studies included a comparison between the recruited participants and the target audience. One study [60] found that participants were significantly more likely to be Caucasian and older than the target audience. In contrast, other researchers found that participants in a diabetes prevention program for older adults were younger than the target audience [61, 62]. In general, those that found their samples were less representative, the typical differences included an over representation of Caucasians and those with higher income and education levels. In an effort to move toward health equity [63], researchers need to be persist-ent in targeting and recruiting participants from minor-ity communities, those of low income, and those of lower education.
Third, adoption and implementation rates were rela-tively high for settings and staff that agree to deliver a given intervention, though data on representativeness at these levels were scarce. This may indicate that studies with more positive results were more likely to include these fidelity calculations in their articles. There is a gap in the literature related to personal characteristics and perceptions of the intervention from those who deliver interventions [64]. That is, the expertise reported often alluded to “trained” delivery agents without providing details about how a“trained” delivery agent was defined. Many studies reported some degree of intervention fidel-ity, although very few reported an actual percentage of intervention content that was delivered as intended. Only one study included an implementation checklist to systematically document the delivery of intervention components [49]. This lack of data related to staff/set-ting-level factors may hinder intervention adoption and sustainability.
Fourth, the majority of trials that employ the RE-AIM framework test interventions that target effectiveness (~60 %) and very few target reach or organizational maintenance (~5 % each). While the RE-AIM framework was developed to address outcomes across each dimen-sion, there were relatively few studies that examine reach
or staff/setting-level dimensions as the target for inter-vention. A key principle from the RE-AIM perspective is that a public health impact can be improved by maximizing outcomes for each dimension [1]. Future work on RE-AIM would benefit from interventions that systematically plan to test ways to improve reach, adoption, implementation, and setting-level mainten-ance. To do this, researchers must plan intervention design, delivery, and evaluation with the real-world application in mind. In fact, the Behavior Change Con-sortium developed a systematic way in which to ac-complish this [63]. Essentially, interventionists can use the indicators (as seen in Table 1) to develop, deliver, and evaluate an intervention. By addressing these complex issues in the planning stages, researchers can more readily understand the potential public health impact of a pro-posed intervention [3].
Fifth, our results provide information on areas where there remains under-reporting or misclassification of data across RE-AIM dimensions. Authors often reported an inaccurate denominator within the dimensions of reach and adoption. That is, within reach and adoption, “those who decline” or “were unable to be contacted” should not be categorized as ineligible by default. For these reasons, we suggest using multiple indicators to accurately communicate the number, proportion, and representativeness of participants, settings, and staff [65]. Cost was also rarely and inconsistently reported. Consist-ent reporting of reach and adoption would further the field of implementation science in that it would highlight the types of people and settings that are not being re-cruited into interventions and lead to a concerted effort to improve these rates by tailoring intervention materials and approaches.
We also found that some reports of indicators were more vague (e.g., cost and quality of life) than others, making it difficult to discern comparisons across tar-geted behavioral outcomes. However, we recognize that there are often practical limitations (with word and space limitations of journals) to thoroughly include all indicators related to each dimension. For this reason, we suggest (1) reporting dimensions across multiple papers, as needed, and (2) using tabular representations with headers such as “Dimension, Outcome, Measures, and Results” to be clear and consistent. Notably, related to our exploratory aim of determining the number of arti-cles used by authors to report across RE-AIM dimen-sions, only 12 of the trials were reported across multiple papers, and those trials that were reported across mul-tiple papers included more RE-AIM indicators than trials reported in a single manuscript. This provides pre-liminary support for reporting dimensions across mul-tiple papers when a full RE-AIM analysis is not feasible for the targeted journal.
As this was the first study to provide preliminary evi-dence related to comparative results across each dimension, there was notable variation across both the degree to which indicators were included and our ability to make specific in-ferences. That is, there were not enough studies that accur-ately reported data to categorize low, moderate, and high reach, adoption, implementation, and maintenance rates. However, we presented comparative results where possible as well as provided salient reporting issues and suggestions for improvements. Secondly, the present study does not evaluate variation in operational definitions of the indica-tors posed by the authors of the trials. Notably, the RE-AIM indicators remain the same regardless of intervention type, target audience, settings, etc. We included informa-tion on interveninforma-tion type, evaluainforma-tion metrics, level of evalu-ation (e.g., individual and setting), and the degree to which interventions intervened to improve a particular dimension. For consistency, trained coders reported indicators as“ ac-curate,” “misreported,” or “not reported” according to the constitutive definitions of RE-AIM [2].
Conclusions
The RE-AIM framework has been employed in a variety of populations and settings and for the planning, delivery, and evaluation of behavioral interventions. The RE-AIM framework was developed to place equal importance on all five dimensions of interest in order to translate behavioral interventions into sustained practice and have a large pub-lic health impact [1]. Yet, this review highlights that there are still inconsistencies in the degree to which authors are reporting each dimension in its entirety as well as inaccur-acies in reporting indicators within each dimension. Fur-ther, there are few interventions that aim to improve outcomes related to reach, adoption, implementation, and maintenance. Taken together, this review points to a pipe-line for future research: increased accuracy and transpar-ency across all five dimensions to enhance replication, generalizability, and translation as well as the need to inter-vene to improve outcomes within each dimension.
Additional files
Additional file 1: Eligibility criteria.This table presents the eligibility criteria for the systematic review. (PDF 76 kb)
Additional file 2: Data extraction tool.This table reflects the data extraction tool with each of the RE-AIM indicators and their operationaldefinitions for coders. (PDF 113 kb)
Additional file 3: PRISMA checklist.This file adheres to the Preferred Reporting Items for Systematic Reviews and Meta-Analyses(PRISMA) checklist to improve transparency of the methods and results of this systematic review. (PDF 116 kb)
Additional file 4: Summary of all articles included in the review. As manuscripts were grouped together to reflect interventions, this table provides summary data on all individual articles included in the review. (PDF 417 kb)
Abbreviations
PHQ:Patient Health Questionnaire; QOL: quality of Life.
Competing interests
No authors have a competing interest to disclose.
Authors’contributions
SMH conceived the study design, adapted the coding sheet, contributed to data extraction, oversaw data reconciliation, and developed the first draft of the manuscript. BG and JAS contributed to data acquisition and
interpretation and made significant contributions to the manuscript. KAK, SBJ, FB, KCA, JMZ, JLH, and FAA contributed to data acquisition and interpretation. REG contributed to the study design, data interpretation, and the content of the manuscript. PAE conceived of the study design, contributed to data extraction, and provided significant contributions to the manuscript and process. All authors read and approved the final manuscript.
Acknowledgements
The authors have not received funding for this work.
Disclaimer
All statements in this report, including its findings and conclusions, are solely those of the authors and do not necessarily represent the views of the Patient-Centered Outcomes Research Institute (PCORI), its Board of Governors, or Methodology Committee.
Author details
1
Human Nutrition, Foods and Exercise, Virginia Tech, Blacksburg, VA 24060, USA.2Communication and Dissemination Research, Patient-Centered Outcomes Research Institute, Washington, DC 20036, USA.3School of Public Affairs, University of Colorado, Denver, CO 80204, USA.4Institute for Health Research, Kaiser Permanente Colorado, Denver, Colorado, US.5Department of Preventive Medicine, Keck School of Medicine, University of Southern California, Los Angeles, CA 90033, USA.6Family and Community Medicine, Carilion Clinic, Roanoke, VA 24016, USA.7Family Medicine, University of Colorado School of Medicine, Aurora, CO 80045, USA.
Received: 20 April 2015 Accepted: 23 October 2015
References
1. Glasgow RE, Vogt TM, Boles SM. Evaluating the public health impact of health promotion interventions: the RE-AIM framework. Am J Public Health. 1999. doi:10.2105/AJPH.89.9.1322.
2. www.RE-AIM.org. Accessed 20 April 2015.
3. Wells M, Willaims B, Treweek S, Coyle J, Taylor J. Intervention description is not enough: evidence from an in-depth multiple case study on the untold role and impact of context in randomized controlled trials of seven complex intervention. Trials. 2012. doi:10.1186/1745-6215-13-95 4. Gaglio B, Glasgow RE. Evaluation approaches for dissemination and
implementation research. In: Brownson R, Colditz G, Proctor E, editors. Dissemination and implementation research in health. 1st ed. New York: Oxford University Press; 2012. p. 327.
5. Akers JD, Estabrooks PA, Davy BM. Translational research: bridging the gap between long-term weight loss maintenance research and practice. J Am Diet Assoc. 2010. doi:10.1016/j.jada.2010.07.005
6. Allen K, Zoellner J, Motley M, Estabrooks PA. Understanding the internal and external validity of health literacy interventions: a systematic literature review using the RE-AIM framework. J Health Commun. 2011. doi:10.1080/ 10810730.2011.604381
7. Klesges LM, Williams NA, Davis KS, Buscemi J, Kitzmann KM. External validity reporting in behavioral treatment of childhood obesity: a systematic review. Am J Prev Med. 2012;42:185–92.
8. Matthews L, MacMillan F, Kirk A, Mutrie N. Can physical activity interventions for adults with type 2 diabetes be translated into practice settings? A systematic review using the RE-AIM framework. Transl Behav Med. 2014. doi:10.1007/s13142-013-0235-y
9. Bakken S, Ruland CM. Translating clinical informatics interventions into routine clinical care: how can the RE-AIM framework help? J Am Med Inform Assoc. 2009. doi:10.1197/jamia.M3085
10. Glasgow RE, Magid DJ, Beck A, Ritzwoller D, Estabrooks PA. Practical clinical trials for translating research to practice: design and measurement recommendations. Med Care. 2005. doi:10.1097/01.mlr.0000163645.41407.09 11. Li F, Harmer P, Stock R, Fitzgerald K, Stevens J, Gladieux M, et al.
Implementing an evidence-based fall prevention program in an outpatient clinical setting. J Am Geriatr Soc. 2013. doi:10.1111/jgs.12509
12. Dunton GF, Liao Y, Grana R, Lagloire R, Riggs N, Chou CP, et al. State-wide dissemination of a school-based nutrition education programme: a RE-AIM (Reach, Efficacy, Adoption, Implementation, Maintenance) analysis. Public Health Nutr. 2014;17:422–30.
13. Moore L, de Silva-Sanigorski A, Moore SN. A socio-ecological perspective on behavioural interventions to influence food choice in schools: alternative, complementary or synergistic? Public Health Nutr. 2013; doi:10.1017/ S1368980012005605
14. Altpeter M, Gwyther LP, Kennedy SR, Patterson TR, Derence K. From evidence to practice: Using the RE-AIM framework to adapt the REACHII caregiver intervention to the community. Dementia (London). 2015;14:104–13. 15. Estabrooks PA, Bradshaw M, Dzewaltowski DA, Smith-Ray RL. Determining
the impact of Walk Kansas: applying a team-building approach to community physical activity promotion. Ann Behav Med. 2008; doi:10.1007/ s12160-008-9040-0
16. James AS, Richardson V, Wang JS, Proctor EK, Colditz GA. Systems intervention to promote colon cancer screening in safety net settings: protocol for a community-based participatory randomized controlled trial. Implement Sci. 2013; doi:10.1186/1748-5908-8-58
17. Glasgow RE, Strycker LA, Kurz D,Faber A, Bell H, Dickman JM, et al. Recruitment for an internet-based diabetes self-management program: scientific and ethical implications. Ann Behav Med. 2010; doi:10.1007/ s12160-010-9189-1
18. Glasgow RE, Peeples M, Skovlund SE. Where is the patient in diabetes performance measures? The case for including patient-centered and self-management measures. Diabetes Care. 2008; doi:10.2337/dc07-1845 19. Estabrooks PA, Smith-Ray RL. Piloting a behavioral intervention delivered
through interactive voice response telephone messages to promote weight loss in a pre-diabetic population. Patient Educ Couns. 2008; doi:10.1016/ j.pec.2008.01.007
20. Glasgow RE, Whitlock EP, Eakin EG, Lichtenstein E. A brief smoking cessation intervention for women in low-income planned parenthood clinics. Am J Public Health. 2000;90:786–9.
21. Lando HA, Valanis BG, Lichtenstein E, Curry SJ, McBride CM, Pirie PL, et al. Promoting smoking abstinence in pregnant and postpartum patients: a comparison of 2 approaches. Am J Manag Care. 2001;7:685–93. 22. Gaglio B, Shoup JA, Glasgow RE. The RE-AIM framework: a systematic
review of use over time. Am J Public Health. 2013; doi:10.2105/ AJPH.2013.301299.
23. Galaviz KI, Harden SM, Smith E, Blackman KCA, Berrey LM, Mama SK, et al. Physical activity promotion in Latin American populations: a systematic review on issues of internal and external validity. Int J Behav Nutr Phys Act. 2014. doi:10.1186/1479-5868-11-77.
24. Estabrooks PA, Harden SM, Burke SM. Group Dynamics in Physical Activity Promotion: What works? Soc and Personal Psychol Compass. 2012. doi:10.1111/j.1751-9004.2011.00409.x
25. Kessler RS, Purcell EP, Glasgow RE, Klesges LM, Benkeser RM, Peek CJ. What does it mean to“employ”the RE-AIM model? Eval Health Prof. 2013; doi:10.1177/0163278712446066
26. Van Acker R, De Bourdeaudhuij I, De Cocker K, Klesges LM, Cardon G. The impact of disseminating the whole-community project‘10,000 Steps’: a RE-AIM analysis. BMC Public Health. 2011. doi:10.1186/1471-2458-11-3 27. Estabrook B, Zapka J, Lemon SC. Evaluating the implementation of a
hospital work-site obesity prevention intervention: applying the RE-AIM framework. Health Promot Pract. 2012. doi:10.1177/1524839910385897 28. Lemon SC, Zapka J, Li W, Estabrook B, Rosal M, Magner R, et al. Step ahead
a worksite obesity prevention trial among hospital employees. Am J Prev Med. 2010. doi:10.1016/j.amepre.2009.08.028
29. Kim AE, Towers A, Renaud J, Zhu J, Shea JA, Galvin R, et al. Application of the RE-AIM framework to evaluate the impact of a worksite-based financial incentive intervention for smoking cessation. J Occup Environ Med. 2012. doi:10.1097/JOM.0b013e31824b2171
30. Volpp KG, Troxel AB, Pauly MV, Glick HA, Puig A, Asch DA, et al. A randomized, controlled trial of financial incentives for smoking cessation. N Engl J Med. 2009. doi:10.1056/NEJMsa0806819
31. Samuel-Hodge CD, Garcia BA, Johnston LF, Kraschnewski JL, Gustafson AA, Norwood AF, et al. Rationale, design, and sample characteristics of a practical randomized trial to assess a weight loss intervention for low-income women: the Weight-Wise II Program. Contemp Clin Trials. 2012; doi:10.1016/j.cct.2011.08.009
32. Kraschnewski JL, Keyserling TC, Bangdiwala SI, Gizlice Z, Garcia BA, Johnston LF, et al. Optimized probability sampling of study sites to improve generalizability in a multisite intervention trial. Prev Chronic Dis. 2010;7:A10. 33. Toobert DJ, Strycker LA, Glasgow RE, Bagdade JD. If you build it, will they
come? Reach and adoption associated with a comprehensive lifestyle management program for women with type 2 diabetes. Patient Educ Couns. 2002;48:99–105.
34. Toobert DJ, Glasgow RE, Strycker LA, Barrera M Jr, Radcliffe JL, Wander RC, et al. Biologic and quality-of-life outcomes from the Mediterranean Lifestyle Program: a randomized clinical trial. Diabetes Care. 2003; doi:10.1207/ s15324796abm2902_7.
35. Toobert DJ, Strycker LA, Glasgow RE, Barrera Jr M, Angell K. Effects of the mediterranean lifestyle program on multiple risk behaviors and psychosocial outcomes among women at risk for heart disease. Ann Behav Med. 2005; doi:10.1207/s15324796abm2902_7
36. Ritzwoller DP, Toobert D, Sukhanova A, Glasgow RE. Economic analysis of the Mediterranean Lifestyle Program for postmenopausal women with diabetes. Diabetes Educa. 2006; doi:10.1177/0145721706291757.
37. Toobert DJ, Glasgow RE, Strycker LA, Barrera Jr M, Ritzwoller DP, Weidner G. Long-term effects of the Mediterranean lifestyle program: a randomized clinical trial for postmenopausal women with type 2 diabetes. Int J Behav Nutr Phys Act. 2007;4:1.
38. Toobert DJ, Strycker LA, Barrera M, Glasgow RE. Seven-year follow-up of a multiple-health-behavior diabetes intervention. Am J Health Behav. 2010; doi:10.5993/AJHB.34.6.5
39. Toobert DJ, Strycker LA, Glasgow RE, Osuna D, Doty AT, Barrera M, et al. Viva bien!: overcoming recruitment challenges in a multiple-risk-factor diabetes trial. Am J Health Behav. 2010; doi:10.5993/AJHB.34.4.5.
40. Ritzwoller DP, Sukhanova AS, Glasgow RE, Strycker LA, King DK, Gaglio B, et al. Intervention costs and cost-effectiveness for a multiple-risk-factor diabetes self-management trial for Latinas: economic analysis of Viva Bien! Transl Behav Med. 2011; doi:10.1007/s13142-011-0037-z
41. Haas JS, Iyer A, Orav EJ, Schiff GD, Bates DW. Participation in an ambulatory e-pharmacovigilance system. Pharmacoepidemiol Drug Saf. 2010; doi:10.1002/pds.2006
42. Glasgow RE, Strycker LA, Kurz D, Faber A, Bell H, Dickman JM, et al. Recruitment for an internet-based diabetes self-management program: scientific and ethical implications. Ann Behav Med. 2010; doi:10.1007/ s12160-010-9189-1
43. Glasgow RE, Christiansen SM, Kurz D, King DK, Woolley T, Faber AJ, et al. Engagement in a diabetes self-management website: usage patterns and generalizability of program use. J Med Internet Res. 2011; doi:10.2196/ jmir.1391
44. Glasgow RE, Kurz D, King D, Dickman JM, Faber AJ, Halterman E, et al. Outcomes of minimal and moderate support versions of an internet-based diabetes self-management support program. J Gen Internal Med. 2010; doi:10.1007/s11606-010-1480-0
45. Glasgow RE, Kurz D, King D, Dickman JM, Faber AJ, Halterman E, et al. Twelve-month outcomes of an Internet-based diabetes self-management support program. Patient Educ Couns. 2012; doi:10.1016/j.pec.2011.07.024. 46. Holtrop JS, Dosh SA, Torres T, Thum YM. The community health educator referral liaison (CHERL): a primary care practice role for promoting healthy behaviors. Am J Prev Med. 2008; doi:10.1016/j.amepre.2008.08.012. 47. Glasgow RE, Nutting PA, King DK, Nelson CC, Cutter G, Gaglio B, et al. A
practical randomized trial to improve diabetes care. J Gen Intern Med. 2004; doi:10.1111/j.1525-1497.2004.30425.x.
48. Bukhari A, Fredericks L, Wylie-Rosett J. Strategies to promote high school students’healthful food choices. J Nutr Educ Behav. 2011; doi:10.1016/ j.jneb.2011.01.008.
49. Bernstein E, Topp D, Shaw E, Girard C, Pressman K, Woolcock E, et al. A preliminary report of knowledge translation: lessons from taking screening and brief intervention techniques from the research setting into regional systems of care. Acad Emerg Med. 2009; doi:10.1111/j.1553-2712.2009. 00516.x
50. Saunders N, Otago L, Romiti M, Donaldson A, White P, Finch C. Coaches’ perspectives on implementing an evidence-informed injury prevention
programme in junior community netball. Br J Sports Med. 2010; doi:10.1136/bjsm.2009.069039.
51. Belza B, Snyder S, Thompson M, LoGerfo J. From research to practice: EnhanceFitness, an innovative community-based senior exercise program. Topics in Geriatric Rehabilitation. 2010; doi:10.1097/TGR.0b013e3181fee69e. 52. Campbell MK, Resnicow K, Carr C, Wang T, Williams A. Process evaluation of
an effective church-based diet intervention: Body & Soul. Health Educ Behav.2007; doi:10.1177/1090198106292020
53. Vick L, Duffy SA, Ewing LA, Rugen K, Zak C. Implementation of an inpatient smoking cessation programme in a veterans affairs facility. J Clin Nurs. 2013; doi:10.1111/j.1365-2702.2012.04188.x.
54. Gary TL, Hill-Briggs F, Batts-Turner M, Brancati FL. Translational research principles of an effectiveness trial for diabetes care in an urban African American population. Diabetes Educa. 2005; doi:10.1177/0145721705282254. 55. Zoellner JM, Connell CC, Madson MB, Wang B, Reed VB, Molaison EF, et al.
H.U.B city steps: methods and early findings from a community-based participatory research trial to reduce blood pressure among African Americans. Int J Behav Nutr Phys Act. 2011; doi:10.1186/1479-5868-8-59. 56. Broyles LM, Gordon AJ, Rodriguez KL, Hanusa BH, Kengor C, Kraemer KL.
Evaluation of a pilot training program in alcohol screening, brief intervention, and referral to treatment for nurses in inpatient settings. J Addict Nurs. 2013; doi:10.1097/JAN.0b013e31828767ef.
57. McKenzie R, Naccarella L, Thompson C. Innovation in aged care, well for life: evaluation and policy implications of a health promotion initiative for frail older people in aged care settings. Austra J Aging. 2007;26:135–40. 58. Dunton GF, Lagloire R, Robertson T. Using the RE-AIM framework to
evaluate the statewide dissemination of a school-based physical activity and nutrition curriculum:“Exercise Your Options”. Am J Health Promot. 2009; doi:10.4278/ajhp.071211129.
59. Abildso CG, Zizzi SJ, Reger-Nash B. Evaluating an insurance-sponsored weight management program with the RE-AIM Model, West Virginia, 2004–2008. Prev Chronic Dis. 2010;7:A46.
60. Yank V, Stafford RS, Rosas LG, Ma J. Baseline reach and adoption characteristics in a randomized controlled trial of two weight loss interventions translated into primary care: a structured report of real-world applicability. Contemp Clin Trials. 2013; doi:10.1016/j.cct.2012.10.007. 61. West DS, Bursac Z, Cornell CE, Felix HC, Fausett JK, Krukowski RA, et al. Lay
health educators translate a weight-loss intervention in senior centers: a randomized controlled trial. Am J Prev Med. 2011; doi:10.1016/ j.amepre.2011.06.041.
62. Felix HC, Adams B, Fausett JK, Krukowski RA, Prewitt TE, West DS. Calculating reach of evidence-based weight loss and memory improvement interventions among older adults attending Arkansas senior centers, 2008–2011. Prev Chronic Dis. 2012; doi:10.5888/pcd9.110141. 63. Klesges LM, Estabrooks PA, Dzewaltowski DA, Bull SS, Glasgow RE.
Beginning with the application in mind: designing and planning health behavior change interventions to enhance dissemination. Ann Behav Med. 2005; doi:10.1207/s15324796abm2902s_10.
64. Estabrooks P, Bradshaw M, Fox E, Berg J, Dzewaltowski DA. The relationships between delivery agents’physical activity level and the likelihood of implementing a physical activity program. Am J Health Promot. 2004; doi:10.4278/0890-1171-18.5.350.
65. Harden SM, Fanning JT, Motl RW, McAuley E, Estabrooks PA. Determining the reach of a home-based physical activity program for older adults within the context of a randomized controlled trial. Health Educ Res. 2014; doi:10.1093/her/cyu049.
Submit your next manuscript to BioMed Central and take full advantage of:
• Convenient online submission • Thorough peer review
• No space constraints or color figure charges • Immediate publication on acceptance
• Inclusion in PubMed, CAS, Scopus and Google Scholar
• Research which is freely available for redistribution
Submit your manuscript at www.biomedcentral.com/submit