Pharmacophore 2015, Vol. 6 (5), 249-254 USA CODEN: PHARM7 ISSN 2229-5402
Pharmacophore
(An International Research Journal)
Available online at http://www.pharmacophorejournal.com/
Original Research Paper
QUANTITATIVE ESTIMATION OF TAPENTADOL HYDROCHLORIDE IN
HUMAN PLASMA BY HPLC
Sonali Mahaparale
* and Nikita Samuel
Padmashree Dr. D.Y. Patil College of Pharmacy, Akurdi, Pune-411044, Maharashtra, India
ABSTRACT
A simple, rapid, selective, sensitive, accurate and precise High Performance Liquid Chromatography (HPLC) with UV detection method has been developed and validated for determination of Tapentadol hydrochloride in human plasma. The chromatographic separation of Tapentadol hydrochloride was achieved with Chromasil C18 column using a mobile phase Methanol: water (60:40 v/v) at flow rate 1.0 ml/min. Plasma samples were processed using acetonitrile as precipitating agent to extract drug. The linearity for Tapentadol hydrochloride was found to be 100-1000 ng/ml with regression coefficient (r2) 0.9980. The limit of quantification in plasma for Tapentadol hydrochloride was found to be 100 ng/ml. The mean recovery was obtained at 85.20 %. The method has been used to perform pharmacokinetic and bioequivalence studies in human plasma.
Keywords:
Tapentadol hydrochloride, Human plasma, Bioanalytical validation, FDA guidelines, HPLC-UV detection.INTRODUCTION
Tapentadol hydrochloride (TAP) is Opioid analgesic for treatment of moderate to severe pain and centrally acting synthetic analgesic.1,2 Chemically it is 3-[(2R,3R)-1-(dimethylamino)-2-methylpentan-3-yl]phenol.1,2 Its molecular formula and molecular weight are C14H23NO.HCl and 257.80 respectively. Tapentadol hydrochloride is extremely water soluble. It is more stable in acidic medium. Tapentadol hydrochloride is official in Indian Pharmacopoeia.1 Literature survey reveals that many analytical methods such as UV spectrophotometric2-3 and HPLC methods3-7 methods are reported for determination of Tapentadol hydrochloride individually from pharmaceutical dosage form and HPLC8 methods are reported for determination of TAP with other drugs in combined dosage form. HPLC is a powerful tool for analyzing small analytes such as drugs in biological samples. However, analysis of analytes present in matrices such as plasma
requires well designed sample preparation procedures such as protein precipitation, centrifugation, extraction and filtration that can introduce experimental errors and ultimately reduce precision and accuracy of measurement. The aim of this work was to develop a simple, accurate, reproducible and sensitive method for the determination of Tapentadol hydrochloride in human plasma using rapid, convenient and simple reverse phase HPLC method.
MATERIALS AND METHODS
Chemicals and Reagents
Pure sample of Tapentadol hydrochloride was procured from Emcure Pharmaceuticals Ltd., Pune. Methanol (HPLC grade) and Acetonitrile (HPLC grade) were obtained from Qualigen Laboratories Pvt. Ltd., Mumbai.
Instrumentation and Chromatographic
The analysis of Tapentadol hydrochloride was carried out an Agilent 1120 series, which comprised a degasser, binary gradient pump and UV detector. The system was controlled through Ezchrome software using Chromasil C18 (4.6 x 250 mm, 5 μm; Advanced Chromatography Systems, Johns Island, SC) column maintained at 30°C temperature and flow rate of mobile phase 1.0 ml/min. The mobile phase was composed Methanol: water (60:40 v/v). The mobile phase was kept in ultrasonicator for 30 min. and filtered through a 0.22 μm nylon membrane filter. The measurements were made with injection volume 20 μl and UV detection 272.0 nm.
Preparation of Standard Stock Solutions A Standard stock solution of Tapentadol hydrochloride was prepared by dissolving 10 mg drug in HPLC grade methanol in 100 ml volumetric flask to get concentration 100 μg/ml. To prepare working standard solution of TOL was diluted to 1, 2, 4, 6, 8 and 10 μg/ml with methanol.
Protein Precipitation
The blank plasma sample was prepared by adding 1ml of plasma and 1ml acetonitrile and vortex for 2.0 min. Then the solution was centrifuged at 3000 RPM for 10 min. The supernatant liquid was taken and transferred to HPLC vials.
Preparation of Calibration Curve (Cc) Standards and Quality Control Samples
The working standard solutions of TOL with concentrations of 1, 2, 4, 6, 8 and 10 μg/ml was prepared by diluting with methanol. Aliquots of 0.90 ml of blank human plasma were spiked with 100 μl of working standard solutions of 1, 2, 4, 6, 8 and 10 μg/ml to get CC standards containing 100, 200, 400, 600, 800 and 1000 ng/ml of Tapentadol hydrochloride. Similarly the QC samples were prepared to contain three concentrations [100 ng/ml low quality control (LQC), 500 ng/ml middle quality control (MQC) and 1000 ng/ml high quality control (HQC)].
Preparation of Plasma Sample Solution
To 0.90 ml of plasma, 100 μl of Tapentadol hydrochloride standard solutions of 1, 2, 4, 6, 8
and 10 μg/ml, 1.0 ml acetonitrile were added to a glass tubes. Each sample was vortex mixed for 2.0 min and centrifuged (3000 rpm for 10 min). After centrifugation 50 μl aliquots of supernatant of each concentration were injected into the HPLC system.
METHOD VALIDATION
9-11The method was validated in accordance with FDA guidelines
Calibration Plot
The calibration plot for the HPLC method was constructed by analysis of six solutions containing different concentrations of Tapentadol hydrochloride (100, 200, 400, 600, 800 and 1000 ng/ml). In the range 100-1000 ng/ml the data were best fitted by a linear equation y = mx + b, the coefficient of determination (R2) was 0.9980.
Evaluation of Selectivity
This parameter was evaluated at the Lower Limit of Quantification (LLOQ) i.e. 50 ng/ml per ml of plasma. The LLOQ sample was mixed with 100 μl of methanol, analyzed and the drug peak area was noted. Similarly, 1 ml blank plasma was mixed with 100 μl of methanol, analyzed and the detector response for the blank was noted at the retention time of the drug. The blank response was compared with the peak area of the LLOQ sample.
Precision and Accuracy
The intra and inter-day variation of the assay were determined by replicate analysis (n = 6) of three concentrations of TOL [100 ng/ml low quality control (LQC), 500 ng/ml middle quality control (MQC) and 1000 ng/ml high quality control (HQC)] on the same day and at different days, respectively, using the same stock solutions and plasma batches. The percent of relative standard deviations of results of the assay were determined.
Repeatability
The repeatability (intraday precision) of the method was evaluated in triplicate on the same day for three different concentrations performing of Tapentadol hydrochloride.
Recovery from human plasma samples was evaluated in triplicate for each of three concentrations of Tapentadol hydrochloride. The response for each level being compared with that from the corresponding standard solution. The results of recovery was given in (Table 3).
Limit of Detection (LOD) and Limit of Quantitation (LOQ)
The parameters LOD and LOQ were determined using the signal-to-noise ratio by comparing results of the test of samples with known concentrations of analyte to blank samples. The analyte concentration that produced a signal-to noise ratio of 3:1 was accepted as the LOD. The LOQ was identified as the lowest plasma concentration of the standard curve that could be quantified with acceptable accuracy, precision and variability.
Stability
Short term stock stability
A Stock solution of Tapentadol hydrochloride was kept at room temperature for 6 hours.
Long term stock stability
A Stock solution of Tapentadol hydrochloride and was kept at room temperature for 15 days.
Freeze thaw stability
The stability of low and high quality control samples were determined after three freeze thaw cycles.
RESULTS AND DISCUSSION
The method was validated in terms of limit of quantification, Recovery, Selectivity, Precision, accuracy and stability.
Linearity
The linearity was found to be 100-1000 ng/ml.
Sensitivity
In the plasma, limit of quantification was found to be 100 ng/ml for Tapentadol hydrochloride.
Precision and Accuracy
The accuracy, precision and intraday precision were carried out by preparing 6 individual LQC (100 ng/ml), MQC (500 ng/ml), HQC (1000 ng/ml) samples and the percentage of mean and C.V. was calculated (Table 1).
Recovery
The percentage recovery of the drug was found to be 85.20 %. (Table 2)
Stability
Stability of method was carried out by performing short term and long-term stock stability and freeze thaw stability. (Table 3)
CONCLUSION
This HPLC method for quantification of Tapentadol hydrochloride in human plasma is simple, accurate, precise, rapid, reproducible and selective. It is a simple, rapid, practical and economical alternative for studies of the bioavailability, bioequivalence and pharmacokinetics of this drug in human plasma.
ACKNOWLEDGMENTS
The authors are thankful to the Principal, Dr. D. Y. Patil College of Pharmacy, Pune for providing excellent research facilities and Emcure Pharmaceuticals Ltd., Pune for providing the gift sample of Tapentadol hydrochloride.
Table 1: Intraday, Interday precision and accuracy of Tapentadol hydrochloride in human plasma QC samples (*Average of six readings)
Concentration of QC samples (ng/ml)
Observed Concentration* (mean ng/ml )
Precision ( % RSD )
Accuracy* (% mean) Intraday Precison
100 97.90±0.5346 0.5460 97.90
500 492.00±1.062 0.2158 98.40
1000 984.70±1.254 0.1273 98.47
Interday Precision
100 94.52±0.1962 0.2075 94.52
500 488.40±2.865 0.5866 97.68
Table 2: Recovery of Tapentadol hydrochloride QC samples in human plasma (*Average of six readings)
Concentration of QC samples (ng/ml)
Observed Concentration* (mean ng/ml )
Recovery* (% mean)
% RSD
100 83.83 83.83 0.2863
500 446.25 89.25 1.024
1000 825.20 82.52 1.257
Mean 85.20
Table 3: Stability of Tapentadol hydrochloride QC samples in human plasma (*Average of six readings)
Stability Concentration of QCsamples
(ng/ml)
Concentration found* (mean ng/ml )
% Mean* % RSD
Short term stability
100 97.48±0.4326 97.48 0.8421
1000 976.60±8.635 97.66 0.9232
Long term stability
100 94.78±0.6358 94.78 0.8714
1000 951.29±9.462 95.13 0.7382
Freeze thaw stability
100 96.31±0.6524 96.31 0.7121
1000 968.67±10.632 96.86 0.6520
Figure 1: Chemical structure of Tapentadol hydrochloride
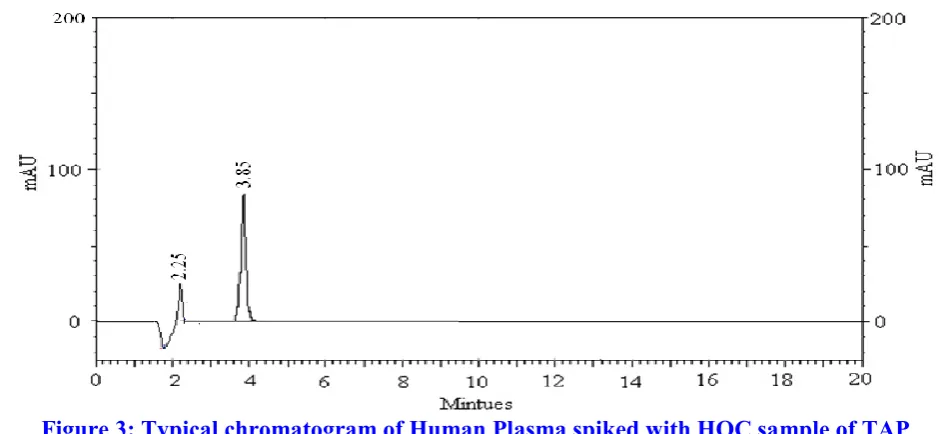
Figure 3: Typical chromatogram of Human Plasma spiked with HQC sample of TAP
REFERENCES
1. (2014), “Indian Pharmacopoeia”, Vol. III, Govt. India Ministry of Health and Family Welfare, The Controller of Publication, Ghaziabad, 2826.
2. Mohamed, AA; Mokhtar, MM and Hamed, ME (2013), “Spectrophotometric Methods for Determination of Tapentadol Hydrochloride”, J. Applied Pharmaceutical
Science, Vol. 3(3), 122 – 125.
3. Sherikar, OD and Mehta, PJ (2012), “Development and validation of RP-HPLC, UV Spectrophotometric and Spectrophotometric method for Estimation of Tapentadol Hydrochloride in Bulk and in Laboratory Sample of Tablet Dosage Form”,
J Chemical and Pharma Research, Vol.
4(9), 4134-4140.
4. Pandya, GP and Joshi, HS (2013), “Development and Validation of Stability Indicating HPLC Assay Method for Determination of Tapentadol in Tablet Formulation”, Int J Scientific &
Engineering Research, Vol. 4(4),
1288-1292.
5. Patil, PO; Marathe, GM and Patil, DA (2013), “Stability Indicating RP-HPLC Method for the Determination of Tapentadol in Bulk and Pharmaceutical Dosage Form”,
Int J Chem Tech Research, Vol. 5 (1),
34-41.
6. Rizwana, I; Prakash, KV and Mohan, GK (2013), “RP-HPLC Method for
Determination of Tapentadol in Bulk and Pharmaceutical Formulation”, J Global
Trends in Pharmaceutical Sciences, Vol.
3(3), 755-762.
7. Muzib, YI; Reddy, JR; Chowdary, KP and Swathi, E (2013), “Development and Validation of RP-HPLC Method for estimation of Tapentadol Hydrochloride in bulk And Tablet Dosage Forms”, Int. J.
Chemical and Analytical Science, Vol.
4(2), 67-72.
8. Gundala, U; Bonagiri, C and Devanna, N (2014), “Simultaneous Estimation of Paracetamol and Tapentadol in Bulk and Pharmaceutical Formulation by Reverse Phase High Performance Liquid Chromatography (RP-HPLC)”, IOSR J
Pharmacy, Vol. 4(6), 33-38.
9. Chan, CC (2004), “Analytical Method Validation and Instrument Performance
Verification”, Wiley Interscience, 16-22.
10.Sharma, D; Mittal, R; Gupta, A; Singh, K and Nair, A (2010), “ Quantitative Bioanalysis by LC-MS/MS: A Review”, J
Pharm Biomed Sci, Vol. 7, 1-20.
11.Guidance for Industry (2001),
“Bioanalytical Method Validation”, U.S.
Correspondence Author:
Sonali Mahaparale
Padmashree Dr. D.Y. Patil College of Pharmacy, Akurdi, Pune-411044, Maharashtra, India