R E S E A R C H A R T I C L E
Open Access
Mammographic images segmentation based on
chaotic map clustering algorithm
Marius Iacomi
1,2, Donato Cascio
1*, Francesco Fauci
1and Giuseppe Raso
1Abstract
Background:This work investigates the applicability of a novel clustering approach to the segmentation of mammographic digital images. The chaotic map clustering algorithm is used to group together similar subsets of image pixels resulting in a medically meaningful partition of the mammography.
Methods:The image is divided into pixels subsets characterized by a set of conveniently chosen features and each of the corresponding points in the feature space is associated to a map. A mutual coupling strength between the maps depending on the associated distance between feature space points is subsequently introduced. On the system of maps, the simulated evolution through chaotic dynamics leads to its natural partitioning, which corresponds to a particular segmentation scheme of the initial mammographic image.
Results:The system provides a high recognition rate for small mass lesions (about 94% correctly segmented inside the breast) and the reproduction of the shape of regions with denser micro-calcifications in about 2/3 of the cases, while being less effective on identification of larger mass lesions.
Conclusions:We can summarize our analysis by asserting that due to the particularities of the mammographic images, the chaotic map clustering algorithm should not be used as the sole method of segmentation. It is rather the joint use of this method along with other segmentation techniques that could be successfully used for increasing the segmentation performance and for providing extra information for the subsequent analysis stages such as the classification of the segmented ROI.
Keywords:Chaotic maps, Clustering algorithms, Cooperative behavior, Segmentation, Mammography, Features, Mass lesions, Microcalcifications, Breast cancer
Background
At present, breast cancer is the most common cancer among women, after cancers of the skin, and the second leading cause of cancer death in women after lung cancer [1-3]. The most widely used method for detecting breast cancer in its early stages is the mammography, a technique which has lately taken advantage of the supplementary features offered by the digital format [1]. During the last decades, the automatic detection of pathologies in the mammographic images has became a widespread auxiliary technique in radiology and the CAD (Computer Aided Detection) systems have proven their effectiveness mostly as a “second reader” (see [4-6]). The partitioning of the image in medically meaningful components (homogeneous
with respect to one or several appropriately chosen characteristics) is a compulsory step in the process of automatic searching of pathologies in the images [7-11]. This phase plays a crucial role [12]: any non segmented lesion at this stage will be irremediably lost for any further analysis. While a wide variety of segmentation approaches have been proposed, there is no standard algorithm that can ensure high levels of accuracy for all imaging applica-tions [13-15]. Furthermore, many segmentation methods rely on specific testing on an actual database [16] and the performance depends on database specificities. In particu-lar, the segmentation of mass lesions in mammographies remains a challenging task since the masses are usually embedded and obscured by surrounding normal breast parenchyma [1,17]. The segmentation methods proposed in mammography and more generally in medical imaging span a broad range of techniques, see e.g. [18] for a recent * Correspondence:[email protected]
1
Dipartimento di Fisica e Chimica, Università Degli Studi di Palermo, Palermo, Italy
Full list of author information is available at the end of the article
© 2014 Iacomi et al.; licensee BioMed Central Ltd. This is an Open Access article distributed under the terms of the Creative Commons Attribution License (http://creativecommons.org/licenses/by/2.0), which permits unrestricted use, distribution, and reproduction in any medium, provided the original work is properly credited. The Creative Commons Public Domain Dedication waiver (http://creativecommons.org/publicdomain/zero/1.0/) applies to the data made available in this article, unless otherwise stated.
review and [19,20] for particular examples. One of the generic segmentation approaches proposed more than three decades ago is the feature-based clustering method [21], which associates to each pixel or group of pixels from the image a set of appropriately chosen numerical parameters and transforms the primary segmentation task in a derived clustering problem in the associated feature space. Within this approach, the process of feature cluster-ing becomes the crucial part of the segmentation algorithm. The main advantage of this approach is that the method does not require the use of a training set [15]. Towards the end of the last century, a new promising nonparametric method of clustering relying on the physical properties of the inhomogeneous Potts model has been proposed by Blatt, Wiseman and Domany [22]; a similar approach was proposed in terms of coupled chaotic dynamical networks by Manrubia and Mikhalkov [23] and has been further refined and restated with coupled chaotic maps by L. Angelini et al. [24]. During the last decade, a series of successful applications of this clustering method has emerged in the literature, such as landmine detection [25], EEG signals analysis in medicine [26] or financial analysis (stock markets [27], financial time series [28]). On the other hand, the chaotic map based algorithms have been proposed in many other contexts such as analysis of matrix metalloproteinases [29] or the medical image encryption technology [30]. The wide applicability of the feature clustering with coupled chaotic maps in-spired us to investigate its effectiveness in the case of mammographic images with their specific characteristics. This paper focuses on the application of the chaotic maps clustering method for the segmentation of digital mam-mographic medical images. The results of this application are subsequently presented.
Methods
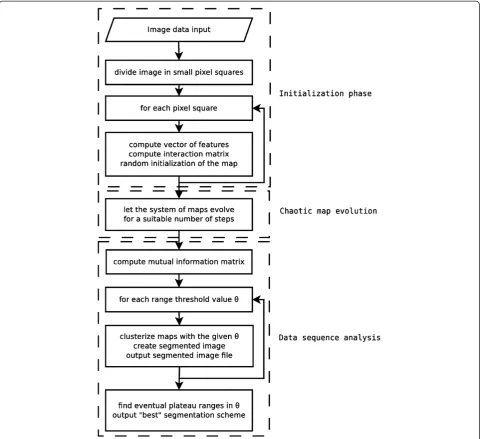
The chaotic map clustering method has been thoroughly described in several references ([24-27]); the reader is therefore invited to consult them for more details con-cerning the method. For completeness, we present here a sketch of the method we have used, following the general flowchart in reference [26]. The proposed method consists of three major phases (see the flowchart in Figure 1).
In the initialization phase, the mammographic image to be analyzed is divided into elementary units of pixels (squares) and a feature vector is computed for each elementary unit. A dynamical variable is also associated with each unit and initialized at random. Finally, an “inter-action coefficient”is computed for each pair of units.
The second phase is the core of the method as it fea-tures the basic idea of chaotic map clustering: the inte-gration of a dynamical system in the feature space. For each point in the feature space, the associated dynamical variable is allowed to iteratively evolve according to a
functional law corresponding to the distance matrix. In mathematical terms, for each point in the feature space {ri}, one defines a real dynamical variable xi ∈ [−1,1]
(i labels the data points). For two points i and j, the “interaction”matrix element is defined as
Ji j ¼ exp −ri–rj2=2a2
h i
whereais a local scale parameter. The iterative evolution law is given by
xiðtþ1Þ ¼ Xj≠i Ji jf x jð Þt
=Ci
where
Ci¼ X
j≠i Ji j
and
f xð Þ ¼1−2x2
is the usual logistic map which is at the origin of the chaotic dynamics of the system. The local length scale
a is estimated as average distance of the K-nearest neighbors (KNN), where K is the only free parameter of the algorithm.
The third phase is the analysis of the time evolution of the coupled chaotic map system. The trajectories of the associated maps exhibit a more or less synchronized behavior depending on how close are the corresponding points in the feature space irrespective of the randomly chosen initial state of the maps: the closer are the repre-sentative points, the more similar are the trajectories. Since the maps are chaotic, there is no final stationary regime. Hence, to evaluate mutual correlations one has to operate a cut-off after a large enough number of iter-ations [24]. In order to define a meaningful measure for the actual synchronism of pairs of maps, one extracts the time sequence Si (t) of the sign bits corresponding to the map xi (t) as Si (t) = 1 if xi (t) > 0 and Si (t) = 0 otherwise, and one computes on this basis the value of the mutual information as:
Ii j ¼HiþHj–Hi j
whereHi is the Boltzmann entropy for thei-th map
se-quence andHi jis the joint entropy of the mapsiandj.
threshold and their hierarchy is naturally obtained from the graph’s increasing connectivity. For θ= 0 all data points belong to a single cluster while for θ=ln 2 the partitioning will consist in one cluster for each point. Between these extreme values lays the“best”partitioning scheme whose optimality is identified by its maximal stability when varying θ. The stability conditions can be imposed on the number of clusters and on the size of the biggest clusters. These conditions are strong indications that the clustering scheme obtained through application of the algorithm is not a spurious artifact of meaningless numerical output but it rather reflects some deeper simi-larity property of the input data.
The method has been implemented in order to take as input the data points corresponding to the digital mam-mographic images to be segmented. The computation begins with the partition of the image into squares small enough to match the typical dimensionality of the smallest objects of interest for the radiologist and rich enough in pixels in order to enable the computation of relevant asso-ciated features. In our experiments the side of the square usually ranged around 20 pixels. For each square a vector of features is computed leading to an associated data point in the feature space. Due to the fixed geometry of the initial partitioning, no geometrical or form-based feature can be taken into account at this stage. The position of Figure 1Flowchart of the chaotic map segmentation algorithm.The flowchart of the chaotic map segmentation algoritm used within this work. Its three phases are delimited by dashed lines.
Iacomiet al. BMC Medical Imaging2014,14:12 Page 3 of 11
the square in the image has a definite importance: any seg-mented lesion should be a contiguous region composed of one or several groups of pixels, therefore any medically meaningful clusters of points in the feature space have to correspond to spatially connected groups of neighbor squares in the image. Hence, it results necessary to treat separately the positional feature (the x and y of a data point) as a compulsory check. Other features used are the usual statistical central moments (mean pixel gray value, variance, kurtosis, skewness) and several autocorrelation values (such as energy, entropy, contrast) accounting for the texture (see [32-34] for other generic texture features and [35-38] for mammographic specific features).
The values of features have been linearly normalized to zero mean and unit variance over the whole image set of points as in [39]. Furthermore, a Karhunen-Loève transformation has been subsequently used in order to eliminate redundancies and focus the analysis on the main independent components of the feature vectors.
In order to make a more meaningful evaluation of the eventual gains of applying the chaotic maps method, the clusters have been also obtained in an alternative manner, by using the simple Euclidean distance in the feature space between the pairs of squares rather than the mutual information.
The clusters obtained on this basis are visualized as different gray-level regions on the image. Due to the border effects, the contour of the breast usually introduces a series of spurious clusters with no real meaning. In our analysis, we have chosen to cut-off these artifacts by default assigning a strip of border pixel squares to the unique border cluster; the choice has the advantage that the breast shape contour is immediately visible on the segmented image (in white), while exhibiting low probability to cut-off also eventual pathologies, usually found more in depth.
The mammographic image database used for this study consists of a group of 149 selected cases for a total of 298 images. More specifically, we operated on three distinct datasets: a first set of 24 digitally acquired cases on a GE Senograph 2000D containing 98 images (characteristics: size 1914×2294 pixels, pixel size 0.094 mm, spatial reso-lution ~5 lp/mm, log pixel-intensity relationship), a second set of 22 digitalized cases on a Lorad Selenia Full Field Digital Mammograph containing 97 images (characteristics: size 3328×4096 pixels, pixel size 0.070 mm, spatial reso-lution ~7 lp/mm, linear pixel-intensity relationship); and a third set of 103 anonymized individual images containing micro-calcifications clusters digitally acquired on a Fuji CR mammograph (characteristics: size 1770×2370 pixels, pixel size 0.101 mm, spatial resolution ~5 lp/mm, linear pixel-intensity relationship). The combined first two sets contained a number of 10 cases with small (typical dimen-sion≤2 mm) mass lesions showing up in 20 images (10
images for each set) and 28 cases with large sized (typical dimension > 2 mm) mass lesions showing up in 56 images (30 images for the first set and 26 images for the second). The third set contained 73 cases/images with micro-calcifications clusters and 30 reference healthy images. The digital images were all intended for presentation and had a 12-bit greyscale depth. All the digitally acquired images were subsequently stored on a PACS system. The pathologies have been diagnosed and classified by two expeThe mammographic image database used for this study consists of a group of 149 selected cases for a total of 298 images. More specifically, we operated on three distinct datasets: a first set of 24 digitally acquired cases on a GE Senograph 2000D containing 98 images (char-acteristics: size 1914×2294 pixels, pixel size 0.094 mm, spatial resolution ~5 lp/mm, log pixel-intensity relation-ship), a second set of 22 digitalized cases on a Lorad Selenia Full Field Digital Mammograph containing 97 images (characteristics: size 3328×4096 pixels, pixel size 0.070 mm, spatial resolution ~7 lp/mm, linear pixel-intensity relationship) ; and a third set of 103 anonymized individual images containing micro-calcifications clusters digitally acquired on a Fuji CR mammograph (characteris-tics: size 1770×2370 pixels, pixel size 0.101 mm, spatial resolution ~5 lp/mm, linear pixel-intensity relationship). The combined first two sets contained a number of 10 cases with small (typical dimension≤2 mm) mass lesions showing up in 20 images (10 images for each set) and 28 cases with large sized (typical dimension > 2 mm) mass lesions showing up in 56 images (30 images for the first set and 26 images for the second). The third set contained 73 cases/images with micro-calcifications clusters and 30 reference healthy images. The digital images were all intended for presentation and had a 12-bit greyscale depth. rt senior radiologists; all diagnosed pathologies have been further confirmed by histological examination.
The procedure was tested on images belonging to a private anonymous database collected in the Policlinic Hospital of Palermo. Policlinic Hospital is a hospital firm of University of Palermo in which formation, scientific research and health service are well integrated. Policlinic Hospital attests that all research involving humans is carried out in compliance with the Helsinki Declaration and involves appropriate patient consent.
Results and discussion
in Figure 2. If the clustering is to identify one or a few medically significant regions in the image, it is expected that the corresponding clusters present a minimum of stability also in the number of internal points. The most important clusters in the image actually do exhibit some stability at the varying of the threshold (the internal num-ber of points remains approximately constant on severalθ ranges, see e.g. also [26]), but this behavior remains less typical since in a large number of cases, there is no
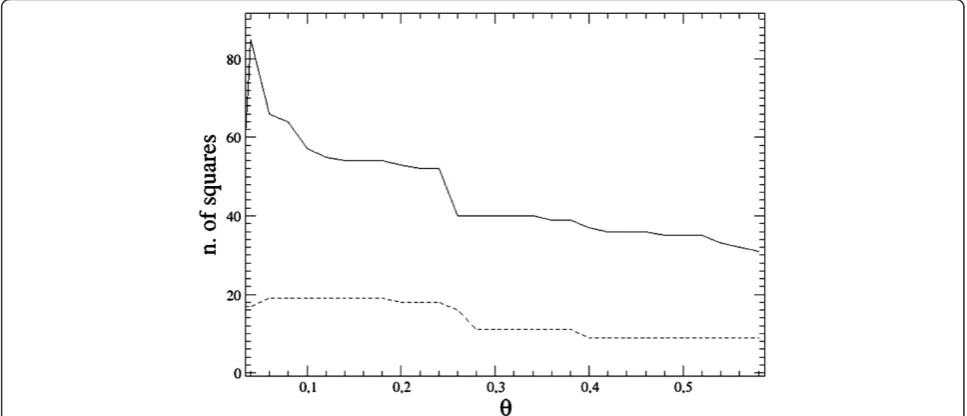
obvious stability subrange or there is no meaningful clus-ter in the image. In Figure 3 we have represented a typ-ical behavior of the number of points (pixel squares) contained in the two biggest meaningful clusters (other than the three default ones–image background, border pixels and normal internal breast points).
The segmentation algorithm described above displays a fair number of findings in the images containing mass lesions. The“cluster noise”is very large: in fact, at higher
Figure 3Size of the two largest clusters as a function of the threshold.The number of squares contained in the two largest clusters displayed as a function of the threshold parameterθfor a given image. The solid line refers to the first cluster, the dashed line to the second one. The stability ranges are an indicator of meaningfulness for the clusters.
Figure 2Short title: typical behavior of the number of clusters as a function of the threshold.The figure illustrates the increase in the number of clusters for a given image when increasing the threshold parameterθ. The same behavior is displayed by the number of clusters in all the images, with some slight variations of the actual values not affecting the generic shape of the curve. The upper bound has been setθ= 0.5 rather thanθ= ln 2 due to the software limitation of the number of clusters.
Iacomiet al. BMC Medical Imaging2014,14:12 Page 5 of 11
threshold levels, most clusters contain actually just one pixel square and show up in internal breast areas charac-terized by rapid variation of luminosity, typically not far from the breast contour.
Since there is no clear stability range in the threshold
θ, assigning these findings to real ROI for a physician (potential mass lesions) remains a hard task, at least for an automatic system such as a CAD. Basically similar segmented images can be obtained with less effort if clustering only the distance features, which means that the chaotic map clustering algorithm brings little (if any) improvement with respect to the more orthodox and less resource consuming distance-based methods. This result is certainly not surprising since if one excludes their geo-metrical characteristics, mass lesions usually do not share a mathematically well-defined set of features and the iden-tification of mass ROI is a challenge. In the figures below,
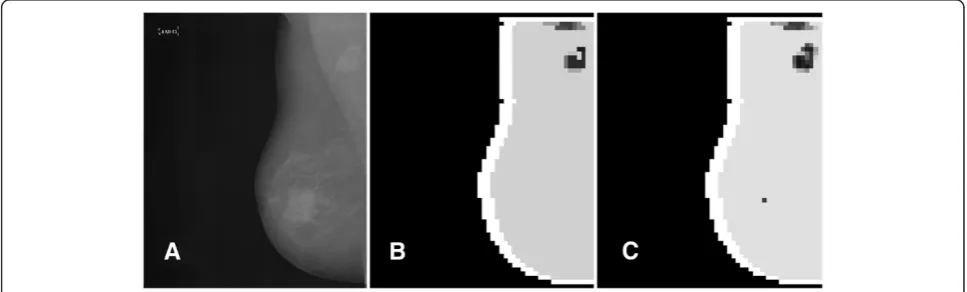
some samples illustrating the results of the segmentation algorithm are displayed. Figure 4 exhibits a basic segmen-tation pattern showing up at most of the threshold values in the case of a small and well-defined mass opacity. Two less satisfactory (according to the physicians opinion) segmentation patterns are shown in the Figures 5 and 6: the first illustrates the occurrence of a potential mass le-sion loss within the process, while the second emphasizes the lack of correspondence between the segmented clus-ters and the shape and size of the actual opacity in the image.
As a general characteristic, the small mass lesions with dimensions of the same order as the size of the pixel square (that is between 1–2 mm), are well identified by the algorithm: practically all of them (15 out of 16, about 94% within this category) show up as isolated point clus-ters in the segmented image for all but the first threshold Figure 4A small mass lesion showing up in the segmented image for most values ofθ.PanelA. The original image. PanelB. The
segmented image displaying the small mass lesion for a given threshold valueθ= 0.1. An essentially similar segmentation shows up for most values ofθ.
values. This behavior may be linked with the important differences in the feature characterization of healthy tissue and small lesions. The meaningfulness of the segmented ROI clusters is ensured by their lack of suspicious clus-terized neighboring pixel squares rather than by the variational technique used in the original form of the algo-rithm’s implementation: the isolation criterion shows no false positive for cluster groups up to four pixel squares immersed in an uniform (healthy tissue) background, not too close to the border of the breast. If one includes also those small clusters connected with the breast border, the correct recognition rate diminishes accordingly and some false positives show up near the border; it’s worthwhile mentioning that in this case the isolation criterion is less operational since all the interesting points cannot be satis-factorily resolved from the spurious pixel squares near the border. No isolated small cluster appears in healthy images.
The results for small mass lesions are summarized in Table 1. In this table, the“Non-Pathologic” label refers to small mass-like objects diagnosed as normal/benign by the physician (4 internal ROI and 4 ROI close to the border). The first row of results contains those ROI seg-mented as small isolated clusters by the algorithm, while
the second row counts the ROI not identified by the algorithm. These results show that the proposed method might be considered as a potential alternative for finding small mass lesions far from the breast border.
For large-sized mass lesions extending over an area corresponding to more pixel squares (with typical linear diameters ranging from 3 mm up to about 30 mm), the corresponding segmentation clusters rarely match the shape of the lesion due to the usual non-uniformity of the features over ROI area. About 10% of these lesions (5 out of 56) are matched with an overlap of about 80% by the corresponding segmented clusters; the other large lesions either exhibit overlaps under 30% with their segmented cluster counterparts (33 out of 56), or have no meaningful corresponding cluster associated with them (18 out of 56). On the other hand, in the segmented images, the algorithm introduces often bigger-sized cluster artifacts associated with breast borders or non-pathological denser areas in 32 of the cases, and it is difficult to establish an unambiguous automatic deci-sional criterion for the degree of meaningfulness of these clusters.
Table 2 summarizes the results for large mass lesions. Overall, these results show that the proposed method is Figure 6Large-sized massive opacity segmentation.Segmentation of a large-sized massive opacity. PanelA. The original image. PanelB. The image segmented withθ= 0.24. Note the weak correspondence between the segmented internal areas and the actual shape and size of the ROI.
Table 1 Segmentation of images with pathologic and non-pathologic small mass lesions
Only internal isolated ROI, actual diagnosis
Including breast border isolated ROI, actual diagnosis
Pathologic Non-pathologic Pathologic Non-pathologic
15 TP 0 (FP) 16 TP 3 (FP)
1 FN 4 (TN) 4 FN 5 (TN)
Table 2 Segmentation of large-sized mass lesions (negative images included)
Large mass lesions
Pathologic Non-pathologic/absent
38 (= 5 + 33) TP (partial match) 32 (FP)
18 FN 87 (TN)
Iacomiet al. BMC Medical Imaging2014,14:12 Page 7 of 11
not a good potential alternative for finding large mass lesions.
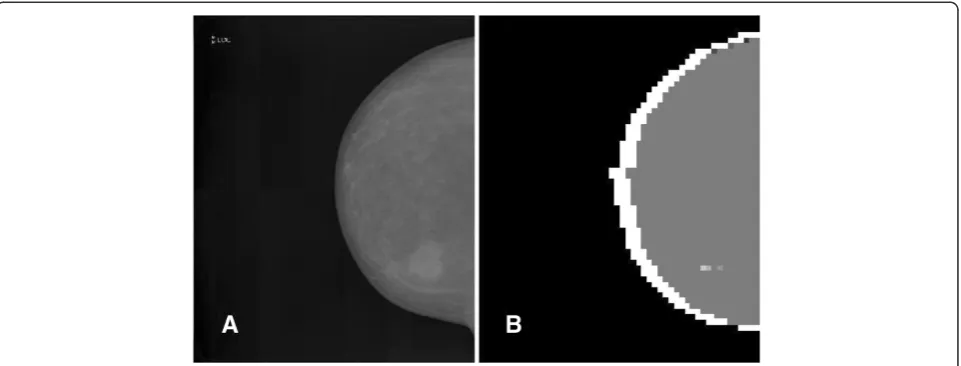
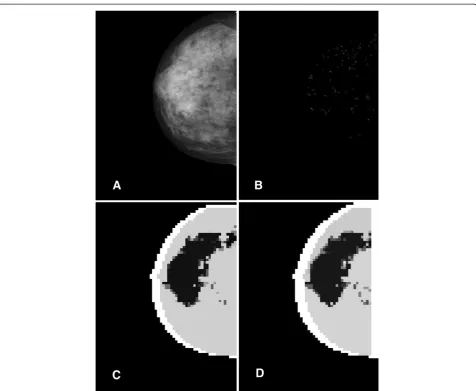
An interesting behavior is displayed by the images containing micro-calcifications. The parts of the image containing micro-calcifications naturally group in a cluster. The feature analysis thus displays the whole ROI rather than finding individual calcifications, as is visible from Figure 7 abovea. This result is not surprising due to the well-known reliability of the micro-calcifications charac-terization through the local features on the image. The overlap of the segmented cluster with the micro-calcifica-tions area varies in the range 10-90% with the peak in the
range 30-50%. The agreement is better for denser distrib-uted micro-calcifications.
Due to the distinction naturally arising between small and large/sized mass lesions, one can define an accuracy for each class asacci= (TPi+ TNi)/( TPi+ TNi+ FPi+ FNi)
where i labels the mass lesion class and the“true/false” are given with respect to the small or large mass le-sions. We find thus for small mass lesions an accuracy accSMALL MASS= (195-3-4)/195 ~ 96% (considering also
the isolated clusters near the border) and for large mass lesions an accuracy accLARGE MASS= (87 + 38)/195 ~ 64%,
in agreement with our previous observations. Of some Figure 7Segmentation of an image with micro-calcifications.Segmentation of an image with micro-calcifications. PanelA. The original image containing micro-calcifications clusters. PanelB. Actual distribution of micro-calcifications as given by the CAD tool. PanelC. The segmented image displaying a big cluster for the ROI. PanelD. The image segmented with a feature-based scheme.
Table 3 Overlap of the cluster with the ROI for micro-calcifications images
Overlap range 0-5% 5-15% 15-25% 25-35% 35-45% 45-55% 55-65% 65-75% 75-85% 85-95%
interest is also the overall accuracyaccMASS= 118/195 ~
60.5% for discriminating between images with generic mass lesions and non-pathological/healthy.
The performance of the method doesn’t exhibit a sig-nificant dependence on the database: the accuracy results restricted to the first set are accSMALL MASS= 95/98 ~
97% and accLARGE MASS= 61/98 ~ 62%, while on the
second set one has accSMALL MASS= 93/97 ~ 96% and accLARGE MASS= 64/97 ~ 66%.
Concerning the 103 images in the micro-calcifications dataset, 3 of the healthy images present an internal con-tiguous cluster similar to the one underlying a part of the positives. The remaining 73 positive ones do exhibit internal“big”clusters distributed according to the follow-ing overlaps:
If the overlap in the segmented image with micro-calcifications is enough consistent (our tests show that an overlap of at least 30% with the denser micro-calcification area constitutes already a safe indication) to trigger a further analysis in an automatic system, the internal segmentation cluster will contain most of the micro-calcifications and may be used as a relevant investi-gation starting point. It should be mentioned at this point that the feature-only based approach produces an essen-tially similar segmentation pattern. Therefore, the chaotic map clustering of the mammographic images containing micro-calcifications brings no extra information with re-spect to this alternative method.
Assuming that overlaps up to 25% are not pathology-conclusive, the number of false negatives is essentially given by the sum of the first three terms in Table 3. On the other hand, the false positives are the 3 healthy images segmented with the internal big cluster, therefore one may estimate an accuracyaccMICRO= (103-23-3)/103 ~ 75%.
Conclusion
The non-parametric chaotic map clustering of the mam-mographic images has been considered here as stand-alone segmentation approach, mainly from an applicability point of view. The ultimate goal of applying such a segmenta-tion method to the medical mammographic images is the potential performance improvement of an automatic detection system based on it. As discussed, the specific aspect of mammographic segmentation which remains a non-trivial challenge is the segmentation of mass lesions, while the identification of micro-calcifications with this new algorithm hardly could lead to any spectacular breakthrough advance (micro-calcifications detection rates of about 94% with 6.25% of false positives and 2% false negatives were already reported more than a decade ago, see [40]).
At this stage of the analysis, the results obtained do allow some general conclusions concerning the valuable applicability of the chaotic map algorithm for the
segmentation of mammographic images, in an effi-cient automatic work-flow, in comparison with the results obtained by alternative methods as those used by present day commercial CAD systems. While many (about 90%) of the mass lesions are either lost or appear with wrong sizes, shapes and as neighboring independent clusters (see Figures 5 & 6 above), most of the smaller ones show up conveniently as internal clusters in the segmented images. Indeed, about 94% of the small lesions more than 6 mm away from the border were correctly segmented by the algorithm; the true positive rate de-creases to 80% if the smaller mass lesions near the breast border are included. This fact looks especially important when considering that the small lesions are usually less easily identifiepathologic cases cod than the extended ones, and the support of an automatic CAD sys-tem is more useful in their case. On the other hand, one has to keep in mind that the important number of “para-site” clusters with no medical significance adds a further complication in correctly evaluating the output of the seg-mentation algorithm which the stability analysis cannot eliminate.
Concerning the micro-calcifications, the chaotic maps segmentation process gives interesting and peculiar results. In about 2/3 of the pathologic cases considered here, the algorithm provides an useful shape of the region with denser micro-calcifications. While these results are still not significantly edging the ones derived from simple fea-ture analysis, the algorithm may be used as alternative check in a more complex workflow.
Due to the particularities of the mammographic images, we conclude that the chaotic map clustering algorithm should not be used as unique stand-alone method of seg-mentation. It is rather the joint use of this method along with other segmentation techniques that could be success-fully used for increasing segmentation performance and providing extra information for subsequent analysis stages such as the classification of the segmented ROI.
Endnote a
The CAD tool used for computing the position of micro-calcifications is CyclopusCAD Mammo® produced by CyclopusCAD srl.
Competing interests
•We have not received in the past five years reimbursements, fees, funding, or salary from an organization that may in any way gain or lose financially from the publication of this manuscript, either now or in the future.
•We do not hold any stocks or shares in an organization that may in a ny way gain or lose financially from the publication of this manuscript, either now or in the future.
•We do not hold or we are not currently applying for any patents relating to the content of the manuscript. We have not received reimbursements, fees, funding, or salary from an organization that holds or has applied for patents relating to the content of the manuscript.
Iacomiet al. BMC Medical Imaging2014,14:12 Page 9 of 11
•We have not any other financial competing interests. Biltawi, M.; Al-Najdawi, N.; Tedmori, S.; Mammogram enhancement and segmentation methods: classification, analysis, and evaluation. The 13th international Arab Conference on Information Technology, December 2012.
•There are not any non-financial competing interests (political, personal, religious, ideological, academic, intellectual, commercial or any other) to declare in relation to this manuscript.
Authors’contributions
MI and DC conceived of the study, carried out the Clustering algorithm implementation and performed the statistical analysis and drafted the manuscript. FF and GR conceived of the study, participated in the design and coordination of the manuscript, and helped to its draft. All authors read and approved the final manuscript.
Acknowledgements
Authors thank Policlinic Hospital of Palermo and in particular Dr. Raffaele Ienzi for providing the images.
Author details
1Dipartimento di Fisica e Chimica, Università Degli Studi di Palermo, Palermo, Italy.2Institutul deŞtiinţe Spaţiale, Bucharest, Măgurele, Romania.
Received: 8 November 2013 Accepted: 14 March 2014 Published: 25 March 2014
References
1. Meyer-Bäse A:Pattern Recognition for Medical Imaging.San Diego, CA, USA: Elsevier Academic Press; 2003:346–359.
2. American Cancer Society:Cancer Facts & Figures 2012; 2012. http://www. cancer.org/acs/groups/content/@epidemiologysurveilance/documents/ document/acspc-031941.pdf.
3. Shi J, Sahiner B, Chan HP, Ge J, Hadjiiski L, Helvie MA, Nees A, Wu YT, Wei J, Zhou C, Zhang Y, Cui J:Characterization of mammographic masses based on level set segmentation with New image features and patient information.Med Phys2008,35:280–290.
4. Azavedo E, Zackrisson S, Mejàre I, Heibert Arnlind M:Is single reading with computer-aided detection (CAD) as good as double reading in mammography screening? A systematic review.BMC Med Imaging2012, 12:art. no. 22.
5. Ciatto S, Cascio D, Fauci F, Magro R, Raso G, Ienzi R, Martinelli F, Simone MV: Computer assisted diagnosis (CAD) in mammography. Comparison of diagnostic accuracy of a new algorithm (Cyclopus®, Medicad) with two commercial systems.Radiol Med2009,114:626–635.
6. Cascio D, Fauci F, Iacomi M, Raso G, Magro R, Castrogiovanni D, Filosto G, Ienzi R, Vasile MS:Computer-aided diagnosis in digital mammography: comparison of two commercial systems.Imaging in Medicine2014, 6(1):13–30.
7. Nazem-Zadeh M-R, Saksena S, Babajani-Fermi A, Jiang Q, Soltanian-Zadeh H, Rosenblum M, Mikkelsen T, Jain R:Segmentation of corpus callosum using diffusion tensor imaging: validation in patients with glioblastoma.BMC Med Imaging2012,12:art. no. 10.
8. Montelius M, Ljungberg M, Horn M, Forssell-Aronsson E:Tumour size measurement in a mouse model using high resolution MRI.BMC Med Imaging2012,12:art. no. 12.
9. Wong KP:Medical Image Segmentation: Methods and Applications in Functional Imaging. InHandbook of Biomedical Image Analysis: Segmentation models Part B.Edited by Suri JS, Wilson DL, Laxminarayan S. New York, NY, USA: Kluwer Academic/Planum Publishers; 2005:111–115. 10. Cascio D, Fauci F, Magro R, Raso G, Bellotti R, De Carlo F, Tangaro S, De Nunzio G, Quarta M, Forni G, Lauria A, Fantacci ME, Retico A, Masala GL, Oliva P, Bagnasco S, Cheran SC, Torres EL:Mammogram segmentation by contour searching and massive lesions classification with Neural Network.IEEE Trans Nucl Sci2006,53:2827–2833.
11. Bellotti R, De Carlo F, Tangaro S, Gargano G, Maggipinto G, Castellano M, Massafra R, Cascio D, Fauci F, Magro R, Raso G, Lauria A, Forni G, Bagnasco S, Cerello P, Zanon E, Cheran SC, Lopez Torres E, Bottigli U, Masala GL, Oliva P, Retico A, Fantacci ME, Cataldo R, De Mitri I, De Nunzio G:A completely automated CAD system for mass detection in a large mammographic database.Med Phys2006,33:3066–3075.
12. Claudia C, Farida C, Guy G, Marie-Claude M, Carl-Eric A:Quantitative evaluation of an automatic segmentation method for 3D reconstruction of intervertebral scoliotic disks from MR images.BMC Med Imaging2012, 12:art. no. 26.
13. Farag AA, Ahmed MN, El-Baz A, Hassan H:Advanced segmentation techniques. InHandbook of Biomedical Image Analysis: Segmentation models Part A.Edited by Suri JS, Wilson DL, Laxminarayan S. New York, NY, USA: Kluwer Academic/Planum Publishers; 2005:479.
14. Pratt WK:Digital Image Processing: PIKS Scientific Inside.4th edition. Hoboken, NJ, USA: John Wiley & Sons, Inc; 2007:579.
15. Yang S, Sunanda M:Statistical and adaptive approaches for optimal segmentation in medical images.InHandbook of Biomedical Image Analysis: Segmentation models Part B.Edited by Suri JS, Wilson DL, Laxminarayan S. New York, NY, USA: Kluwer Academic/Planum Publishers; 2005:267–271.
16. Tangaro S, Bellotti R, De Carlo F, Gargano G, Lattanzio E, Monno P, Massacra R, Delogu P, Fantacci ME, Retico A, Mazzocchi M, Bagnasco S, Cerello P, Cheran SC, Lopez Torres E, Zanon E, Lauria A, Sodano A, Cascio D, Fauci F, Magro R, Raso G, Ienzi R, Bottigli U, Masala GL, Oliva P, Meloni G, Caricato AP, Cataldo R:MAGIC-5: an Italian mammographic database of digitized images for research.Radiol Med2008,113:477–485.
17. Liu J, Chen J, Liu X, Chun L, Tang J, Deng Y:Mass segmentation using a combined method for cancer detection.BMC Syst Biol2011,
5(SUPPL. 3): art. no. S6.
18. Biltawi M, Al-Najdawi N, Tedmori S:Mammogram enhancement and segmentation methods: classification, analysis, and evaluation. The 13th international Arab conference on information technology. 2012. 19. Fauci F, Cascio D, La Manna A, Magro R, Raso G, Vasile M, Iacomi M:A
Fourier Based Algorithm for Microcalcifications Enhancement in Mammographic Images, IEEE Nuclear Science Symposium and Medical Imaging Conference; 2012:4388–4391. art. No. 4774254.
20. Vivona L, Cascio D, Magro R, Fauci F, Raso G:A Fuzzy Logic Cmeans Clustering Algorithm to Enhance Microcalcifications Clusters in Digital Mammograms, IEEE Nuclear Science Symposium and Medical Imaging Conference; 2012:3048–3050. art. No. 6152551.
21. Coleman GB, Andrews HC:Image segmentation by clustering.Proc IEEE Inst Electr Electron Eng1979,67:773–785.
22. Blatt M, Wiseman S, Domany E:Super-paramagnetic clustering of data. Phys Rev Lett1996,76:3251–3254.
23. Manrubia SC, Mikhalkov AS:Mutual synchronization and clustering in randomly coupled chaotic dynamical networks.Phys Rev E Stat Phys Plasmas Fluids Relat Interdiscip Topics1999,60:1579–1589.
24. Angelini L, De Carlo F, Marangi C, Pellicoro M, Stramaglia S:Clustering data by inhomogeneous chaotic map lattices.Phys Rev Lett2000, 85:554–557.
25. Marangi C, Angelini L, De Carlo F, Nardulli G, Pellicoro M, Stramaglia S: Clustering by inhomogeneous chaotic maps in landmine detection.Proc SPIE2001,4170:122–132.
26. Bellotti R, De Carlo F, Stramaglia S:Chaotic map clustering algorithm for EEG analysis.Physica A2004,334:222–232.
27. Basalto N, Bellotti R, De Carlo F, Facchi P, Pascazio S:Clustering stock market companies via chaotic map synchronization.Physica A2005, 345:196–206.
28. Basalto N, De Carlo F:Clustering financial time series.InPractical Fruits of Econophysics: Proceedings of The Third Nikkei Econophysics Symposium.Edited by Takayasu H. Tokio, Japan: Springer Verlag; 2006:252–256.
29. Giangreco I, Nicolotti O, Carotti A, De Carlo F, Gargano G, Bellotti R:Analysis of x-ray structures of matrix metalloproteinases via chaotic map clustering. BMC Bioinforma2010,11:. art. no. 500.
30. Fu C, Meng WH, Zhan YF, Zhu ZL, Lau FCM, Tse CK, Ma HF:An efficient and secure medical image protection scheme based on chaotic maps. Comput Biol Med2013,43(8):1000–1010.
31. Solé RV, Manrubia SC, Bascompte J, Delgado J, Luque B:Phase transitions and complex systems.Complexity1996,4:13–26.
32. Haralick R, Shanmungam K, Dinstein I:Textural features for image classification.IEEE Trans Syst Man Cybern C Appl Rev1973,6:610–621. 33. Haralick R:Statistical and structural approaches to texture.Proc IEEE Inst
Electr Electron Eng1979,67:786–803.
35. Masala GL, Golosio B, Oliva P, Cascio D, Fauci F, Tangaro S, Quarta M, Cheran SC, Lopez Torres E:Classifiers trained on dissimilarity
representation of medical pattern: a comparative study.Nuovo Cimento C 2005,28:905–912.
36. Masala GL, Tangaro S, Golosio B, Oliva P, Stumbo S, Bellotti R, De Carlo F, Gargano G, Cascio D, Fauci F, Magro R, Raso G, Bottigli U, Cgincarini A, De Mitri I, De Nunzio G, Gori I, Retico A, Cerello P, Cheran SC, Fulcheri C, Lopez Torres E:Comparative study of feature classification methods for mass lesion recognition in digitized mammograms.Nuovo Cimento C2007, 30:305–316.
37. Fauci F, Raso G, Magro R, Forni G, Lauria A, Bagnasco S, Cerello P, Cheran SC, Lopez Torres E, Bellotti R, De Carlo F, Gargano G, Tangaro S, De Mitri I, De Nunzio G, Cataldo R:A massive lesion detection algorithm in mammography.Phys Med2005,21(1):23–30.
38. Cascio D, Cheran SC, Chincarini A, De Nunzio G, Delogu P, Fantacci ME, Gargano G, Gori I, Masala GL, Preite Martinez A, Retico A, Santoro M, Spinelli C, Tarantino T:Automated detection of lung nodules in low-dose computed tomography.Int J Comput Assist Radiol Surg2007,2:357–359. 39. Angelini L, De Carlo F, Mannarelli M, Marangi C, Nardulli G, Pellicoro M,
Satalino G, Stramaglia S:Chaotic neural networks clustering: an application to landmine detection by dynamic infrared imaging.Opt Eng 2001,40:2878–2884. http://www.ba.infn.it/~angelini/minefields.pdf. 40. Melloul M, Joskowicz L:Segmentation of microcalcification in X-ray
mammograms using entropy thresholding.CARS 2002 Computer Assisted Radiology and Surgery2002:671–676.
doi:10.1186/1471-2342-14-12
Cite this article as:Iacomiet al.:Mammographic images segmentation based on chaotic map clustering algorithm.BMC Medical Imaging 201414:12.
Submit your next manuscript to BioMed Central and take full advantage of:
• Convenient online submission
• Thorough peer review
• No space constraints or color figure charges
• Immediate publication on acceptance
• Inclusion in PubMed, CAS, Scopus and Google Scholar
• Research which is freely available for redistribution
Submit your manuscript at www.biomedcentral.com/submit
Iacomiet al. BMC Medical Imaging2014,14:12 Page 11 of 11