RESEARCH ARTICLE
Vol: 2; Issue: 3
Development and Validation of Dual Wavelength UV
Spectrophotometric Method for Simultaneous Estimation of Cefixime
and Dicloxacillin Sodium in Pharmaceutical Dosage Form
Bharat G. Chaudhari 1, Heena J. Patel1*
1
Department of Quality Assurance, S. K. Patel College of Pharmaceutical Education and Research, Ganpat University, Ganpat Vidyanagar, Mehsana, Gujarat, India.
Date Received: 10-Feb-2014
Date of Accepted: 11-Mar-2014
Date Published: 14-Mar-2014
Abstract:
The present manuscript describes simple, sensitive, rapid, accurate, precise and economical dual wavelength method for the simultaneous determination of Cefixime and Dicloxacillin sodium in tablet dosage form. The principle for dual wavelength method is “the absorbance difference between two points on the mixture spectra is directly proportional to the concentration of the component of interest”. Cefixime was determined directly at 271.8 nm in methanol. The wavelengths selected for determination of dicloxacillin sodium were 271.8 nm and 218.4 nm in methanol. Regression analysis of Beer’s plots showed good correlation in concentration range of 3‐16 µg/ml for both the drugs. The method was successfully applied for the determination of these two drugs in tablet dosage form. No interference was observed from excipients present in the tablet. The suitability of this method for the quantitative determination of Cefixime and Dicloxacillin sodium was proved by validation. The proposed method was found to be simple and sensitive for the routine analysis of these two drugs in tablet dosage form. The results of analysis have been validated statistically and by recovery studies.
Keywords:
Cefixime, Dicloxacillin sodium,
Dual wavelength method, UV spectrophotometric method, Validation.Introduction
Cefixime (CEF) is chemically (6R,7R)-7-[(2Z)-2-(2-amino-1,3-thiazol-4-yl)-2 [(carboxymethoxy) imino] acetamido]-3-ethenyl-8-oxo-5-thia-1-azabicyclo-oct-2-ene-2 carboxylic acid [1] (Figure-1). Cefixime (CEF), an antibiotic, is a third generation cephalosporin. The antibacterial effect of cefixime results from inhibition of mucopeptide synthesis in the bacterial cell wall [2]. Cefixime (CEF) is official in Indian Pharmacopeia (IP) [3]
, British Pharmacopeia (BP) [4], and United States Pharmacopeia (USP) [5]. These three pharmacopeias describe liquid chromatography method for its estimation. Literature survey reveals UV spectrophotometry [6-9], HPLC [10-13] methods for determination of CEF alone. Literature survey also reveals UV [14-25], HPLC [26-40] methods for the determination of CEF with other drugs combination. Dicloxacillin sodium (DIC) is chemically (2S,5R,6R)- 6-[3-(2,6-dichlorophenyl)-5-methyl-1,2-oxazole-4-amido]-3,3-dimethyl-7-oxo-4-thia-1- azabi cyclo
both drugs in pharmaceutical dosage form.
Figure 1- Chemical structure of Cefixime
Figure 2- Chemical structure of Dicloxacillin
MATERIALS AND METHODS
APPARATUS
A shimadzu model 1700 (Japan) double beam UV/Visible spectrophotometer with spectral width of 2 nm, wavelength accuracy of 0.5 nm and a pair of 10 mm matched quartz cell was used to measure absorbance of all the solutions. Spectra were automatically obtain UV-Probe 2.1 system software. A Sartorius CP224S analytical balance (Gottingen, Germany), an ultrasonic bath (Frontline FS 4, Mumbai, India) was used in the study.
REAGENTS AND MATERIALS
Cefixime (CEF) and Dicloxacillin sodium (DIC) were kindly supplied as a gift samples from Brussels Laboratories Pvt. Ltd, Changodar, Ahmedabad, Gujarat, AR grade Methanol (S.D. Fine Chemical Ltd., Mumbai, India.) as a solvent and Whatman filter paper no. 41 (Millipore, USA) were used in the study.
PREPARATION OF STANDARD STOCK SOLUTION
An accurately weighed CEF and DIC powder (10 mg) were transferred to 100 ml separate volumetric flasks and dissolved in methanol. The flasks were shaken and volumes were made up to mark with methanol to give a solution having concentration 100 µg/ml for both of drugs.
Chemical structure of Cefixime
Chemical structure of Dicloxacillin
A shimadzu model 1700 (Japan) double beam UV/Visible spectrophotometer with spectral width of 2 nm, wavelength accuracy of 0.5 nm and a pair of 10 mm matched quartz cell was used to measure absorbance of all the solutions. Spectra were automatically obtained by Probe 2.1 system software. A Sartorius CP224S analytical balance (Gottingen, Germany), an ultrasonic bath (Frontline FS 4, Mumbai, India) was used in the
Cefixime (CEF) and Dicloxacillin sodium (DIC) were pplied as a gift samples from Brussels Laboratories Pvt. Ltd, Changodar, Ahmedabad, Gujarat, AR grade Methanol (S.D. Fine Chemical Ltd., Mumbai, India.) as a solvent and Whatman filter paper no. 41
TANDARD STOCK
An accurately weighed CEF and DIC powder (10 mg) were transferred to 100 ml separate volumetric flasks and dissolved in methanol. The flasks were shaken and volumes were made up to mark with methanol to give a µg/ml for both of
METHODOLOGY
The utility of dual wavelength data processing program is to calculate the unknown concentration of a component of interest present in a mixture containing both the components of interest and an unwa interfering component by the mechanism of the absorbance difference between two points on the mixture spectra. This is directly proportional to the concentration of the component of interest, independent of the interfering components. From the overlay of two drugs in figure-3, it is evident that direct determination of CEF at 271.8 nm (no absorbance of DIC at 271.8 nm). For estimation of DIC, two wavelengths selected (271.8 nm and 218.4 nm) the CEF shows same absorbance whereas DIC shows significant difference in absorbance with concentration (figure-4). Eight working standard solutions having concentration 3, 4, 6, 8, 10, 12, 14, 16
the drugs were prepared separately in methanol and the absorbance at 218.4 nm and 271.8 nm w
and absorptive coefficients were calculated using calibration curve.
The concentration of two drugs in the mixture can be calculated using regression equation.
Figure 4: Overlain zero order absorption spectra of CEF and DIC in m
VALIDATION OF THE PROPOSED METHOD
The proposed method was validated according to the International Conference on Harmonization (ICH) guidelines.
LINEARITY (CALIBRATION CURVE)
The calibration curves were plotted over a concentration range of 3 to 16 µg/ml for both CEF and DIC. Accurately measured standard solutions of CEF (0.3, The utility of dual wavelength data processing program is to calculate the unknown concentration of a component of interest present in a mixture containing both the components of interest and an unwanted interfering component by the mechanism of the absorbance difference between two points on the mixture spectra. This is directly proportional to the concentration of the component of interest, independent From the overlay spectra 3, it is evident that direct determination of CEF at 271.8 nm (no absorbance of DIC at 271.8 nm). For estimation of DIC, two wavelengths selected (271.8 nm and 218.4 nm) where the CEF shows same absorbance whereas DIC shows significant difference in absorbance with concentration Eight working standard solutions having concentration 3, 4, 6, 8, 10, 12, 14, 16 µg/ml for both the drugs were prepared separately in methanol and the absorbance at 218.4 nm and 271.8 nm were measured and absorptive coefficients were calculated using
The concentration of two drugs in the mixture can be calculated using regression equation.
ero order absorption spectra of CEF and DIC in m
VALIDATION OF THE PROPOSED METHOD
The proposed method was validated according to the International Conference on Harmonization (ICH)
LINEARITY (CALIBRATION CURVE)
Avalabile online at www.ijpda.com
Bharat G.Chaudhari,Heena J.Patel; Vol: 2 Issue:3 Page:148-154
0.4,0.6, 0.8, 1.0, 1.2, 1.4, 1.6 ml) and DIC (0.3, 0.4, 0.6, 0.8, 1.0, 1.2, 1.4, 1.6 ml) were transferred to a series of 10 ml of volumetric flasks and diluted to the mark with methanol. The absorbances of the standard solutions were measured at 218.4 nm and 271.8 nm against methanol as blank. The calibration curves were constructed by plotting absorbance versus concentrations and the regression equations were calculated.
METHOD PRECISION (REPEATABILITY)
The precision of the instrument was checked by repeated scanning and measuring the absorbance of solutions (n = 6) of CEF and DIC (10 µg/ml for both drugs) without changing the parameters of the proposed Method. The results are reported in terms of relative standard deviation (% RSD).
INTERMEDIATEPRECISION (REPRODUCIBILITY)
The intra-day and inter-day precision of the proposed method was evaluated by analyzing the corresponding responses 3 times on the same day and on 3 different days over a period of 1 week for 3 different concentrations of sample solutions of CEF and DIC (8, 10, and 12µg /ml). The results are reported in terms of relative standard deviation (% RSD).
LIMIT OF DETECTION (LOD) & LIMIT OF QUANTIFICATION (LOQ)
The limit of detection (LOD) and limit of quantification (LOQ) of the method were calculated by using the following equations.
LOD = 3.3 X σ/S LOQ = 10 X σ/S
Where, σ = the standard deviation of the response S = slope of the calibration curve
ACCURACY (% RECOVERY STUDY)
he accuracy of the method was determined by calculating recoveries of CEF and DIC by the standard addition method. Known amounts of standard solution of CEF and DIC were added at three levels (50 %, 75 % and 100 %) to pre-quantified sample solutions of CEF and DIC.
ANALYSIS OF TABLET SAMPLE
Twenty tablets were weighed individually and powdered. Labelled claim: 200 mg CEF and 500 mg DIC. Quantity of the powder equivalent to 10 mg CEF was transferred to 100 ml volumetric flask containing 50 ml methanol, cork it and sonicated for 20 min. The solution was filtered through Whatman filter paper No. 41 and the volume was adjusted up to the mark with distilled water. From this solution, 0.6 ml was taken in to a 10 ml volumetric flask
and the volume was adjusted up to mark with methanol to get a concentration of CEF (6.0 µg/ml) and DIC (15.0 µg/ml). The absorbance of sample solution was measured against methanol as blank at 218.4 nm and 271.8 nm for quantification of CEF and DIC. The amount of CEF and DIC present in the sample solutions were determined by regression equation.
RESULTS AND DISCUSSION
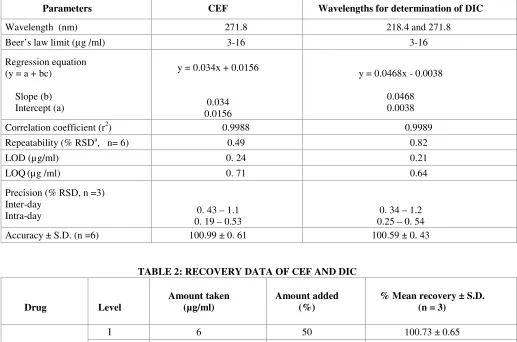
The utility of dual wavelength method is to calculate the unknown concentration of a component of interest present in a mixture containing both the components of interest and an unwanted interfering component by the mechanism of the absorbance difference between two points on the mixture spectra. The calibration curves were prepared at 271.8 nm (only for CEF) and at absorbance difference of two wavelengths (271.8 nm – 218.4 nm) for the DIC. The response for the CEF (at 271.8 nm) was found to be linear in the concentration range 3 to 16 µg/ml and at absorbance difference of two wavelengths (271.8 nm – 218.4 nm), the response was found to be linear in the concentration range 3 to 16 µg/ml. The linearity of the calibration curve was validated by the high values of correlation coefficient. The % RSD of repeatability for CEF at 271.8 nm was 0.49 % and at absorbance difference of two wavelengths for DIC was found to be 0.82 %. Low RSD value means the repeatability of the proposed method is good. The low % RSD of intraday and interday indicate that the proposed method is precise. LOD and LOQ values at 271.8 nm were found to be 0.24 and 0.71 respectively and at at absorbance difference of two wavelengths (271.8 nm – 218.4 nm) were found to be 0.21 and 0.64 respectively. These values indicate that the method is sensitive for the detection of CEF and DIC. The regression analysis data and summary of validation parameters for the proposed method is summarized in Table-1. The recovery experiment was performed by the standard addition method. The results (Table-2) obtained (n=3 for each level 50%, 75%, 100% level) indicated the mean recovery 100.99 ± 0.61 and 100.59 ± 0.43 for CEF and DIC, respectively. These values of recovery experiment reveal that the proposed method is highly accurate.
TABLE 1: REGRESSION ANALYSIS DATA AND SUMMARY OF VALIDATION PARAMETERS FOR CEF AND DIC
Parameters CEF Wavelengths for determination of DIC
Wavelength (nm) 271.8 218.4 and 271.8
Beer’s law limit (µg /ml) 3-16 3-16
Regression equation (y = a + bc)
Slope (b) Intercept (a)
y = 0.034x + 0.0156
0.034 0.0156
y = 0.0468x - 0.0038
0.0468 0.0038
Correlation coefficient (r2) 0.9988 0.9989
Repeatability (% RSDa, n= 6) 0.49 0.82
LOD (µg/ml) 0. 24 0.21
LOQ(µg /ml) 0. 71 0.64
Precision (% RSD, n =3) Inter-day
Intra-day 0. 43 – 1.1
0. 19 – 0.53
0. 34 – 1.2 0.25 – 0. 54
Accuracy ± S.D. (n =6) 100.99 ± 0. 61 100.59 ± 0. 43
TABLE 2: RECOVERY DATA OF CEF AND DIC
Drug Level
Amount taken (µg/ml)
Amount added (%)
% Mean recovery ± S.D. (n = 3)
CEF
I 6 50 100.73 ± 0.65
II 6 75 101.55 ± 0.71
III 6 100 100.68 ± 0.48
DIC
I 8 50 99.96 ± 0.58
II 8 75 101.32 ± 0.39
III 8 100 100.49 ± 0.32
S. D. is Standard deviation and n is number of replicate
TABLE 3: ANALYSIS OF CEF AND DIC IN TABLET DOSAGE FORM
Tablet Label claim (mg) % Label claim ± S. D. (n = 6)
CEF DIC CEF DIC
I 200 500 98.97 ± 0.42 100.80 ± 0.28
II 200 500 99.57 ± 0.61 100.90 ± 0.52
III 200 500 99.36 ± 0.39 101.03 ± 0.45
Avalabile online at www.ijpda.com
Bharat G.Chaudhari,Heena J.Patel; Vol: 2 Issue:3 Page:148-154
CONCLUSION
Based on the results which have been obtained from the analysis using proposed method, it can be concluded that the method has linear response in the range 3 to 16 µg /ml for both the drugs, CEF and DIC. The result of the analysis of three different marketed tablet dosage forms by the proposed method is highly reproducible, reliable, as well as in agreement with label claim of the drugs. The additive present in the synthetic mixture did not interfere in the analysis. So that, the method can be used for the routine analysis of drugs in combination.
ACKNOWLEDGEMENT
The authors are thankful to Brussel Laboratories Pvt. Ltd, Changodar, Ahmedabad, India for providing gift sample of CEF and DIC for carry out the research work. The authors are highly thankful to Shree S. K. Patel College of Pharmaceutical Education and Research, Ganpat University, Ganpat Vidyanagar – 384012, Mehsana, Gujarat, India for providing all the facilities to carry out the research work.
REFERENCES
1) O’Neill MJ. The Merck Index. An Encyclopedia of Chemicals, Drugs and Biologicals, 14th Edn, Whitehouse Station, New Jersey, 2001; 1924.
2) Tripathi KD. Essential of Medical Pharmacology, 6th Edn, Jaypee Brothers Publication, New Delhi, 2009; 706.
3) Indian Pharmacopeia, Vol. III, 6th Edn, New Delhi, The Controller Publication, Govt of India, 2010; 1012-1014.
4) \British Pharmacopoeia, Vol. II. Stationary office. London Medicines and Healthcare product regulatory agency, 2010; 410-411.
5) The United State Pharmacopeia, USP27-NF22, Volume- II. The United state Pharmacopeial Convention, Rockville, Inc., 2009;1834-1836.
6) Dey SS, Kumar PP, Upadhayay UM. UV spectrophotometric determination of cefixime in bulk and its dosage Form. Journal of Pharmacy Research 2012; 5(12):5419-5422.
7) Uzochukwu IC, Ejiofor II. Development and validation of ultraviolet spectrophotometric assay method for cefixime and its tablet/capsule formulations. Journal of Pharmaceutical and Allied Sciences 2013; 10(2):1812-1821.
8) Azmi NH, Bashir I, Humaimi SH, Ghafri NS. Quantitative analysis of cefixime via complexation with palladium (II) in pharmaceutical formulations by spectrophotometry. Journal of Pharmaceutical Analysis 2013; 3(4):248-256.
9) Omar FK. Spectrophotometric determination of cefixime by charge transfer complex formation. Journal Baghdad for Science 2013; 10(3):971-976.
10) Nahata MC. Measurement of cefixime in serum and cerebrospinal fluid by high-performance liquid chromatography. Journal of Liquid Chromatography 1991; 14(20):3755-3759.
11) Khaja P, Patil CS, Sadath A, Chimkod VB. Reverse phase HPLC method for the determination of Cefixime in pharmaceutical dosage forms. Research Journal of Pharmaceutical, Biological and Chemical Sciences 2010; 1(3):226-230.
12) Hafiz MA, Gauhar S, Bano R, Iyad NM. Development of HPLC-UV method for analysis of cefixime in raw materials and in capsule. Jordan Journal of Pharmaceutical Sciences 2009; 2(1):53-65.
13) Kandikonda S, Ganesh A, Pandey VP , Kudaravalli S, Saikumar B, Banda RS. Validation of reversed phase HPLC method for the estimation of cefixime in cefixime oral suspension. International Journal of Pharmacy & Technology 2010; 2(2):385-395. 14) Attimarad M, Nair AB. Simultaneous determination
of ofloxacin and cefixime by first and ratio first derivative UV spectrophotometry. Chronicles of Young Scientists 2011;2(3):144-149.
15) Attimarad M, Bander ED Alhaider IA, Nair AB, Sree HN, Mueen AK. Simultaneous determination of moxifloxacin and cefixime by first and ratio first derivative ultraviolet spectrophotometry. Chemistry Central Journal. 2012; 6:105-109.
16) Gadhiya DT, Bagada HL. Simultaneous equation method for theestimation of cefixime trihydarte and linezolid in their combined tablet dosage form by UV-visible spectrophotometry. International Bulletin of Drug Research 2013; 3(5):29-38.
17) Rajendran SS, Santhi N, Kumar NP, Sam Solomon WD, Venkata NR. Simultaneous estimation of cefixime and ofloxacin in bulk and tablet dosage Form. Asian Journal of Pharmaceutical Analysis 2011; 1(2):36-38.
18) Shah H, Patel P, Patel P, Solanki S. Method development and validation of spectrophotometric Methods for simultaneous estimation of cefixime trihydrate and linezolid in their combined tablet dosage form. International Journal of Pharmaceutical and Bio-science 2012; 1(5):516-529. 19) Patel M, Kakadiya J, Shah N. Development and validation of first order derivative spectrophotometric method for simultaneous estimation of cefixime trihydrate and moxifloxacin hydrochloride in combined tablet dosage form. Asian Journal of Pharmaceutical Science and Thechnology 2013; 3(1):19-24.
spectrophotometry. Chemistry Central Journal 2012; 6:105-112.
21) Patel D, Akhtar J, Master S, Lad R. Development of analytical method for simultaneous estimation of cefixime and linezolid In tablet dosage form. Advance Research in Pharmaceuticals and Biological 2013; 3(1):366-369.
22) Sharma R, Pathodiya G, Mishra GP. Simultaneous estimation and validation of Cefixime Trihydrate and Ornidazole in combined solid dosage form using hydrotropic solubilizing agent. Novel Science International Journal of Pharmaceutical Science 2012; 1(8):589-594.
23) Chaudhari BG, Patel B. Development and validation of first derivative spectrophotometric method for simultaneous estimation of cefixime and moxifloxacin in synthetic mixture. International Journal for Pharmaceutical Research Scholars 2012; 1(3):177-184. 24) Patel DP, Goswami K, Patel M. Development and
validation of UV spectrophotometric method for simultaneous estimation of cefixime and linezolid in combined dosage form. International Journal for Pharmaceutical Research Scholars 2012; 1(4):112-118. 25) Kumar A, Nanda S, Chomwal R. Spectrophotometric
estimation of cefixime and ofloxacin in tablet formulation. Journal of Chemical and Pharmaceutical Research 2011; 3(5):705-709.
26) Wankhede AR, Mali PY, Khale AR, Magdum CS. Development and validation of RP-HPLC method for simultaneous estimation of cefixime and cloxacillin in tablet dosage form. International Journal of Pharmaceutical and Biological Archive 2010; 1(2):317-320.
27) Rathinavel G, Mukherjee PB, Valarmathy J, Samueljoshua L, Ganesh M, Saravanan T. A validated RP – HPLC method for simultaneous estimation of cefixime and cloxacillin in tablets. Journal of Chemistry 2008; 5(3):648-651.
28) Sheth JC, Shah DK, Parmar A. RP-HPLC method development and validation for simultaneous estimation of cefixime and cloxacillin in combined tablet dosage form. Journal of Pharmacy Research 2012; 5(6):3422-3425.
29) Rao J, Sethy K, Yadav S. Validated HPTLC method for simultaneous quantitation of cefixime trihydrate and ornidazole in tablet dosage forms. International Journal of Chemical and Pharmaceutical Sciences 2010; 1(2):34-39. 30) Rao VJ, Devika GS, Petchi RR. A validated RP-HPLC
method for simultaneous estimation of cefixime trihydrate and ornidazole in tablet dosage forms. International Journal of Chemical and Pharmaceutical Sciences 2010; 1(2):34-39.
31) Shah CK, Umalkar D. Development of an RP-HPLC method for simultaneous estimation and force degradation of cefixime and moxifloxacin in bulk and
pharmaceutical dosage form. International Journal of Pharmaceutical Research and Boi-science 2012; 1(4):128-147.
32) Patel SA, Patel NJ. Development and validation of RP-HPLC method for simultaneous estimation of cefixime trihydrate and ofloxacin in tablets. International Journal of PharmTech Research 2011; 3(4):1958-1962.
33) Dhoka MV, Gawande VT, Joshi PP. Simultaneous estimation of cefixime trihydrate and erdosteine in pharmaceutical dosage form by using reverse phase high performance Liquid chromatography. International Journal of ChemTech Research 2010; 2(1):79-87.
34) Natesan S, Loganathan R, Krishnaswami V, Sugumaran A. Simultaneous estimation of Cefixime and ofloxacin in tablet dosage form by RP-HPLC. International Journal of Research in Pharmaceutical Science 2011; 2(2):219-224. 35) Patel JV, Patel SA. RP-HPLC method for
simultaneous estimation of cefixime trihydrate and linezolid in tablet dosage form. International Journal of Pharmaceutical, Chemical and Biological Sciences 2013; 3(2):372-379.
36) Kher GJ, Ram VR, Pandiya GG, Joshi HS. Validated LC method for simultaneous analysis of cefixime and ornidazole in commercial tablets. International Journal of ChemTech Research 2012; 4(3):1124-1136.
37) Trivedi KJ, Chokshi PV, Patel NS. Development and validation of RP-HPLC method for analysis of cefixime trihydrate and sulbactam sodium in their combination tablet dosage form. International Journal of ChemTech Research 2012; 4(4):1628-1632.
38) Malothu R, Vasanth PM, Rao SY. Development and validation of an rapid RP-HPLC method for simultaneous determination of drug cefixime and ornidazole in tablet dosage form. International Journal of Biological & Pharmaceutical Research 2012; 3(6):747-751.
39) Sheth JC, Shah DK, Parmar A. RP-HPLC method development and validation for simultaneous estimation of cefixime and cloxacillin in combined tablet dosage form. Journal of Pharmacy Research 2012; 5(6):3422-3425. 40) Rao AL. Development and validation of novel
HPLC method for simultaneous estimation of cefixime and moxifloxacin in combined tablet dosage form. International Journal of Pharmacy 2013; 3(3):621-627.
Avalabile online at www.ijpda.com
Bharat G.Chaudhari,Heena J.Patel; Vol: 2 Issue:3 Page:148-154
42) Indian Pharmacopeia, Vol. III, 6th Edn, New Delhi, The Controller Publication, Govt of India, 2010; 1201-1204. 43) British Pharmacopoeia, Vol. II. Stationary office. London
Medicines and Healthcare product regulatory agency, 2010; 674-675.
44) The United State Pharmacopeia, USP27-NF22, Volume- II. The United state Pharmacopeial Convention, Rockville, Inc., 2009; 2127-2128.
45) Lauriault G, Awang D, Kindack D. The high-performance liquid chromatographic determination of dicloxacillin in presence of its degradation products. Journal of Chromatography1984; 2(3):449-452.
46) Harale RB, Dhoka MV, Damle MC. Detemination of dicloxacillin in human plasma by HPLC method. International Journal of PharmTech Research 2013; 5(2):407-413.
47) Morelli B. Second-derivative spectrophotometric assay of mixtures of dicloxacillin sodium and ampicillin sodium in pharmaceuticals. Journal of Pharmaceutical Science 1988; 7(13):1042-1046.
48) Acharya DR, Patel DB, Patel VV. Development and validation of first order derivative spectrophotometric method for simultaneous estimation dicloxacillin and cefpodoxime proxetil in tablet dosage form. Journal of Drug Delivery & Therapeutics 2012; 2(1):1-5.
49) Nour F, Mohamed G, Farag E. Spectrophotometric determination of flucloxacillin and dicloxacillin in pure and dosage forms. Spectrochimica Acta Part A: Mol Biomol Spect 2006; 6(4):210-215.
50) Barot T, Patidar K, Kshartri N, Vyas N. Development and validation of LC method for the determination of ampicillin and dicloxacillin in pharmaceutical formulation using an experimental design. Journal of Chemistry 2009; 4(6):955-964.
51) Kathiresan K, Murugan R, Hameed M, Inimai K, Kanyadhara T. Analytical method development and validation of cefixime and dicloxacillin tablets by RP-HPLC. Rasayan Journal of Chemistry 2009; 6(2):588-592.
52) Walily A, Anwar F, Eid M, Awaad H. The high-performance liquid chromatographic and derivative ultraviolet spectrophotometric determination of amoxycillin and dicloxacillin mixtures in capsules. Journal of Chemical Analalysis 1992; 11(7):981-984. 53) Patel HA, Vaghela JP, Shah JS, Patel PB. Development
and validation of the RP-HPLC method for the estimation of cefpodoxime and dicloxacillin in their combined dosage form and its application to the dissolution study. International Journal of Pharmaceutical Sciences Review and Research 2012; 15(2):50-56.
54) Samanidou VF, Dimitrios E, Papadaki GA. Development and validation of an HPLC method for the determination of seven penicillin antibiotics in veterinary drugs and bovine blood plasma. Journal of Sepectroscopy Science 2009; 32:1302-1311.
55) Barot TG, Patidar K, Kshartri N, Vyas N. Development and validation of LC method for the determination of ampicillin and dicloxacillin in pharmaceutical formulation using an experimental design. E-Journal of Chemistry 2009; 6(4):955-964. 56) Acharya DR, Patel DB. Development and validation
of RP-HPLC method for simultaneous estimation of cefpodoxime proxetil and dicloxacillin sodium in tablets. Indian Journal of Pharmaceutical Science 2013; 75(1):31-35.
57) Kathiresan K, Kanyadhara T. Analytical method development and validation of cefixime and dicloxacillin tablets by RP-HPLC. Rasayan Journal of Chemistry 2009; 2(3):588-592.
58) Prabhudev MS, Kallur HJ, Durgad AS, Sawanth PS. Development and validation of an RP-HPLC method for determination of cefixime and dicloxacillin in tablet dosage form. International Journal of Advances in Pharmaceutical Analysis 2013; 3(2):42-50.
59) Kathiravan S, Anbarasi B, Mathankumar S.
Analytical method development and validation of cefixime and dicloxacillin tablet by RP-HPLC. Asian Journal of Research in Chemistry 2010; 3(4):865-868.
60) Dhoka MV, Sandage SJ, Dumbre SC. Simultaneous determination of cefixime trihydrate and dicloxacillin sodium in pharmaceutical dosage form by reversed-phase high-performance liquid chromatography. Journal of AOAC International 2010; 93(2):531-535.