Optimization of Overall Efficiency using Facilities
Planning in ROPP Cap Making Industry
Prashanth R Varun S J
B.E Student B.E Student
Department of Industrial Engineering& Management Department of Industrial Engineering& Management
MSRIT, Bangalore, India MSRIT, Bangalore, India
Anoop Reddy Vikas K
B.E Student B.E Student
Department of Industrial Engineering& Management Department of Industrial Engineering& Management
MSRIT, Bangalore, India MSRIT, Bangalore, India
Dr. S. Bharath Guide
Department of Industrial Engineering& Management MSRIT, Bangalore, India
Abstract
Facilities Planning refers to the design, layout and placement of facilities such as machinery, equipment, people, tools, storage areas etc. within a physical spatial environment in a way that allows the fastest material flow at the best possible cost while trying to achieve the lowest amount of material handling from the raw material stage to the finished good stage, thereby reducing bottlenecks, idle time and increasing the efficiency & use of equipment, manpower, space and time. The industry criteria of managing changes from process based layout to product based layout. The primary aim of our project is to study the manufacturing facility at Indus Metal Packaging in Peenya, Bangalore and use facilities planning methods such as - Immer’s method which can be applied to any layout problem & involves a structured step by step procedure to create layout solutions, in order to optimize the overall efficiency of the manufacturing process and facility.
Keywords: Immers principle, facility planning, process and product layout
________________________________________________________________________________________________________
I. INTRODUCTION
Indus Metal Packaging is a Manufacturing company that was founded by MR. KAMATH IN 1996 in KSSIDC Industrial estate, 2nd STAGE PEENYA.
Indus Metal Packaging is a high volume manufacturer of aluminium roll on pilfers proof caps (a.k.a ROPP caps) and supply to large number of customers in the South Indian market sector who use these caps for their products such as liquor bottles, medicine bottles, disinfectant bottles, etc.
Indus Metal Packaging has been in business for over two decades and has been a big player in manufacturing of caps in the local market. They have static production as they produce products throughout the year.
The plant at Peenya currently produces roughly 8.5 Lakh caps a day and runs for about 10 hours a day with 10-12 workers.
II. PROBLEM STATEMENT
A Manufacturing facility can perform at its highest level only when all of its inefficiencies and wastages are removed or minimized.
Here at Indus Metal Packaging we had observed inefficiencies with respect to the flow of materials & goods due to the layout of the manufacturing facility which has been the result of inadequate foresight in planning at the early stages. The need to change from process based layout to product based layout.
Time study
Simulation analysis
Data collection
IV. IMMER’S METHOD OF FACILITIES PLANNING
The methodology used in proposing a new layout is based on Immer’s principle of material flow.[2] It states the conversion of material flow lines to machine flow lines.
The Immer’s is used mostly in most product based layout as the volume produced is exponentially large. The method brings continuity and effective use of the layout to maximize the production at hand. The key factors in achieving Immer’s is by time management and maximum utilization of the machine true production capabilities. This optimizes the plant layout to produce more caps by reducing inefficiency caused by time.[2]
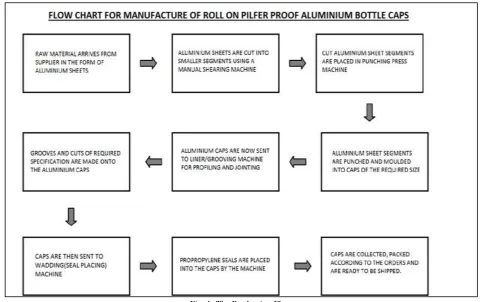
V. THE PRODUCTION FLOW
Fig. 1: The Production Flow
VI. THE OLD LAYOUT
Fig. 2: The Old Layout
The pre -existing layout is a process type of layout where the manufacturing machines are placed together or the same type of machine are clubbed together to produce the same type of material. This process layout planning of grouping was stressed too much and therefore had a negative impact on the number of units produced. This loss of production was mainly due to the travelling time from one machine to another because they were placed in groups hence transferring the caps from one machine to another in bins and batches was one of the greatest problems this layout faced as their growing demands were not meet. Hence longer work hours were in order to meet those demands put stress on the workers and compensation for over time.
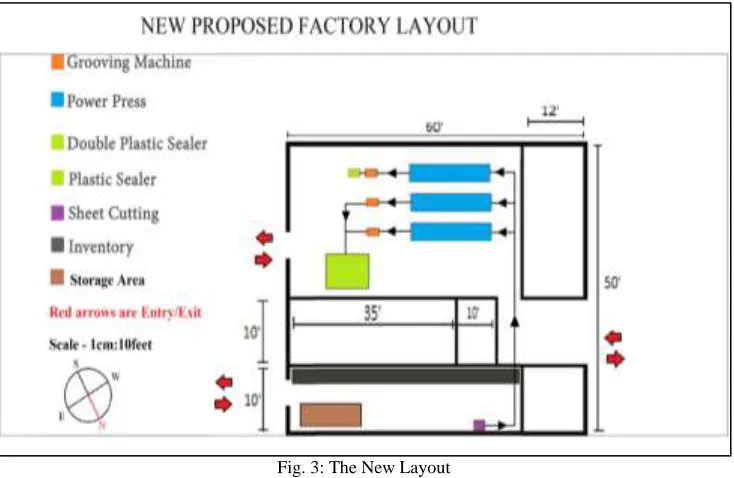
VII.THE NEW LAYOUT
Fig. 3: The New Layout
VIII. SIMULATION ANALYSIS
The simulation analysis can give the ideal situation where the system can run and takes time about the material flow in each division.
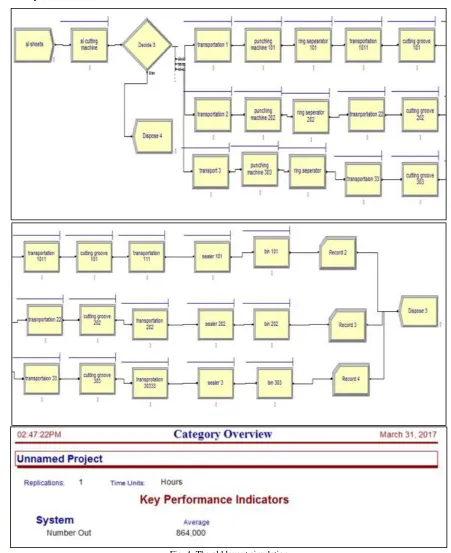
The Old Layout Simulation
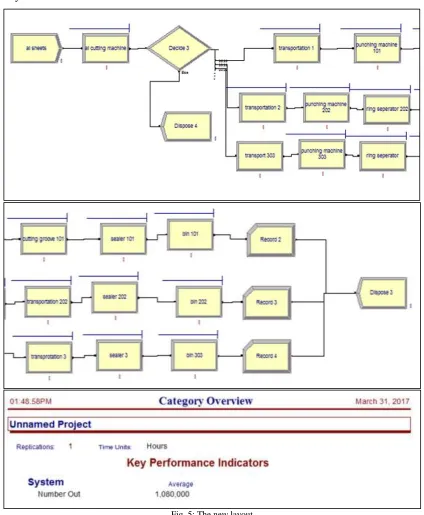
The new layout
Fig. 5: The new layout
The production of caps from the old plant layout was 8, 64,000 caps with the total number of 10 working hours. By estimation after implementation an increase of 20% in production that results in roughly 10, 80,000 caps in the same working hours.
IX. TIME STUDY
Individual Production Line Time Study
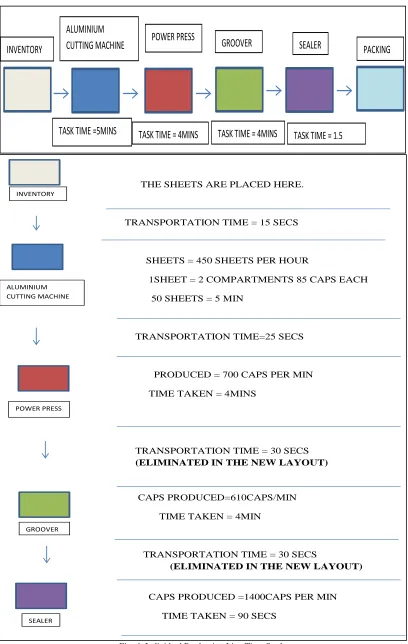
Fig. 6: Individual Production Line Time Study
INVENTORY
ALUMINIUM
CUTTING MACHINE
POWER PRESS
GROOVER
SEALER
PACKING
TASK TIME = 1.5
TASK TIME = 4MINS
TASK TIME = 4MINS
TASK TIME =5MINS
THE SHEETS ARE PLACED HERE.
TRANSPORTATION TIME = 15 SECS
SHEETS = 450 SHEETS PER HOUR
1SHEET = 2 COMPARTMENTS 85 CAPS EACH
50 SHEETS = 5 MIN
TRANSPORTATION TIME=25 SECS
PRODUCED = 700 CAPS PER MIN
TIME TAKEN = 4MINS
TRANSPORTATION TIME = 30 SECS (ELIMINATED IN THE NEW LAYOUT)
CAPS PRODUCED=610CAPS/MIN
TIME TAKEN = 4MIN
TRANSPORTATION TIME = 30 SECS
(ELIMINATED IN THE NEW LAYOUT)
CAPS PRODUCED =1400CAPS PER MIN
TIME TAKEN = 90 SECS
Data Collection:
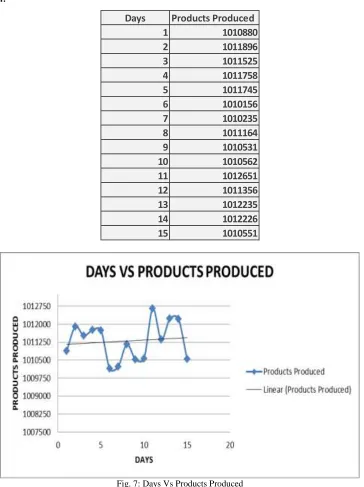
Fig. 7: Days Vs Products Produced
The pilot study showed us an improvement of 17% over the old layout as displayed in the data above, which was very close to our estimate of 20%.
The loss of that 3% can be attributed to machine breakdowns, power failures and other minor inefficiencies. The linear trend shows that reaching high demands is easier in the new layout without much effort.
Nevertheless the management was pleased with the results of the pilot study and decided to permanently implement the layout we had designed.
X. RESULTS
The new layout showed us a production value of approximately 10,80,000 caps per day over a 15 day period
After observing and analyzing the production values over each of these 15 days it can be seen that there is an average of a 17%
Days
Products Produced
1
1010880
2
1011896
3
1011525
4
1011758
5
1011745
6
1010156
7
1010235
8
1011164
9
1010531
10
1010562
11
1012651
12
1011356
13
1012235
14
1012226
REFERENCES
[1] Facilities Planning By Tompkins, James A.; White, John A.; Bozer,Yavuz A.; Tanchoco, J. M. A. Published by Wiley (2010) [2] Facility Planning And Layout Design By Chandrashekar Hiregoudar Technical Publications, (Jan 2007)
[3] Facilities Design By Sunderesh S. Heragu, Published by iUniverse, (2006)
[4] Manufacturing Facilities Design & Material Handling Hardcover – Import, ( Apr 2013) by Matthew P. Stephens and Fred E. Meyers.
[5] Facility Management Challenges and Opportunities in the Malaysian Property Sector by Syed Abdul Haris bin Syed Mustapa & Haminah Adnan – Journal of Sustainable development – Vol. 1,No.2 July 2008
[6] Productivity Improvement of a manufacturing facility using systematic layout planning – By Syed Asad Naqvi, Muhammad Fahad , Muhammad Atir & Muhammad Zubair – Cogent Enineering Journal - Vol.3 – 29 June 2016
[7] A Literature Review of facility planning and plant layouts – By M.H.Kulkarni & S.Bhatwadekar & H.M.Thakur – International Journal of Engg. Sciences & research technology – March 2015
[8] Facility layout and location: an analytical approach, R. L. Francis, John A. White, 0132991497, 9780132991490, Publisher : Prentice-Hall, 1974. [9] AmineDrira, Henri Pierreval , Sonia Hajri-Gabouj . (2007). Facility layout problems: A survey. Annual Reviews in Control 31, 255.
[10] RezaZanjiraniFarahani, Maryam SteadieSeifi, NasrinAsgari (2009). Multiple criteria facility location problems: A survey. Applied Mathematical Modelling 34,